1. Page 1 of 5
Market Review and Outlook QE Index and Volume
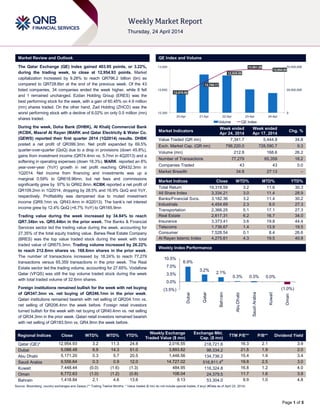
The Qatar Exchange (QE) Index gained 403.95 points, or 3.22%,
during the trading week, to close at 12,954.93 points. Market
capitalization increased by 9.28% to reach QR796.2 billion (bn) as
compared to QR728.6bn at the end of the previous week. Of the 43
listed companies, 34 companies ended the week higher, while 8 fell
and 1 remained unchanged. Ezdan Holding Group (ERES) was the
best performing stock for the week, with a gain of 60.45% on 4.9 million
(mn) shares traded. On the other hand, Zad Holding (ZHCD) was the
worst performing stock with a decline of 6.02% on only 0.5 million (mn)
shares traded.
During the week, Doha Bank (DHBK), Al Khalij Commercial Bank
(KCBK, Masraf Al Rayan (MARK and Qatar Electricity & Water Co.
(QEWS) reported their first quarter 2014 (1Q2014) results. DHBK
posted a net profit of QR399.3mn. Net profit expanded by 69.5%
quarter-over-quarter (QoQ) due to a drop in provisions (down 45.8%),
gains from investment income (QR74.4mn vs. 5.7mn in 4Q2013) and a
softening in operating expenses (down 18.3%). MARK reported an 8%
year-over-year (YoY) growth in net profit reaching QR432.3mn in
1Q2014. Net income from financing and investments was up a
marginal 0.59% to QR618.96mn, but net fees and commissions
significantly grew by 97% to QR62.8mn. KCBK reported a net profit of
QR109.2mn in 1Q2014, dropping by 28.5% and 16.9% QoQ and YoY,
respectively. Profitability was dampened due to muted investment
income (QR9.1mn vs. QR43.4mn in 4Q2013). The bank’s net interest
income grew by 12.4% QoQ (+6.7% YoY) to QR165.9mn
Trading value during the week increased by 34.84% to reach
QR7.34bn vs. QR5.44bn in the prior week. The Banks & Financial
Services sector led the trading value during the week, accounting for
27.35% of the total equity trading value. Barwa Real Estate Company
(BRES) was the top value traded stock during the week with total
traded value of QR675.3mn. Trading volume increased by 26.22%
to reach 212.8mn shares vs. 168.6mn shares in the prior week.
The number of transactions increased by 18.24% to reach 77,279
transactions versus 65,359 transactions in the prior week. The Real
Estate sector led the trading volume, accounting for 27.65%. Vodafone
Qatar (VFQS) was still the top volume traded stock during the week
with total traded volume of 32.6mn shares.
Foreign institutions remained bullish for the week with net buying
of QR347.3mn vs. net buying of QR246.1mn in the prior week.
Qatari institutions remained bearish with net selling of QR204.1mn vs.
net selling of QR206.4mn the week before. Foreign retail investors
turned bullish for the week with net buying of QR40.4mn vs. net selling
of QR34.3mn in the prior week. Qatari retail investors remained bearish
with net selling of QR183.5mn vs. QR4.9mn the week before.
Market Indicators
Week ended
Apr 24, 2014
Week ended
Apr 17, 2014
Chg. %
Value Traded (QR mn) 7,341.7 5,444.8 34.8
Exch. Market Cap. (QR mn) 796,220.0 728,590.7 9.3
Volume (mn) 212.8 168.6 26.2
Number of Transactions 77,279 65,359 18.2
Companies Traded 43 43 0.0
Market Breadth 34:8 27:13 –
Market Indices Close WTD% MTD% YTD%
Total Return 19,318.59 3.2 11.6 30.3
All Share Index 3,334.21 3.0 11.4 28.9
Banks/Financial Svcs. 3,182.36 3.2 11.4 30.2
Industrials 4,454.69 2.3 8.0 27.3
Transportation 2,366.25 5.1 17.1 27.3
Real Estate 2,617.31 6.2 16.7 34.0
Insurance 3,373.41 3.6 19.8 44.4
Telecoms 1,736.67 1.4 13.9 19.5
Consumer 7,528.54 0.1 8.4 26.6
Al Rayan Islamic Index 4,275.61 4.3 19.5 40.8
Market Indices
Weekly Index Performance
Regional Indices Close WTD% MTD% YTD%
Weekly Exchange
Traded Value ($ mn)
Exchange Mkt.
Cap. ($ mn)
TTM P/E** P/B** Dividend Yield
Qatar (QE)* 12,954.93 3.2 11.3 24.8 2,016.55 218,721.6 16.3 2.1 3.9
Dubai 5,088.48 6.9 14.3 51.0 3,893.82 98,334.2 21.5 1.9 2.0
Abu Dhabi 5,171.20 0.3 5.7 20.5 1,448.56 134,736.2 15.4 1.9 3.4
Saudi Arabia 9,556.64 0.3 0.9 12.0 14,727.02 516,811.4#
19.8 2.5 3.0
Kuwait 7,448.44 (0.0) (1.6) (1.3) 484.95 116,324.8 16.8 1.2 4.0
Oman 6,772.63 (1.0) (1.2) (0.9) 106.04 24,379.5 11.7 1.6 3.9
Bahrain 1,418.84 2.1 4.6 13.6 9.13 53,304.0 9.9 1.0 4.8
Source: Bloomberg, country exchanges and Zawya (** Trailing Twelve Months; * Value traded ($ mn) do not include special trades, if any) (#Data as of April 23, 2014)
12,578.58
12,768.17
12,939.80
12,961.56
12,954.93
0
35,000,000
70,000,000
12,300
12,650
13,000
20-Apr 21-Apr 22-Apr 23-Apr 24-Apr
Volume QE Index
6.9%
3.2%
2.1%
0.3% 0.3% 0.0%
(1.0%)(3.5%)
0.0%
3.5%
7.0%
10.5%
Dubai
Qatar
Bahrain
AbuDhabi
SaudiArabia
Kuwait
Oman
2. Page 2 of 5
News
Market & Corporate News
DHBK posts QR399.3mn net profit in 1Q2014 – DHBK
reported a net profit of QR399.3mn vs. our estimate of
QR379.2mn (BBG consensus: QR362.6mn). Net profit
expanded by 69.5% QoQ due to a drop in provisions (down
45.8%), gains from investment income (QR74.4mn vs. 5.7mn in
4Q2013) and a softening in operating expenses (down 18.3%).
On a YoY basis, net income was marginally up by 1.0%. This
was mainly driven by net interest income, which was expanded
by 14.0%. Net loans and deposits grew by 5.6% and 2.2%
YTD, respectively. Thus the LDR rested at 100% vs. 97% at the
end of 2013. (QNBFS Research, Gulf-Times.com)
MARK posts 8% gain in 1Q2014 profit to QR432.27mn –
Masraf Al Rayan (MARK) has reported an 8% growth in net
profit to QR432.3mn in 1Q2014 vs. our estimate of
QR418.6mn. Total expenses grew much faster than total
income. Net income from financing and investments was up a
mere 0.59% to QR618.96mn, but that from net fees and
commissions jumped 97% to QR62.77mn. Net foreign
exchange gains grew 41% to QR18.2mn and other income
more than doubled to QR3.07mn; even as share of results of
associate and joint venture dropped by 54% to QR4.94mn.
MARK’ CEO Adel Mustafawi said total assets grew 11% to
QR69.36bn with loans and advances at QR45.64bn, which was
up 10% YoY. Customers’ deposits increased 15% to
QR52.34bn. (Gulf-Times.com)
QIIK's 1Q2014 net profit jumps 10.2% to QR204mn – Qatar
International Islamic Bank (QIIK) posted 1Q2014 net profit of
QR204mn (inline with our estimate of QR201.1mn), up 10.2%
on the same period last year. QIIK’s CEO Abdulbasit A. al-
Shaibei said the bank's total income in the first quarter of 2014
reached QR362.2mn compared with QR335.9mn in the
corresponding period last year. Total assets reached QR34bn
in the first quarter compared with QR29.3bn in 1Q2013.
Financing assets grew by 27.5 YoY, reaching QR19.9bn .
Deposits totaled QR24.7bn in 1Q2014, a growth of 21% over
the corresponding period in 2013. (Gulf-Times.com)
KCBK 1Q2014 net profit drops QoQ and YoY – Al Khalij
Commercial Bank (KCBK) reported a net profit of QR109.2mn
in 1Q2014 (vs. our estimate of QR125.4mn), dropping by
28.5% and 16.9% QoQ and YoY, respectively. Weak QoQ
results were due to muted investment income (QR9.1mn vs.
QR43.4mn in 4Q2013). The bank’s net interest income grew by
12.4% QoQ (+6.7% YoY) to QR165.9mn. Fees and
commissions grew by 11.3% QoQ (down 20.0% YoY) to
QR37.8mn. On the other hand, operating expenses increased
by 5.0% and 7.3% QoQ and YoY, respectively to QR104.5mn.
As such, the cost-to-income ratio deteriorated to 48.9% in
1Q2014 vs. 40.7% in 4Q2013 (42.1% in 1Q2013). The YoY
drop in profitability was mainly due to a sharp drop in fees and
commissions (down 20.0%) and muted investment income.
KCBK’s loans and deposits expanded by 10.9% and 8.8% YTD,
respectively. Thus the LDR rested at 106% vs. 104% at the end
of 2013. (QNBFS Research, QE)
GISS posted a net income of QR188.6mn, growing by
38.9% YoY – The growth was primarily driven by share of
income from JVs (+81.5% YoY) and other income (QR20.8mn
vs. QR7.8mn in 1Q2013). Growth in revenue (+11.6% YoY)
was dampened by growth in COGS (+14.3% YoY). GDI posted
a revenue QR261.6mn, an increase of 51.1% YoY. Net profit
from the Drilling segment grew by 82.4% YoY reaching
QR33.6mn. Profitability was driven primarily by the
commencement of Al-Jassra and Leshat operations, and higher
daily rates received for the three extended offshore rig
contracts. Revenue from the aviation segment increased by a
moderate QR3.8mn, or 2.5% YoY reaching QR153.0mn.
Aviation segment earnings increased in line with the muted
revenue growth, as the subsidiary registered a modest
QR2.2mn net profit improvement reaching QR56.2mn. The
insurance subsidiary registered gross insurance revenue of
QR191.6mn, implying growth of 18.4% YoY. The main
contributor to this growth was the medical line of business, as
additional 7,500 members joined the Al Koot Global Care
Medical Insurance Scheme. Profit from the Insurance segment
reached QR32.0mn, an increase of 10.7% YoY, as an increase
in major insurance claims were largely offset by the release of
deferred revenue and strong gains on the company’s
investment portfolio. (GISS Press Release, QNBFS Research)
QEWS posts net profit of QR299mn in 1Q2013; earnings
exceed our estimate marginally – Qatar Electricity and Water
Company (QEWS) posted a net profit of QR299mn in
comparison to QR201mn for 1Q2013. Reported net profit beat
our estimate of QR287mn by around 4% and handily exceeded
Bloomberg consensus of QR262.5mn (there was only one other
estimate of QR238mn). The Earnings per Share (EPS)
amounted to QR2.72 in 1Q2014 Vs. QR1.83 in 1Q2013. We
continue to retain our bullish stance on the company but
change our rating to Market Perform given the stock’s price
appreciation. Our price target remains QR200.21. (QNBFS
Research, QE)
QGTS expands LNG fleet with 3 new joint venture vessels;
deal falls in line with our thesis – Qatar Gas Transport
Company (QGTS) has added three new LNG vessels to its fleet
through Maran Nakilat Co. Ltd., its joint venture with Greek
shipping company Maran Ventures Inc. These vessels, which
would be used in international trade, will take Maran Nakilat's
total fleet from 8 vessels to 11. Due to this, QGTS’ LNG fleet
will increase from 58 vessels to 61. Maran Nakilat closed
$807.4mn worth of refinancing provided by Qatar Islamic Bank
and Barwa Bank in order to complete this deal. This deal is in
line with our view on Nakilat. We have previously stated, “We
note Nakilat retains the ability to further expand its fleet
targeting international customers without expending substantial
capex (much like the Maran Nakilat deal, which allows QGTS to
double JV fleet size to 8 LNG tankers, while upping its stake to
40% through a $1.33bn refinancing). We view this recent deal
positively and it falls in line with our thesis. (QNBFS Research,
QGTS Press Release)
Ezdan Holding buys 20.16% of Widam shares – Ezdan
Holding Group announced the acquisition of 20.16% shares of
Widam Food Co (previously Mawashi), in a step to promote the
group’s investments and diversification strategy. Sheikh
Abdullah bin Thani bin Abdullah Al Thani, Deputy Chairman of
the Board of Directors, said that the group’s strategy in the
coming years will be to gradually dissociate from the real estate
sector and allocate the group’s returns in other sectors through
the purchase of shares of companies listed on Qatar Exchange.
(Peninsula Qatar)
3. Page 3 of 5
Qatar Exchange
Top 5 Gainers Top 5 Decliners
Source: Qatar Exchange (QE) Source: Qatar Exchange (QE)
Most Active Shares by Value (QR Million) Most Active Shares by Volume (Million)
Source: Qatar Exchange (QE) Source: Qatar Exchange (QE)
Investor Trading Percentage to Total Value Traded Net Traded Value by Nationality (QR Million)
Source: Qatar Exchange (QE) Source: Qatar Exchange (QE)
60.5%
19.8% 18.4%
13.3% 12.5%
0.0%
31.0%
62.0%
Ezdan Real
Estate
Dlala Holding Mannai Corp. Al Khaleej
Takaful
Insurance
Qatar Islamic
Insurance
-6.0%
-4.2% -4.2% -4.1%
-2.7%
-8.0%
-4.0%
0.0%
Zad Holding Qatar General
Insurance &
Reinsurance
Widam Food
Co.
Gulf
Warehousing
Gulf
International
Services
675.3
577.1
533.6
501.3
342.3
0.0
400.0
800.0
Barwa Real
Estate
Vodafone
Qatar
Masraf Al
Rayan
United
Development
Mazaya Qatar
32.6
20.5
17.5 17.3
15.9
0.0
20.0
40.0
Vodafone Qatar United
Development
Barwa Real
Estate
Qatar Gas
Transport
(Nakilat)
Mazaya Qatar
0%
20%
40%
60%
80%
100%
Buy Sell
52.06% 54.56%
19.04%
21.82%
17.95%
17.40%
10.95% 6.22%
Qatari Individuals Qatari Institutions
Non-Qatari Individuals Non-Qatari Institutions
5,220
2,122
5,608
1,734
(388)
388
(1,000) - 1,000 2,000 3,000 4,000 5,000 6,000
Qatari
Non-Qatari
Net Investment Total Sold Total Bought
4. Page 4 of 5
TECHNICAL ANALYSIS OF THE QE INDEX
Source: Bloomberg
The QE Index extended its phenomenal run for the sixth straight week, recording a new all-time high of 12,961.56 surpassing its previous September 2005
all-time high of 12,892.76. The strong gains on Monday and Tuesday were largely responsible for the index rallying more than 400 points. The index
witnessed gains on every single trading session apart from Thursday, which witnessed profit-booking. The index is experiencing a bull market rally, making
higher tops & higher bottoms and is currently trading in unchartered territory with no resistance level. We believe the index has strong momentum going in
and may continue to extend its rally tagging new highs. On the downside, the index has support near 12,900.0, below which 12,770.0 may provide a good
buying opportunity. Meanwhile, both momentum indicators support the index for a further higher move by remaining in the bullish zone with no immediate
trend reversal signs. Thus, traders may adopt a buy-on-dip strategy and continue to remain bullish.
DEFINITIONS OF KEY TERMS USED IN TECHNICAL ANALYSIS
RSI (Relative Strength Index) indicator – RSI is a momentum oscillator that measures the speed and change of price movements. The RSI oscillates
between 0 to 100. The index is deemed to be overbought once the RSI approaches the 70 level, indicating that a correction is likely. On the other hand, if
the RSI approaches 30, it is an indication that the index may be getting oversold and therefore likely to bounce back.
MACD (Moving Average Convergence Divergence) indicator – The indicator consists of the MACD line and a signal line. The divergence or the
convergence of the MACD line with the signal line indicates the strength in the momentum during the uptrend or downtrend, as the case may be. When the
MACD crosses the signal line from below and trades above it, it gives a positive indication. The reverse is the situation for a bearish trend.
Candlestick chart – A candlestick chart is a price chart that displays the high, low, open, and close for a security. The ‘body’ of the chart is portion between
the open and close price, while the high and low intraday movements form the ‘shadow’. The candlestick may represent any time frame. We use a one-day
candlestick chart (every candlestick represents one trading day) in our analysis.
Doji candlestick pattern – A Doji candlestick is formed when a security's open and close are practically equal. The pattern indicates indecisiveness, and
based on preceding price actions and future confirmation, may indicate a bullish or bearish trend reversal.
Shooting Star/Inverted Hammer candlestick patterns – These candlestick patterns have a small real body (open price and close price are near to each
other), and a long upper shadow (large intraday movement on the upside). The Shooting Star is a bearish reversal pattern that forms after a rally. The
Inverted Hammer looks exactly like a Shooting Star, but forms after a downtrend. Inverted Hammers represent a potential bullish trend reversal.
5. Contacts
Saugata Sarkar Keith Whitney Sahbi Kasraoui
Head of Research Head of Sales Manager - HNWI
Tel: (+974) 4476 6534 Tel: (+974) 4476 6533 Tel: (+974) 4476 6544
saugata.sarkar@qnbfs.com.qa keith.whitney@qnbfs.com.qa sahbi.alkasraoui@qnbfs.com.qa
QNB Financial Services SPC
Contact Center: (+974) 4476 6666
PO Box 24025, Doha, Qatar
DISCLAIMER: This publication has been prepared by QNB Financial Services SPC (“QNBFS”) a wholly-owned subsidiary of Qatar National Bank (“QNB”). QNBFS is regulated by the Qatar
Financial Markets Authority and the Qatar Exchange; QNB is regulated by the Qatar Central Bank. This publication expresses the views and opinions of QNBFS at a given time only. It is not an
offer, promotion or recommendation to buy or sell securities or other investments, nor is it intended to constitute legal, tax, accounting, or financial advice. We therefore strongly advise potential
investors to seek independent professional advice before making any investment decision. Although the information in this report has been obtained from sources that QNBFS believes to be
reliable, we have not independently verified such information and it may not be accurate or complete. While this publication has been prepared with the utmost degree of care by our analysts,
QNBFS does not make any representations warranties as to the accuracy and completeness of the information it may contain, and declines any liability in that respect. QNBFS reserves the right
to amend the views and opinions expressed in this publication at any time. It may also express viewpoints or make investment decisions that differ significantly from, or even contradict, the views
and opinions included in this report.
COPYRIGHT: No part of this document may be reproduced without the explicit written permission of QNBFS.
Page 5 of 5
Source: Bloomberg
Company Name
Price
(April 24)
% Change
5-Day
% Change
YTD
Market Cap.
QR Million TTM P/E P/B Div. Yield
Qatar National Bank 197.50 2.86 14.83 138,197 14.1 2.7 3.5
Qatar Islamic Bank 88.50 5.48 28.26 20,912 15.2 1.9 4.5
Commercial Bank of Qatar 70.30 2.33 19.15 20,875 13.0 1.3 2.4
Doha Bank 67.60 7.30 16.15 17,466 12.3 1.5 6.7
Al Ahli Bank 53.00 1.53 25.27 8,755 16.2 2.3 N/A
Qatar International Islamic Bank 85.80 1.54 39.06 12,987 16.9 2.4 4.4
Masraf Al Rayan 48.65 3.07 55.43 36,488 21.0 3.7 3.1
Al Khaliji Bank 23.20 0.04 16.06 8,352 15.8 1.5 4.3
National Leasing 32.70 1.24 8.46 1,618 18.6 1.2 4.6
Dlala Holding 35.35 19.83 59.95 785 N/M 3.5 a
Qatar & Oman Investment 15.15 9.15 21.01 477 24.1 1.5 4.0
Islamic Holding Group 70.50 4.14 53.26 282 28.5 4.8 2.4
Banking and Financial Services 267,193
Zad Holding 76.50 (6.02) 10.07 1,001 10.1 0.7 4.6
Qatar German Co. for Medical Devices 15.40 11.19 11.19 178 N/M 1.0 N/A
Salam International Investment 14.70 5.23 12.99 1,680 14.8 1.0 6.8
Medicare Group 85.00 4.29 61.90 2,392 24.1 3.0 2.1
Qatar Cinema & Film Distribution 42.50 4.68 5.99 243 21.3 1.7 4.7
Qatar Fuel 253.90 (1.24) 16.18 21,444 17.6 3.4 3.0
Qatar Meat and Livestock 62.00 (4.17) 19.92 1,116 20.9 4.5 3.4
Al Meera Consumer Goods 188.90 3.79 41.71 3,778 17.2 3.0 4.2
Consumer Goods and Services 31,832
Qatar Industrial Manufacturing 48.55 3.96 15.14 2,307 11.4 1.6 5.1
Qatar National Cement 144.00 0.00 21.01 7,070 15.8 2.7 4.2
Industries Qatar 185.00 2.78 9.53 111,925 14.0 3.3 5.9
Qatari Investors Group 67.10 8.58 53.55 8,342 36.9 4.0 1.1
Qatar Electricity and Water 186.00 1.09 12.48 20,460 13.8 3.6 3.7
Mannai Corp. 121.90 18.35 35.60 5,561 11.0 2.5 4.5
Aamal 20.02 5.37 33.47 12,012 23.8 1.7 N/A
Gulf International Services 90.00 (2.70) 84.43 16,726 23.0 5.6 1.8
Mesaieed Petrochemical Holding 35.75 (0.69) N/A 44,913 N/A 3.3 1.0
Industrials 229,317
Qatar Insurance 78.00 4.00 46.62 12,522 15.6 2.4 2.6
Doha Insurance 26.20 9.17 4.80 674 9.8 1.2 7.6
Qatar General Insurance & Reinsurance 45.50 (4.21) 13.99 3,147 1.5 0.7 2.7
Al Khaleej Takaful Insurance 40.00 13.31 42.47 888 13.4 1.4 1.6
Qatar Islamic Insurance 78.60 12.45 35.75 1,179 18.5 4.3 4.8
Insurance 18,411
United Development 24.40 7.96 13.31 8,640 26.8 0.8 3.9
Barw a Real Estate 38.80 4.86 30.20 15,098 12.8 1.1 5.2
Ezdan Real Estate 50.30 60.45 195.88 133,421 N/M 4.7 0.6
Mazaya Qatar Real Estate Development 21.50 4.62 92.31 2,150 16.1 1.8 2.8
Real Estate 159,308
Qatar Telecom 148.00 (0.67) 7.87 47,407 18.4 1.9 2.7
Vodafone Qatar 17.96 10.32 67.69 15,183 N/M 2.5 N/A
Telecoms 62,591
Qatar Navigation (Milaha) 101.00 4.12 21.69 11,567 12.1 0.9 5.0
Gulf Warehousing 55.60 (4.14) 33.98 2,644 24.0 3.5 2.7
Qatar Gas Transport (Nakilat) 23.85 7.92 17.78 13,356 18.1 3.0 4.6
Transportation 27,567
Qatar Exchange 796,220