SlideShare ist ein Scribd-Unternehmen logo
1 von 7
Analyst Note>

Autofacts

R

January 2014

Quarterly Forecast Update
A happy new year for the industry

The European Union is starting to show signs of growth… capacity is
expanding in North America and developing Asia-Pacific… improvement in
economic conditions has led to gains in consumer confidence...
These are all positive indications of what’s to come for the industry in 2014.
Global: Regional Assembly Topline Outlook
2014
Developing
Asia-Pacific

North
America

European
Union

Developed
Asia-Pacific

South
America

Eastern
Europe

Middle East &
Africa (ME&A)

30.21m

17.03m

16.51m

13.37m

4.69m

3.88m

1.67m

Source: Autofacts 2014 Q1 Data Release

Positive outlook for 2014
While much of 2013 was centered around lingering
questions of when the European Union would turn
itself around, 2014 appears to be the year where
most regions will show year-over-year (YoY) growth.
The lone exception continues to be the developed
Asia-Pacific region, which is forecasted to decline
~1.5% in 2014. Recent announcements to remove
significant capacity in South Korea, Japan and
Australia have long-term implications, but the
recent weakening of the Yen should help buoy
Japanese assembly in the near term.
Looking at the global topline, Autofacts is
forecasting light vehicle assembly to reach 87.4m
units in 2014 for increase of 5.8% from 2013. The
European Union is forecasted to grow by 3.6% – a
slower rate than the global topline, but growth itself
is significant nonetheless as it would represent a
turning point for the struggling region. Accelerated
growth is anticipated to begin in 2015 and onward.

1

Autofacts

Another major story line of 2013 was the continued
comeback of the North American market. 2014
promises to be another strong year for assembly,
albeit at a slightly slower rate of growth. Autofacts is
forecasting North American assembly to reach just
over 17m units in 2014, representing a YoY increase
of 4.2%, due primarily to increased consumer
demand and new capacity being added.
It should come as no surprise that growth within the
developing Asia-Pacific region will continue at a
feverish pace, led by additional assembly and
capacity investment in China. The region is expected
to reach an impressive 30.2m units of assembly in
2014 – a YoY increase of 11.6%. China alone is
forecasted to contribute 20.8m units, or 24% of the
global assembly topline growth in 2014, further
solidifying itself as the world’s most important
automotive market. With such a positive outlook,
2014 is shaping up to be a good year indeed for the
industry.
For information regarding our
products and services please visit us at
www.autofacts.com
Analyst Note Plus

Developing Asia-Pacific
China and India

India Sales

2013 Key Statistics
(YTD through November)

% Change
(YoY)

China light vehicle sales

+14.2%

China light vehicle assembly

+13.5%

India light vehicle sales

-7.6%

India light vehicle assembly

-3.7%

China Sales
The Chinese market continued to grow at a robust
pace, even amidst the economic uncertainty
experienced in pockets globally. After scant growth
in 2011 (1.3%) and healthy increase in 2012 (6.5%),
China was expected to enter into a more moderate
phase of growth. 2013 surpassed these tempered
expectations with 14.2% growth through November
2013. The annual growth number is expected to
climb past 15%, as December sales are generally
strong for the market. This robust growth is a result
of several positive factors, including the return of
Japanese brands after the territorial dispute in the
second half of 2012. The top three Japanese brands
saw healthy sales gains for domestically-produced
vehicles, with Honda, Nissan, and Toyota growing
20.5%, 18.0% and 9.2% respectively. The growing
working class has also translated into more firsttime buyers and upgrade buyers into showrooms.
As the Chinese market matures, so too will
consumer preferences. To keep up with heightened
expectations, OEMs have continued to launch new
models in the market, even globally debuting select
models in China. This diversification of offerings, as
well as real estate purchase limitations in select
cities, is driving more buyers to invest in more
expensive new vehicles going forward.
China Assembly
Light vehicle assembly volume is expected to grow
12.1% to reach 18.7m units in 2013. For 2014,
Autofacts is forecasting growth of 11.3%, reaching
20.8m units. Much of this expected increase will be
supported by the increase in domestic demand.
SUVs and MPVs are the two fastest growing
segments due to the shifting lifestyles of the average
Chinese buyer. Correspondingly, we anticipate that
production of these vehicles will grow at a quicker
rate through the forecast window.

2

Autofacts

For the first time in 11 years, India’s new vehicle
sales saw a decline in volume in 2013, despite
attempts to jumpstart the market with all-new
models, early product refreshes, and generous
incentives. Passenger vehicle sales fell again in the
month of December, consistent with the weak
performance on the whole in 2013. Part of the
decline was due, at least in part, to a 3% rise in
excise duties on utility vehicles, which had a negative
impact on the otherwise popular SUV segment. High
financing rates, rising fuel prices, price hikes due to
the devalued Rupee, and an increased overall cost of
ownership are also existing, discouraging factors for
potential buyers.
Light commercial vehicles (LCVs) saw a similar fate,
suffering from a lack of industrial mining activity
and stalled infrastructure projects, falling by 15.6%
for the full year.
In the near term, an immediate turnaround in the
Indian auto industry is not expected without policy
corrections and stimulus programs aimed to revive
the struggling market. National elections are
expected in May 2014 and a change in the political
environment could boost business and consumer
sentiment, provided stability will come with the new
government. Key political issues that could impact
the future of the industry include infrastructure
development, reconsideration of their tariff
structure, and recalibration of central bank rates.
India Assembly
To keep pace with slowing demand and bridge the
gap between sales and output, many leading OEMs
scaled back production, and block closures (akin to
line closures) have become a regular occurrence.
Over the past nine months, there have been over a
dozen block closures across factories, along with 75
to 80 no-production days to avoid significant
inventory accumulation, according to industry
estimates. This has led to a decline in inventory and
a corresponding jump in excess capacity to record
highs. Manufacturers are staying afloat with
production cuts and re-thinking future investment
plans, but the short-term outlook remains tenuous
at best.
Given the current and short term conditions in the
market, the market is expected to remain
beleaguered until the latter half of 2014, when a
recovery can begin to take shape. As such, we
For information regarding our
products and services please visit us at
www.autofacts.com
Analyst Note Plus

forecast a market recovery beginning in the second
half of 2014 for a slight growth of 3.5% in assembly
for 2014.

EU+EFTA
% Change
(YoY)

EU+EFTA new car registrations

North America

2013 Key Statistics

-1.8%

EU+EFTA LCV registrations

-1.6%

EU regional assembly

+0.2%

2013 Key Statistics

% Change
(YoY)

US light vehicle sales

+7.5%

Sales

Canada light vehicle sales

+4.0%

Mexico light vehicle sales (through
Nov)

+7.7%

Regional assembly

+6.0%

Against the odds, 2013 turned out to be a better year
than expected for the European Union. Registrations
began to show signs of growth early on in the second
half of the year, but it was the pace of recovery that
was impressive, growing at a rate of 2.7% in Q3 and
~5.7% in Q4. Overall, EU+EFTA new car
registrations for the full year fell to 12.3 units.
Though some markets are still struggling – most
notably France and Italy – the region seems to be on
the road to a recovery after six consecutive years of
market deterioration. Sales of light commercial
vehicles (LCVs) also turned out better than originally
feared with an estimated -1.6% decline to 1.42m
units. The lower rate of decline helped the market
narrowly avoid falling below the previous low point
experienced in 2009.

Sales
The North American markets all saw strong results
in 2013, with light vehicles sales reaching 15.5m
units. 2013 marked the US’s fourth straight year of
recording increases in sales of over 1m units. While
Autofacts anticipates a continuation of the positive
sales growth for 2014, it is expected to be at a slower
pace, reaching 16.2m units.
Canadian sales also enjoyed a banner year, reaching
a new record high as it surpassed the 1.7m units
benchmark for 1.74m units. This positive trend is
expected to continue into 2014 for yet another
record year at 1.76m in sales.
Mexico returned to over 1m units of sales after four
years below this mark, reaching 1.1m units of sales
for new light vehicles. As with Canada, Mexican
sales are expected to continue further in 2014 by an
additional 50k units and inching towards the
historical high for the region.
Assembly
Overall, North American assembly cleared 16m units
in 2013 for the first time since 2002, buoyed by
impressive growth in both the US and Mexico. The
US had the largest assembly gains both on a raw
volume and percentage volume YoY for 2013, but
Mexico will take the lead, percentage wise, in the
mid to long term range. Meanwhile, Canadian
assembly saw a YoY decline and is forecasted to
decline further throughout the forecast window. For
2014, Autofacts forecasts the region to top 17M units
in 2014 and being to challenge the historical high
assembly set in 2000.

3

Autofacts

Despite the relatively positive developments in the
second half of the year, EU+EFTA markets still face
a host of challenges and uncertainty. Continuing
fiscal woes remain for a number of markets while
unemployment is still rising, expected to peak in
early 2014. These lingering concerns keep the
forecasted growth for 2014 at a lower rate of just
over 3% for the full year for 12.7m units. As
conditions stabilize, we expect the pace to accelerate
in 2015 to 5.5% YoY growth. These projections are
similar for the LCV market with growth of 3.4% and
7.3% for 2014 and 2015, respectively.
Looking ahead into the mid- to long-term range,
there are several areas that provide upside potential,
which is best illustrated by the strong recovery now
being seen in some of the markets that were hardest
hit during the financial crisis and recession. Portugal
has now seen seven consecutive months of growth
for a 10.9% increase for the full year. Hungary grew
by 14.6% and Greece by 8.7% in the second half,
albeit from exceptional lows.
Additionally, pent-up demand is increasing after
years of weak consumer sentiment. Once businesses
and consumers are more confident that
For information regarding our
products and services please visit us at
www.autofacts.com
Analyst Note Plus

unemployment concerns are subsiding and
economic indicators continue improving, this pentup demand could drive a stronger, sustained
recovery for the market as whole.
Assembly
Assembly in 2013 was flat compared to 2012, owing
to a strong showing in the final months from a
number of countries, including Germany in
particular. This outperformance was supported by
both the improving demand situation and the
increase in exports to major markets of the US,
China and Turkey. Going forward, light vehicle
assembly should be more closely aligned with
regional EU+EFTA demand, increasing to 16.5m
units in 2014 and 17.4m units by 2015. This
represents a growth rate of 3.6% and 5.6% for the
next two years. Recent announcements of assembly
localization should increase both volume and plant
utilisation even as exports stabilise.

Developed Asia-Pacific
Australia, Japan and South Korea
2013 Key Statistics

% Change
(YoY)

Australia light vehicle sales

+2.2%

Japan light vehicle sales

+0.1%

South Korea light vehicle sales

-2.7%

Regional assembly

-2.8%

though the second half of the year brought signs of
economic recovery and hope that a market revival
may be underway. Positive economic indicators and
a slew of attractive mini vehicles have helped keep
the market from slippage. Mini vehicles have surged
in recent years with lower cost of ownership and
lower taxes. In 2013 alone, the segment grew by 7%
and now makes up nearly 40% of the total market.
Though select taxes will increase on minis in 2015,
they should remain popular as new bodystyle
variants are given the mini treatment.
Looking ahead, sales volumes are expected to take a
hit with a hike in the national sales tax rate from 5%
to 8%, effective April 2014. In the mid- to long-term
range, the market is expected to continue shrinking
with an aging and urbanized population. Though
economic conditions and consumer sentiment may
improve with the 2020 Tokyo Summer Olympics on
the horizon, but whether this will have any marked
impact on the automotive industry is yet to be seen.
Light vehicle assembly volumes in Japan in 2013
remained above 9m units in spite of the slight
decline in export volumes due to aging of major
export models and continuing assembly transfers. As
automakers continue shifting production to overseas
markets, particularly to North America, a decline in
assembly volumes in Japan is expected for 2014 and
beyond. Additional programs are expected to be
transferred in the mid- to long-term range,
prompting Japanese OEMs to reduce capacity and
reconsider their global footprint. Further reduction
in capacity will be needed if current utilisation rates
of ~90% are to be maintained.

Australia

South Korea

In 2013, light vehicle sales are up 2.2% from 2012 to
reach 1.1 mfor a new record in Australia. Popularity
of small cars and SUVs, especially small SUVs,
continued to drive sales, with a combined market
share of 53% in 2013. Meanwhile, mid-to large size
sedans, particularly domestically built models, have
struggled to regain the volumes since the emergence
of more popular sectors. This is a contributing factor
to the exit of major manufacturing operations in the
market, and further reduction of automotive
assembly is expected in the mid- to long-term range.
OEMs are expected to increase import volumes by
leveraging existing assembly capacity elsewhere and
making Australia an export-based market.

The South Korean automotive market has been fairly
stagnant for the last four years, hovering around the
1.3m unit mark. While sales of domestic brands have
seen gradual decline, import sales volume has nearly
doubled between 2010 and 2013 to 200k units as
global OEMs capitalize on free trade agreements.
Looking forward, the South Korean market will be
limited by the same demographic issues facing
Japan with an aging, increasingly urbanized
population. As such, the mid- to long-term
projections for the market will remain relatively flat.

Japan
Light vehicle sales in Japan were relatively flat YoY,
4

Autofacts

Assembly volumes in South Korea decreased slightly
YoY due to the decline of the domestic demand along
with lower demand for South Korean brands in
major overseas markets. Frequent strikes
For information regarding our
products and services please visit us at
www.autofacts.com
Analyst Note Plus

and steadily climbing costs of labour has also taken a
toll, leaving the short-term assembly expectations
flat at ~4.5m units for the remainder of the forecast
window.
South America
2013 Key Statistics
(YTD through November)

% Change
(YoY)

Brazil light vehicle registrations

+7.5%

Argentina light vehicle sales

+4.0%

Venezuela light vehicle registrations +7.7%
Regional assembly

+6.0%

Sales
After a decade of rapid expansion and growth, new
vehicle registrations fell by- 0.9% in 2013 in Brazil.
As with other market contractions, a myriad of
factors had a compounding impact on consumer
spending and thus, demand within South America’s
largest automotive market. A stagnant
macroeconomic environment, high interest rates,
increased transaction prices, and social unrest have
all served to restrain consumer spending,
particularly on big ticket purchases. Perhaps more
concerning was that the IPI tax holiday officially
expired in December, which should have pulled
ahead sales. Instead, demand remained weak. Going
into the new year, IPI increases will be phased in
with an increase of 3% instead of the 7% hike as
previously expected. The tax increase will likely
serve to restrict sales even more in the coming year.
With this in mind, sales in Brazil is expected to stay
relatively flat YoY with just under 1% growth.
While new registrations struggled in Brazil,
Argentina saw an impressive YoY increase in sales,
thanks to the continued currency volatility with the
Argentinean Pesos. As inflation soars past 26% and
the peso reaches record lows near 11.6 pesos against
the dollar, consumers increasingly seek dollars via
the black market exchange, wherein those with
dollars can exchange for pesos then invest in new
vehicles. The used car market is also seeing a sales
surge as vehicles are seen as safe investments
against valuation losses. Barring wholesale overhaul
of monetary policies, sales and registration of new
vehicles is expected to continue growing, albeit at a
slower pace of 8% in 2014.

5

Autofacts

Venezuela is still searching for direction in the
wakeof Hugo Chavez’s death, even with his handpicked successor, Nicolas Maduro, elected into office
in in December 2013. Monetary, fiscal and other
macroeconomic woes have plagued the country,
causing a logistical headache for companies needing
to import and export goods, particularly in the
manufacturing industry. With such pervasive
instability, it’s no surprise that vehicle sales have
dropped, but the nearly 22% dip is still cause for
alarm. With Maduro now elected into power, the
hope is that wide-reaching policies can be enacted
and bring much needed stability to the volatile
nation. Thus, sales in 2014 are expected to improve
on 2013’s poor performance with a 6% YoY increase,
but much investment and change is needed if the
market is to return to the highs reached in the mid2007.
Assembly
Though the political, social, and economic volatility
across the region’s major markets are cause for short
term concern, the South American assembly is still
expected to grow significantly in the long term. With
marquee events like the World Cup in 2014 and the
Summer Olympics in 2016 will require critical
investments in infrastructure, which should improve
Brazil's overall economic environment and spread to
other regional markets. Overall, regional assembly
output is expected to grow by just over 3% for 2014,
but pick up in 2015 as recently announced capacity
investments come online and regional assembly will
surpass the 5m unit mark.

Eastern Europe
2013 Key Statistics

% Change
(YoY)

Russia light vehicle sales

-5.4%

Turkey light vehicle sales

+9.7%

Regional assembly

+2.8 %

Sales
New vehicle sales and registrations within the
Eastern European markets have varied by country.
As Russia continued to slide, Turkey and other
Commonwealth of Independent States (CIS)
countries enjoyed strong sales results for 2013.
For information regarding our
products and services please visit us at
www.autofacts.com
Analyst Note Plus

State-subsidized auto finance programs have
reached the Ministry’s targeted goal of reaching
over 250k in sales up to December, but registrations
remained on the downtrend for the full year in
Russia, suggesting that the decelerating market is
more than a momentary setback. In the short term,
new vehicle sales in Russia will be hindered by slow
economic development, which will translate into
consumer uncertainty and hesitation.
With these ongoing concerns, Russia’s market is
expected to grow by a mere 1% to reach just under
2.8m units for 2014. Meanwhile, Turkey is enjoying
a growth of 9.7% for the full year in 2013. This
growth is expected to continue into 2014 with a 5.6%
jump in sales.

Assembly
Though the Russian sales market remains weak,
light vehicle assembly is expected to show growth,
reaching 2.2m units in 2014 thanks to ongoing
localization and increasing exports to neighboring
countries. More production growth is expected in
2015 and beyond, with investments by global OEMs
to shift towards a domestic production base.
Assembly growth in Turkey has mirrored the
performance of sales, and this is expected to
continue into 2014 with an anticipated 9.5% growth
in assembly and continued expansion throughout
the forecast window. By 2020, assembly in Turkey is
forecasted to surpass 1.5m units. Other developing
CIS markets like Kazakhstan and Uzbekistan will see
growth as well, attracting capacity investments from
OEMs looking to captilise on the region’s growth
potential.

Download the Autofacts App
Now available in Canada, China and Germany, with additional markets coming soon.

© 2014 PwC. All rights reserved. PwC refers to the PwC network and/or one or more of its member firms, each of which is a separate legal entity. Please see www.pwc.com/structure for
further details. This content is for general information purposes only, and should not be used as a substitute for consultation with professional advisors.PwC helps organisations and
individuals create the value they’re looking for. We’re a network of firms in 157 countries with more than 184,000 people who are committed to delivering quality in assurance, tax and
advisory services. Tell us what matters to you and find out more by visiting us at www.pwc.com

6

Autofacts

For information regarding our
products and services please visit us at
www.autofacts.com
Analyst Note Plus

Baseline assembly forecast data - Global
Growth analytics (2013-2018)
Region1

2013

2014

2015

2016

2017

2018

Unit diff.

% chg

CAGR

CTG % Rank2

1 Asia-Pacific - developing

27,077,994

30,205,355

33,736,262

36,868,165

38,979,556

40,291,354

13,213,360

48.8%

8.3%

61.2%

1

2 North America

16,341,199

17,032,595

17,612,413

17,926,427

18,626,929

18,494,039

2,152,840

13.2%

2.5%

10.0%

3

3 European Union
4 Asia-Pacific - developed

15,940,178
13,578,144

16,513,312
13,369,811

17,441,548
13,228,712

18,407,004
13,126,617

18,760,059
12,989,046

18,952,558
12,883,390

3,012,380
-694,754

18.9%
-5.1%

3.5%
-1.0%

14.0%
-3.2%

2
7
4

5 South America

4,548,811

4,692,944

5,132,969

5,591,971

5,892,819

6,164,990

1,616,179

35.5%

6.3%

7.5%

6 East Europe

3,565,239

3,876,775

4,247,440

4,548,802

4,842,046

5,004,242

1,439,003

40.4%

7.0%

6.7%

5

7 Middle East & Africa

1,492,677

1,670,522

1,895,569

2,006,990

2,153,683

2,339,221

846,544

56.7%

9.4%

3.9%

6

100.0%

Global total assembly

82,544,242

87,361,314

93,294,913

98,475,976 102,244,138

104,129,794

21,585,552

26.2%

4.8%

Global total capacity

106,975,130

114,772,195

122,162,357

126,922,877 127,461,782

129,027,217

22,052,087

20.6%

3.8%

24,430,888

27,410,881

28,867,444

28,446,901

25,217,644

24,897,423

466,535

1.9%

0.4%

77.2%

76.1%

76.4%

77.6%

80.2%

80.7%

Global excess capacity
Global utilisation (%)

2013

2014

2015

2016

2017

2018

Unit diff.

% chg

CAGR

1 China

Country

18,716,752

20,837,996

23,430,871

25,475,949

26,854,181

27,630,674

8,913,922

47.6%

8.1%

CTG % Rank
41.3%

1

2 USA

11,019,796

11,748,055

12,230,029

12,529,623

13,049,780

12,913,982

1,894,186

17.2%

3.2%

8.8%

3

3 Japan

9,024,925

8,746,184

8,557,159

8,552,743

8,500,892

8,405,395

-619,530

-6.9%

-1.4%

-2.9%

52

4 Germany

5,673,325

5,747,464

5,919,504

6,008,901

6,130,927

6,201,093

527,768

9.3%

1.8%

2.4%

11

5 India

3,475,715

3,597,242

4,097,666

4,788,355

5,300,151

5,711,072

2,235,357

64.3%

10.4%

10.4%

2

6 South Korea

4,320,546

4,360,036

4,424,477

4,399,748

4,465,724

4,477,995

157,449

3.6%

0.7%

0.7%

20

7 Brazil

3,427,687

3,569,612

3,916,928

4,309,136

4,513,674

4,716,141

1,288,454

37.6%

6.6%

6.0%

4

8 Mexico

2,940,650

3,047,803

3,162,312

3,262,379

3,446,951

3,508,993

568,343

19.3%

3.6%

2.6%

9

9 Thailand

2,555,358

2,878,105

3,168,221

3,414,505

3,554,244

3,608,757

1,053,399

41.2%

7.1%

4.9%

5

10 Spain

2,132,684

2,258,371

2,557,919

2,811,138

2,841,754

2,802,837

670,153

31.4%

5.6%

3.1%

7

11 Russia

2,022,088

2,164,121

2,337,104

2,588,654

2,787,939

2,912,150

890,062

44.0%

7.6%

4.1%

6

12 Canada

2,380,753

2,236,737

2,220,072

2,134,425

2,130,198

2,071,064

-309,689

-13.0%

-2.7%

-1.4%

51

13 France

1,813,972

1,926,519

1,939,867

2,225,799

2,406,814

2,428,145

614,173

33.9%

6.0%

2.8%

8

14 United Kingdom

1,619,257

1,613,232

1,672,939

1,693,394

1,746,827

1,888,041

268,784

16.6%

3.1%

1.2%

16

15 Indonesia

1,121,623

1,427,943

1,491,521

1,570,782

1,605,916

1,641,120

519,497

46.3%

7.9%

2.4%

12

16 Turkey

1,067,072

1,167,974

1,307,760

1,359,796

1,438,727

1,463,382

396,310

37.1%

6.5%

1.8%

13

17 Czech Republic

1,042,113

1,132,382

1,180,287

1,186,859

1,195,817

1,211,257

169,144

16.2%

3.1%

0.8%

19

713,040

789,517

947,329

1,007,411

1,111,536

1,253,614

540,574

75.8%

11.9%

2.5%

10

18 Iran
20 Argentina

813,260

783,833

852,208

902,601

971,816

1,021,037

207,777

25.5%

4.7%

1.0%

17

20 Slovakia

822,037

831,563

797,388

864,482

816,672

795,496

-26,541

-3.2%

-0.7%

-0.1%

45

21 Malaysia

590,410

769,570

825,794

861,020

893,593

916,362

325,952

55.2%

9.2%

1.5%

14

22 Italy

571,866

611,551

845,632

909,035

900,106

866,149

294,283

51.5%

8.7%

1.4%

15

23 Poland

586,495

548,818

596,660

716,264

746,987

735,566

149,071

25.4%

4.6%

0.7%

22

24 South Africa

536,861

559,144

591,471

605,511

622,594

645,660

108,799

20.3%

3.8%

0.5%

24

25 Hungary

298,065

453,905

487,144

446,645

420,646

489,829

191,764

64.3%

10.4%

0.9%

18

26 Romania

394,954

372,907

354,981

348,323

347,065

362,884

-32,070

-8.1%

-1.7%

-0.1%

46

27 Taiwan

326,396

369,340

360,810

370,911

370,254

369,817

43,421

13.3%

2.5%

0.2%

33

28 Belgium

446,079

414,589

299,944

307,849

318,574

345,753

-100,326

-22.5%

-5.0%

-0.5%

49

29 Uzbekistan

269,385

265,026

286,384

286,704

277,087

275,112

5,727

2.1%

0.4%

0.0%

42

30 Morocco

156,013

230,199

240,899

249,353

247,810

245,332

89,319

57.3%

9.5%

0.4%

26

31 Sweden

141,248

140,889

220,177

252,191

256,640

257,783

116,535

82.5%

12.8%

0.5%

23

32 Colombia

151,126

174,995

184,907

188,232

197,079

204,471

53,345

35.3%

6.2%

0.2%

31

33 Pakistan

145,507

162,790

175,551

176,215

181,456

187,252

41,745

28.7%

5.2%

0.2%

34

34 Australia

232,673

263,591

247,076

174,126

22,430

0

-232,673

-100.0% -100.0%

-1.1%

50

35 Portugal

145,530

134,382

150,889

155,419

151,052

173,639

28,109

19.3%

3.6%

0.1%

37

81,695,261

86,336,385

92,079,880

97,134,478 100,823,913

102,737,854

21,042,593

25.8%

4.7%

97.5%

99.0%

98.8%

98.7%

98.7%

97.5%

Top 35 total assembly
Top 35 (% of global total)

98.6%

98.6%

1Developed

Asia-Pacific includes Australia, Japan, South Korea | Developing Asia-Pacific includes China, India, Indonesia, Malaysia, Pakistan, Philippines, Taiwan,
Thailand, Vietnam
2Rankings

based on contribution to total global growth (CTG%).

Source: Autofacts Global Light Vehicle Assembly Outlook 2014 Q1 Data Release (Updated January 01 2014)

7

Autofacts January 2014

For more information please visit us at www.autofacts.com

Weitere ähnliche Inhalte

Was ist angesagt?

Commercial Vehicles in India
Commercial Vehicles in IndiaCommercial Vehicles in India
Commercial Vehicles in IndiaKarishma Purohit
 
2015 China Auto Marketing and Communication Review
2015 China Auto Marketing and Communication Review2015 China Auto Marketing and Communication Review
2015 China Auto Marketing and Communication ReviewHavas
 
Country Analysis India With Special Reference To The Automobile Sector
Country Analysis  India With Special Reference To The Automobile SectorCountry Analysis  India With Special Reference To The Automobile Sector
Country Analysis India With Special Reference To The Automobile Sectoragarwalkhagesh
 
Case study jong sikahn_0723
Case study jong sikahn_0723Case study jong sikahn_0723
Case study jong sikahn_0723Jong-Sik Ahn
 
Automobile
AutomobileAutomobile
AutomobileAsma4646
 
Choice Broking Research-UltraTech Cement.
 Choice Broking Research-UltraTech Cement. Choice Broking Research-UltraTech Cement.
Choice Broking Research-UltraTech Cement.choice broking
 
Global awd light vehicles market research report 2021
Global awd light vehicles market research report 2021Global awd light vehicles market research report 2021
Global awd light vehicles market research report 2021mahesh_mali
 
Luxury car market
Luxury car marketLuxury car market
Luxury car marketDeepak Negi
 

Was ist angesagt? (19)

Commercial Vehicles in India
Commercial Vehicles in IndiaCommercial Vehicles in India
Commercial Vehicles in India
 
MARKETING ASSIGNMENT
MARKETING ASSIGNMENTMARKETING ASSIGNMENT
MARKETING ASSIGNMENT
 
2015 China Auto Marketing and Communication Review
2015 China Auto Marketing and Communication Review2015 China Auto Marketing and Communication Review
2015 China Auto Marketing and Communication Review
 
Auto Components Sectore Report -November 2016
Auto Components Sectore Report -November 2016Auto Components Sectore Report -November 2016
Auto Components Sectore Report -November 2016
 
Country Analysis India With Special Reference To The Automobile Sector
Country Analysis  India With Special Reference To The Automobile SectorCountry Analysis  India With Special Reference To The Automobile Sector
Country Analysis India With Special Reference To The Automobile Sector
 
Case study jong sikahn_0723
Case study jong sikahn_0723Case study jong sikahn_0723
Case study jong sikahn_0723
 
Automobile
AutomobileAutomobile
Automobile
 
Indian Cv Market
Indian Cv MarketIndian Cv Market
Indian Cv Market
 
FMCG Sector Report May 2018
FMCG Sector Report May 2018FMCG Sector Report May 2018
FMCG Sector Report May 2018
 
Manufacturing
ManufacturingManufacturing
Manufacturing
 
Auto sales data - Oct 2019
Auto sales data - Oct 2019Auto sales data - Oct 2019
Auto sales data - Oct 2019
 
It I Te S Sector Report - April 2019
It I Te S Sector Report - April 2019It I Te S Sector Report - April 2019
It I Te S Sector Report - April 2019
 
Choice Broking Research-UltraTech Cement.
 Choice Broking Research-UltraTech Cement. Choice Broking Research-UltraTech Cement.
Choice Broking Research-UltraTech Cement.
 
Auto Coomponents Sector Report - April 2019
Auto Coomponents Sector Report - April 2019Auto Coomponents Sector Report - April 2019
Auto Coomponents Sector Report - April 2019
 
India : Auto components Sector Report_August 2013
India : Auto components Sector Report_August 2013India : Auto components Sector Report_August 2013
India : Auto components Sector Report_August 2013
 
Auto Components Sector Report December 2017
Auto Components Sector Report December 2017Auto Components Sector Report December 2017
Auto Components Sector Report December 2017
 
Global awd light vehicles market research report 2021
Global awd light vehicles market research report 2021Global awd light vehicles market research report 2021
Global awd light vehicles market research report 2021
 
Luxury car market
Luxury car marketLuxury car market
Luxury car market
 
2016-Auto-Trends
2016-Auto-Trends2016-Auto-Trends
2016-Auto-Trends
 

Andere mochten auch

Etude PwC marché automobile européen Q3 (2013)
Etude PwC marché automobile européen Q3 (2013)Etude PwC marché automobile européen Q3 (2013)
Etude PwC marché automobile européen Q3 (2013)PwC France
 
Etude IPO Watch Europe T3 2012
Etude IPO Watch Europe T3 2012Etude IPO Watch Europe T3 2012
Etude IPO Watch Europe T3 2012PwC France
 
Etude PwC sur les transactions sur les portefeuilles de créances (nov. 2014)
Etude PwC sur les transactions sur les portefeuilles de créances (nov. 2014)Etude PwC sur les transactions sur les portefeuilles de créances (nov. 2014)
Etude PwC sur les transactions sur les portefeuilles de créances (nov. 2014)PwC France
 
Etude IPO Watch Q4 2012
Etude IPO Watch Q4 2012Etude IPO Watch Q4 2012
Etude IPO Watch Q4 2012PwC France
 
Etude PwC sur les IPO transfrontalières (2012)
Etude PwC sur les IPO transfrontalières (2012)Etude PwC sur les IPO transfrontalières (2012)
Etude PwC sur les IPO transfrontalières (2012)PwC France
 
Etude PwC sur les priorités des dirigeants de l'industrie pharmaceutique (2013)
Etude PwC sur les priorités des dirigeants de l'industrie pharmaceutique (2013)Etude PwC sur les priorités des dirigeants de l'industrie pharmaceutique (2013)
Etude PwC sur les priorités des dirigeants de l'industrie pharmaceutique (2013)PwC France
 
Etude PwC sur l'immobilier commercial européen (2012)
Etude PwC sur l'immobilier commercial européen (2012)Etude PwC sur l'immobilier commercial européen (2012)
Etude PwC sur l'immobilier commercial européen (2012)PwC France
 
Etude PwC sur les fusions-acquisitions en Chine (2013)
Etude PwC sur les fusions-acquisitions en Chine (2013)Etude PwC sur les fusions-acquisitions en Chine (2013)
Etude PwC sur les fusions-acquisitions en Chine (2013)PwC France
 

Andere mochten auch (8)

Etude PwC marché automobile européen Q3 (2013)
Etude PwC marché automobile européen Q3 (2013)Etude PwC marché automobile européen Q3 (2013)
Etude PwC marché automobile européen Q3 (2013)
 
Etude IPO Watch Europe T3 2012
Etude IPO Watch Europe T3 2012Etude IPO Watch Europe T3 2012
Etude IPO Watch Europe T3 2012
 
Etude PwC sur les transactions sur les portefeuilles de créances (nov. 2014)
Etude PwC sur les transactions sur les portefeuilles de créances (nov. 2014)Etude PwC sur les transactions sur les portefeuilles de créances (nov. 2014)
Etude PwC sur les transactions sur les portefeuilles de créances (nov. 2014)
 
Etude IPO Watch Q4 2012
Etude IPO Watch Q4 2012Etude IPO Watch Q4 2012
Etude IPO Watch Q4 2012
 
Etude PwC sur les IPO transfrontalières (2012)
Etude PwC sur les IPO transfrontalières (2012)Etude PwC sur les IPO transfrontalières (2012)
Etude PwC sur les IPO transfrontalières (2012)
 
Etude PwC sur les priorités des dirigeants de l'industrie pharmaceutique (2013)
Etude PwC sur les priorités des dirigeants de l'industrie pharmaceutique (2013)Etude PwC sur les priorités des dirigeants de l'industrie pharmaceutique (2013)
Etude PwC sur les priorités des dirigeants de l'industrie pharmaceutique (2013)
 
Etude PwC sur l'immobilier commercial européen (2012)
Etude PwC sur l'immobilier commercial européen (2012)Etude PwC sur l'immobilier commercial européen (2012)
Etude PwC sur l'immobilier commercial européen (2012)
 
Etude PwC sur les fusions-acquisitions en Chine (2013)
Etude PwC sur les fusions-acquisitions en Chine (2013)Etude PwC sur les fusions-acquisitions en Chine (2013)
Etude PwC sur les fusions-acquisitions en Chine (2013)
 

Ähnlich wie Etude PwC Autofacts production automobile (fév. 2014)

Etude PwC marché automobile mondial (2013)
Etude PwC marché automobile mondial (2013)Etude PwC marché automobile mondial (2013)
Etude PwC marché automobile mondial (2013)PwC France
 
2014 Q4 NORTH AMERICAN INDUSTRIAL HIGHLIGHTS
2014 Q4 NORTH AMERICAN INDUSTRIAL HIGHLIGHTS2014 Q4 NORTH AMERICAN INDUSTRIAL HIGHLIGHTS
2014 Q4 NORTH AMERICAN INDUSTRIAL HIGHLIGHTSCoy Davidson
 
India Pre-owned Car Market Report - 1st Edition (2016)
India Pre-owned Car Market Report - 1st Edition (2016)India Pre-owned Car Market Report - 1st Edition (2016)
India Pre-owned Car Market Report - 1st Edition (2016)tarunbhatia1990
 
Cox Automotive Market Insight Overview April 2019
Cox Automotive Market Insight Overview   April 2019 Cox Automotive Market Insight Overview   April 2019
Cox Automotive Market Insight Overview April 2019 Philip Nothard
 
CRC Stock Pitch Competition: Ferrari
CRC Stock Pitch Competition: FerrariCRC Stock Pitch Competition: Ferrari
CRC Stock Pitch Competition: FerrariMatthew Brigham
 
Mc Kinsey & Company - The road to 2020 and beyond
Mc Kinsey & Company - The road to 2020 and beyondMc Kinsey & Company - The road to 2020 and beyond
Mc Kinsey & Company - The road to 2020 and beyondLionel Martins
 
The road to 2020 and beyond: Automotive
The road to 2020 and beyond: AutomotiveThe road to 2020 and beyond: Automotive
The road to 2020 and beyond: Automotivebobbyj87
 
Cox Automotive Market Insight Overview June & H1 2019
Cox Automotive Market Insight Overview   June & H1 2019Cox Automotive Market Insight Overview   June & H1 2019
Cox Automotive Market Insight Overview June & H1 2019Philip Nothard
 
PwC Auto M&A Insights 2015
PwC Auto M&A Insights 2015PwC Auto M&A Insights 2015
PwC Auto M&A Insights 2015PwC
 
automobile industry India
automobile industry India automobile industry India
automobile industry India Punith Manupati
 
Cox Automotive Market Insight Overview December & FY 2019
Cox Automotive Market Insight Overview   December & FY 2019  Cox Automotive Market Insight Overview   December & FY 2019
Cox Automotive Market Insight Overview December & FY 2019 Philip Nothard
 
The automobile industry by Sumit Jaiswal
The automobile industry by Sumit JaiswalThe automobile industry by Sumit Jaiswal
The automobile industry by Sumit JaiswalSumeet Jayswaal
 
The automobile industry1__1_
The automobile industry1__1_The automobile industry1__1_
The automobile industry1__1_Sumeet Jayswaal
 
Global Automobile Update H1 2011
Global Automobile Update H1 2011Global Automobile Update H1 2011
Global Automobile Update H1 2011prasadmsr
 
Analysis of indian economy d
Analysis of indian economy dAnalysis of indian economy d
Analysis of indian economy dsaurabhp1988
 

Ähnlich wie Etude PwC Autofacts production automobile (fév. 2014) (20)

Etude PwC marché automobile mondial (2013)
Etude PwC marché automobile mondial (2013)Etude PwC marché automobile mondial (2013)
Etude PwC marché automobile mondial (2013)
 
2014 Q4 NORTH AMERICAN INDUSTRIAL HIGHLIGHTS
2014 Q4 NORTH AMERICAN INDUSTRIAL HIGHLIGHTS2014 Q4 NORTH AMERICAN INDUSTRIAL HIGHLIGHTS
2014 Q4 NORTH AMERICAN INDUSTRIAL HIGHLIGHTS
 
India Pre-owned Car Market Report - 1st Edition (2016)
India Pre-owned Car Market Report - 1st Edition (2016)India Pre-owned Car Market Report - 1st Edition (2016)
India Pre-owned Car Market Report - 1st Edition (2016)
 
Cox Automotive Market Insight Overview April 2019
Cox Automotive Market Insight Overview   April 2019 Cox Automotive Market Insight Overview   April 2019
Cox Automotive Market Insight Overview April 2019
 
CRC Stock Pitch Competition: Ferrari
CRC Stock Pitch Competition: FerrariCRC Stock Pitch Competition: Ferrari
CRC Stock Pitch Competition: Ferrari
 
Mc Kinsey & Company - The road to 2020 and beyond
Mc Kinsey & Company - The road to 2020 and beyondMc Kinsey & Company - The road to 2020 and beyond
Mc Kinsey & Company - The road to 2020 and beyond
 
The road to 2020 and beyond: Automotive
The road to 2020 and beyond: AutomotiveThe road to 2020 and beyond: Automotive
The road to 2020 and beyond: Automotive
 
Automotive Sector Monitor Q2
Automotive Sector Monitor Q2Automotive Sector Monitor Q2
Automotive Sector Monitor Q2
 
Cox Automotive Market Insight Overview June & H1 2019
Cox Automotive Market Insight Overview   June & H1 2019Cox Automotive Market Insight Overview   June & H1 2019
Cox Automotive Market Insight Overview June & H1 2019
 
PwC Auto M&A Insights 2015
PwC Auto M&A Insights 2015PwC Auto M&A Insights 2015
PwC Auto M&A Insights 2015
 
Auto Sector in India
Auto Sector in IndiaAuto Sector in India
Auto Sector in India
 
The New Lubricant Trade in ASEAN
The New Lubricant Trade in ASEANThe New Lubricant Trade in ASEAN
The New Lubricant Trade in ASEAN
 
automobile industry India
automobile industry India automobile industry India
automobile industry India
 
Cox Automotive Market Insight Overview December & FY 2019
Cox Automotive Market Insight Overview   December & FY 2019  Cox Automotive Market Insight Overview   December & FY 2019
Cox Automotive Market Insight Overview December & FY 2019
 
The automobile industry by Sumit Jaiswal
The automobile industry by Sumit JaiswalThe automobile industry by Sumit Jaiswal
The automobile industry by Sumit Jaiswal
 
The automobile industry1__1_
The automobile industry1__1_The automobile industry1__1_
The automobile industry1__1_
 
Global Automobile Update H1 2011
Global Automobile Update H1 2011Global Automobile Update H1 2011
Global Automobile Update H1 2011
 
Project report
Project reportProject report
Project report
 
Advice for The Wise March 2014
Advice for The Wise March 2014Advice for The Wise March 2014
Advice for The Wise March 2014
 
Analysis of indian economy d
Analysis of indian economy dAnalysis of indian economy d
Analysis of indian economy d
 

Mehr von PwC France

Etude PwC "20ème édition de la CEO Survey" - Janvier 2017
Etude PwC "20ème édition de la CEO Survey" - Janvier 2017Etude PwC "20ème édition de la CEO Survey" - Janvier 2017
Etude PwC "20ème édition de la CEO Survey" - Janvier 2017PwC France
 
Etude PwC "Carbon Factor" (nov. 2015)
Etude PwC "Carbon Factor" (nov. 2015)Etude PwC "Carbon Factor" (nov. 2015)
Etude PwC "Carbon Factor" (nov. 2015)PwC France
 
Etude PwC : La transition énergétique pour la croissance verte (nov 2015)
Etude PwC : La transition énergétique pour la croissance verte (nov 2015)Etude PwC : La transition énergétique pour la croissance verte (nov 2015)
Etude PwC : La transition énergétique pour la croissance verte (nov 2015)PwC France
 
Etude PwC "Total Retail 2015" Sur quoi miser aujourd’hui pour réenchanter la ...
Etude PwC "Total Retail 2015" Sur quoi miser aujourd’hui pour réenchanter la ...Etude PwC "Total Retail 2015" Sur quoi miser aujourd’hui pour réenchanter la ...
Etude PwC "Total Retail 2015" Sur quoi miser aujourd’hui pour réenchanter la ...PwC France
 
GEMO 2016 : un digital de plus en plus cannibale ?
GEMO 2016  : un digital de plus en plus cannibale ?GEMO 2016  : un digital de plus en plus cannibale ?
GEMO 2016 : un digital de plus en plus cannibale ?PwC France
 
Infographie PwC GEMO 2016 sur l'industrie Médias et Loisirs (juin 2015)
Infographie PwC GEMO 2016 sur l'industrie Médias et Loisirs (juin 2015)Infographie PwC GEMO 2016 sur l'industrie Médias et Loisirs (juin 2015)
Infographie PwC GEMO 2016 sur l'industrie Médias et Loisirs (juin 2015)PwC France
 
Etude PwC Low Carbon Economy Index (oct. 2015)
Etude PwC Low Carbon Economy Index (oct. 2015)Etude PwC Low Carbon Economy Index (oct. 2015)
Etude PwC Low Carbon Economy Index (oct. 2015)PwC France
 
Etude FCD, ESSEC et PwC sur la distribution responsable (août 2015)
Etude FCD, ESSEC et PwC sur la distribution responsable (août 2015)Etude FCD, ESSEC et PwC sur la distribution responsable (août 2015)
Etude FCD, ESSEC et PwC sur la distribution responsable (août 2015)PwC France
 
Etude PwC IPO Watch
Etude PwC IPO WatchEtude PwC IPO Watch
Etude PwC IPO WatchPwC France
 
Etude PwC CEO Survey Talent "People Strategy for the Digital Age" (juillet 2015)
Etude PwC CEO Survey Talent "People Strategy for the Digital Age" (juillet 2015)Etude PwC CEO Survey Talent "People Strategy for the Digital Age" (juillet 2015)
Etude PwC CEO Survey Talent "People Strategy for the Digital Age" (juillet 2015)PwC France
 
Etude PwC Golden Age Index (juin 2015)
Etude PwC Golden Age Index (juin 2015)Etude PwC Golden Age Index (juin 2015)
Etude PwC Golden Age Index (juin 2015)PwC France
 
Etude PwC Global Economy Watch (juin 2015)
Etude PwC Global Economy Watch (juin 2015)Etude PwC Global Economy Watch (juin 2015)
Etude PwC Global Economy Watch (juin 2015)PwC France
 
Etude PwC et Essec "Grande consommation 1985 - 2015 - 2045"
Etude PwC et Essec "Grande consommation 1985 - 2015 - 2045"Etude PwC et Essec "Grande consommation 1985 - 2015 - 2045"
Etude PwC et Essec "Grande consommation 1985 - 2015 - 2045"PwC France
 
Etude PwC sur le Top 100 des entreprises les mieux valorisées au monde en 201...
Etude PwC sur le Top 100 des entreprises les mieux valorisées au monde en 201...Etude PwC sur le Top 100 des entreprises les mieux valorisées au monde en 201...
Etude PwC sur le Top 100 des entreprises les mieux valorisées au monde en 201...PwC France
 
Etude PwC "Point of View: Enterprise Portfolio & Program Management" (mai 2015)
Etude PwC "Point of View: Enterprise Portfolio & Program Management" (mai 2015)Etude PwC "Point of View: Enterprise Portfolio & Program Management" (mai 2015)
Etude PwC "Point of View: Enterprise Portfolio & Program Management" (mai 2015)PwC France
 
Etude PwC "Bridging the gap" sur les investisseurs institutionnels (mai 2015)
Etude PwC "Bridging the gap" sur les investisseurs institutionnels (mai 2015)Etude PwC "Bridging the gap" sur les investisseurs institutionnels (mai 2015)
Etude PwC "Bridging the gap" sur les investisseurs institutionnels (mai 2015)PwC France
 
Etude PwC, AFDEL et SNJV sur "Les 100 digital"
Etude PwC, AFDEL et SNJV sur "Les 100 digital"Etude PwC, AFDEL et SNJV sur "Les 100 digital"
Etude PwC, AFDEL et SNJV sur "Les 100 digital"PwC France
 
Etude PwC Global Economy Watch (mai 2015)
Etude PwC Global Economy Watch (mai 2015)Etude PwC Global Economy Watch (mai 2015)
Etude PwC Global Economy Watch (mai 2015)PwC France
 
Etude PwC sur l'économie collaborative (mai 2015)
Etude PwC sur l'économie collaborative (mai 2015)Etude PwC sur l'économie collaborative (mai 2015)
Etude PwC sur l'économie collaborative (mai 2015)PwC France
 
Etude PwC sur l'intérêt des investisseurs pour l’Afrique (avril 2015)
Etude PwC sur l'intérêt des investisseurs pour l’Afrique (avril 2015)Etude PwC sur l'intérêt des investisseurs pour l’Afrique (avril 2015)
Etude PwC sur l'intérêt des investisseurs pour l’Afrique (avril 2015)PwC France
 

Mehr von PwC France (20)

Etude PwC "20ème édition de la CEO Survey" - Janvier 2017
Etude PwC "20ème édition de la CEO Survey" - Janvier 2017Etude PwC "20ème édition de la CEO Survey" - Janvier 2017
Etude PwC "20ème édition de la CEO Survey" - Janvier 2017
 
Etude PwC "Carbon Factor" (nov. 2015)
Etude PwC "Carbon Factor" (nov. 2015)Etude PwC "Carbon Factor" (nov. 2015)
Etude PwC "Carbon Factor" (nov. 2015)
 
Etude PwC : La transition énergétique pour la croissance verte (nov 2015)
Etude PwC : La transition énergétique pour la croissance verte (nov 2015)Etude PwC : La transition énergétique pour la croissance verte (nov 2015)
Etude PwC : La transition énergétique pour la croissance verte (nov 2015)
 
Etude PwC "Total Retail 2015" Sur quoi miser aujourd’hui pour réenchanter la ...
Etude PwC "Total Retail 2015" Sur quoi miser aujourd’hui pour réenchanter la ...Etude PwC "Total Retail 2015" Sur quoi miser aujourd’hui pour réenchanter la ...
Etude PwC "Total Retail 2015" Sur quoi miser aujourd’hui pour réenchanter la ...
 
GEMO 2016 : un digital de plus en plus cannibale ?
GEMO 2016  : un digital de plus en plus cannibale ?GEMO 2016  : un digital de plus en plus cannibale ?
GEMO 2016 : un digital de plus en plus cannibale ?
 
Infographie PwC GEMO 2016 sur l'industrie Médias et Loisirs (juin 2015)
Infographie PwC GEMO 2016 sur l'industrie Médias et Loisirs (juin 2015)Infographie PwC GEMO 2016 sur l'industrie Médias et Loisirs (juin 2015)
Infographie PwC GEMO 2016 sur l'industrie Médias et Loisirs (juin 2015)
 
Etude PwC Low Carbon Economy Index (oct. 2015)
Etude PwC Low Carbon Economy Index (oct. 2015)Etude PwC Low Carbon Economy Index (oct. 2015)
Etude PwC Low Carbon Economy Index (oct. 2015)
 
Etude FCD, ESSEC et PwC sur la distribution responsable (août 2015)
Etude FCD, ESSEC et PwC sur la distribution responsable (août 2015)Etude FCD, ESSEC et PwC sur la distribution responsable (août 2015)
Etude FCD, ESSEC et PwC sur la distribution responsable (août 2015)
 
Etude PwC IPO Watch
Etude PwC IPO WatchEtude PwC IPO Watch
Etude PwC IPO Watch
 
Etude PwC CEO Survey Talent "People Strategy for the Digital Age" (juillet 2015)
Etude PwC CEO Survey Talent "People Strategy for the Digital Age" (juillet 2015)Etude PwC CEO Survey Talent "People Strategy for the Digital Age" (juillet 2015)
Etude PwC CEO Survey Talent "People Strategy for the Digital Age" (juillet 2015)
 
Etude PwC Golden Age Index (juin 2015)
Etude PwC Golden Age Index (juin 2015)Etude PwC Golden Age Index (juin 2015)
Etude PwC Golden Age Index (juin 2015)
 
Etude PwC Global Economy Watch (juin 2015)
Etude PwC Global Economy Watch (juin 2015)Etude PwC Global Economy Watch (juin 2015)
Etude PwC Global Economy Watch (juin 2015)
 
Etude PwC et Essec "Grande consommation 1985 - 2015 - 2045"
Etude PwC et Essec "Grande consommation 1985 - 2015 - 2045"Etude PwC et Essec "Grande consommation 1985 - 2015 - 2045"
Etude PwC et Essec "Grande consommation 1985 - 2015 - 2045"
 
Etude PwC sur le Top 100 des entreprises les mieux valorisées au monde en 201...
Etude PwC sur le Top 100 des entreprises les mieux valorisées au monde en 201...Etude PwC sur le Top 100 des entreprises les mieux valorisées au monde en 201...
Etude PwC sur le Top 100 des entreprises les mieux valorisées au monde en 201...
 
Etude PwC "Point of View: Enterprise Portfolio & Program Management" (mai 2015)
Etude PwC "Point of View: Enterprise Portfolio & Program Management" (mai 2015)Etude PwC "Point of View: Enterprise Portfolio & Program Management" (mai 2015)
Etude PwC "Point of View: Enterprise Portfolio & Program Management" (mai 2015)
 
Etude PwC "Bridging the gap" sur les investisseurs institutionnels (mai 2015)
Etude PwC "Bridging the gap" sur les investisseurs institutionnels (mai 2015)Etude PwC "Bridging the gap" sur les investisseurs institutionnels (mai 2015)
Etude PwC "Bridging the gap" sur les investisseurs institutionnels (mai 2015)
 
Etude PwC, AFDEL et SNJV sur "Les 100 digital"
Etude PwC, AFDEL et SNJV sur "Les 100 digital"Etude PwC, AFDEL et SNJV sur "Les 100 digital"
Etude PwC, AFDEL et SNJV sur "Les 100 digital"
 
Etude PwC Global Economy Watch (mai 2015)
Etude PwC Global Economy Watch (mai 2015)Etude PwC Global Economy Watch (mai 2015)
Etude PwC Global Economy Watch (mai 2015)
 
Etude PwC sur l'économie collaborative (mai 2015)
Etude PwC sur l'économie collaborative (mai 2015)Etude PwC sur l'économie collaborative (mai 2015)
Etude PwC sur l'économie collaborative (mai 2015)
 
Etude PwC sur l'intérêt des investisseurs pour l’Afrique (avril 2015)
Etude PwC sur l'intérêt des investisseurs pour l’Afrique (avril 2015)Etude PwC sur l'intérêt des investisseurs pour l’Afrique (avril 2015)
Etude PwC sur l'intérêt des investisseurs pour l’Afrique (avril 2015)
 

Kürzlich hochgeladen

Independent Call Girls Andheri Nightlaila 9967584737
Independent Call Girls Andheri Nightlaila 9967584737Independent Call Girls Andheri Nightlaila 9967584737
Independent Call Girls Andheri Nightlaila 9967584737Riya Pathan
 
Call Girls In Radisson Blu Hotel New Delhi Paschim Vihar ❤️8860477959 Escorts...
Call Girls In Radisson Blu Hotel New Delhi Paschim Vihar ❤️8860477959 Escorts...Call Girls In Radisson Blu Hotel New Delhi Paschim Vihar ❤️8860477959 Escorts...
Call Girls In Radisson Blu Hotel New Delhi Paschim Vihar ❤️8860477959 Escorts...lizamodels9
 
Buy gmail accounts.pdf Buy Old Gmail Accounts
Buy gmail accounts.pdf Buy Old Gmail AccountsBuy gmail accounts.pdf Buy Old Gmail Accounts
Buy gmail accounts.pdf Buy Old Gmail AccountsBuy Verified Accounts
 
Market Sizes Sample Report - 2024 Edition
Market Sizes Sample Report - 2024 EditionMarket Sizes Sample Report - 2024 Edition
Market Sizes Sample Report - 2024 EditionMintel Group
 
Kenya Coconut Production Presentation by Dr. Lalith Perera
Kenya Coconut Production Presentation by Dr. Lalith PereraKenya Coconut Production Presentation by Dr. Lalith Perera
Kenya Coconut Production Presentation by Dr. Lalith Pereraictsugar
 
(Best) ENJOY Call Girls in Faridabad Ex | 8377087607
(Best) ENJOY Call Girls in Faridabad Ex | 8377087607(Best) ENJOY Call Girls in Faridabad Ex | 8377087607
(Best) ENJOY Call Girls in Faridabad Ex | 8377087607dollysharma2066
 
Lowrate Call Girls In Sector 18 Noida ❤️8860477959 Escorts 100% Genuine Servi...
Lowrate Call Girls In Sector 18 Noida ❤️8860477959 Escorts 100% Genuine Servi...Lowrate Call Girls In Sector 18 Noida ❤️8860477959 Escorts 100% Genuine Servi...
Lowrate Call Girls In Sector 18 Noida ❤️8860477959 Escorts 100% Genuine Servi...lizamodels9
 
8447779800, Low rate Call girls in New Ashok Nagar Delhi NCR
8447779800, Low rate Call girls in New Ashok Nagar Delhi NCR8447779800, Low rate Call girls in New Ashok Nagar Delhi NCR
8447779800, Low rate Call girls in New Ashok Nagar Delhi NCRashishs7044
 
Youth Involvement in an Innovative Coconut Value Chain by Mwalimu Menza
Youth Involvement in an Innovative Coconut Value Chain by Mwalimu MenzaYouth Involvement in an Innovative Coconut Value Chain by Mwalimu Menza
Youth Involvement in an Innovative Coconut Value Chain by Mwalimu Menzaictsugar
 
NewBase 19 April 2024 Energy News issue - 1717 by Khaled Al Awadi.pdf
NewBase  19 April  2024  Energy News issue - 1717 by Khaled Al Awadi.pdfNewBase  19 April  2024  Energy News issue - 1717 by Khaled Al Awadi.pdf
NewBase 19 April 2024 Energy News issue - 1717 by Khaled Al Awadi.pdfKhaled Al Awadi
 
8447779800, Low rate Call girls in Saket Delhi NCR
8447779800, Low rate Call girls in Saket Delhi NCR8447779800, Low rate Call girls in Saket Delhi NCR
8447779800, Low rate Call girls in Saket Delhi NCRashishs7044
 
Marketplace and Quality Assurance Presentation - Vincent Chirchir
Marketplace and Quality Assurance Presentation - Vincent ChirchirMarketplace and Quality Assurance Presentation - Vincent Chirchir
Marketplace and Quality Assurance Presentation - Vincent Chirchirictsugar
 
Contemporary Economic Issues Facing the Filipino Entrepreneur (1).pptx
Contemporary Economic Issues Facing the Filipino Entrepreneur (1).pptxContemporary Economic Issues Facing the Filipino Entrepreneur (1).pptx
Contemporary Economic Issues Facing the Filipino Entrepreneur (1).pptxMarkAnthonyAurellano
 
Call Girls Miyapur 7001305949 all area service COD available Any Time
Call Girls Miyapur 7001305949 all area service COD available Any TimeCall Girls Miyapur 7001305949 all area service COD available Any Time
Call Girls Miyapur 7001305949 all area service COD available Any Timedelhimodelshub1
 
Islamabad Escorts | Call 03070433345 | Escort Service in Islamabad
Islamabad Escorts | Call 03070433345 | Escort Service in IslamabadIslamabad Escorts | Call 03070433345 | Escort Service in Islamabad
Islamabad Escorts | Call 03070433345 | Escort Service in IslamabadAyesha Khan
 
2024 Numerator Consumer Study of Cannabis Usage
2024 Numerator Consumer Study of Cannabis Usage2024 Numerator Consumer Study of Cannabis Usage
2024 Numerator Consumer Study of Cannabis UsageNeil Kimberley
 
8447779800, Low rate Call girls in Uttam Nagar Delhi NCR
8447779800, Low rate Call girls in Uttam Nagar Delhi NCR8447779800, Low rate Call girls in Uttam Nagar Delhi NCR
8447779800, Low rate Call girls in Uttam Nagar Delhi NCRashishs7044
 
Future Of Sample Report 2024 | Redacted Version
Future Of Sample Report 2024 | Redacted VersionFuture Of Sample Report 2024 | Redacted Version
Future Of Sample Report 2024 | Redacted VersionMintel Group
 
Investment in The Coconut Industry by Nancy Cheruiyot
Investment in The Coconut Industry by Nancy CheruiyotInvestment in The Coconut Industry by Nancy Cheruiyot
Investment in The Coconut Industry by Nancy Cheruiyotictsugar
 

Kürzlich hochgeladen (20)

Independent Call Girls Andheri Nightlaila 9967584737
Independent Call Girls Andheri Nightlaila 9967584737Independent Call Girls Andheri Nightlaila 9967584737
Independent Call Girls Andheri Nightlaila 9967584737
 
Call Girls In Radisson Blu Hotel New Delhi Paschim Vihar ❤️8860477959 Escorts...
Call Girls In Radisson Blu Hotel New Delhi Paschim Vihar ❤️8860477959 Escorts...Call Girls In Radisson Blu Hotel New Delhi Paschim Vihar ❤️8860477959 Escorts...
Call Girls In Radisson Blu Hotel New Delhi Paschim Vihar ❤️8860477959 Escorts...
 
Buy gmail accounts.pdf Buy Old Gmail Accounts
Buy gmail accounts.pdf Buy Old Gmail AccountsBuy gmail accounts.pdf Buy Old Gmail Accounts
Buy gmail accounts.pdf Buy Old Gmail Accounts
 
Market Sizes Sample Report - 2024 Edition
Market Sizes Sample Report - 2024 EditionMarket Sizes Sample Report - 2024 Edition
Market Sizes Sample Report - 2024 Edition
 
Corporate Profile 47Billion Information Technology
Corporate Profile 47Billion Information TechnologyCorporate Profile 47Billion Information Technology
Corporate Profile 47Billion Information Technology
 
Kenya Coconut Production Presentation by Dr. Lalith Perera
Kenya Coconut Production Presentation by Dr. Lalith PereraKenya Coconut Production Presentation by Dr. Lalith Perera
Kenya Coconut Production Presentation by Dr. Lalith Perera
 
(Best) ENJOY Call Girls in Faridabad Ex | 8377087607
(Best) ENJOY Call Girls in Faridabad Ex | 8377087607(Best) ENJOY Call Girls in Faridabad Ex | 8377087607
(Best) ENJOY Call Girls in Faridabad Ex | 8377087607
 
Lowrate Call Girls In Sector 18 Noida ❤️8860477959 Escorts 100% Genuine Servi...
Lowrate Call Girls In Sector 18 Noida ❤️8860477959 Escorts 100% Genuine Servi...Lowrate Call Girls In Sector 18 Noida ❤️8860477959 Escorts 100% Genuine Servi...
Lowrate Call Girls In Sector 18 Noida ❤️8860477959 Escorts 100% Genuine Servi...
 
8447779800, Low rate Call girls in New Ashok Nagar Delhi NCR
8447779800, Low rate Call girls in New Ashok Nagar Delhi NCR8447779800, Low rate Call girls in New Ashok Nagar Delhi NCR
8447779800, Low rate Call girls in New Ashok Nagar Delhi NCR
 
Youth Involvement in an Innovative Coconut Value Chain by Mwalimu Menza
Youth Involvement in an Innovative Coconut Value Chain by Mwalimu MenzaYouth Involvement in an Innovative Coconut Value Chain by Mwalimu Menza
Youth Involvement in an Innovative Coconut Value Chain by Mwalimu Menza
 
NewBase 19 April 2024 Energy News issue - 1717 by Khaled Al Awadi.pdf
NewBase  19 April  2024  Energy News issue - 1717 by Khaled Al Awadi.pdfNewBase  19 April  2024  Energy News issue - 1717 by Khaled Al Awadi.pdf
NewBase 19 April 2024 Energy News issue - 1717 by Khaled Al Awadi.pdf
 
8447779800, Low rate Call girls in Saket Delhi NCR
8447779800, Low rate Call girls in Saket Delhi NCR8447779800, Low rate Call girls in Saket Delhi NCR
8447779800, Low rate Call girls in Saket Delhi NCR
 
Marketplace and Quality Assurance Presentation - Vincent Chirchir
Marketplace and Quality Assurance Presentation - Vincent ChirchirMarketplace and Quality Assurance Presentation - Vincent Chirchir
Marketplace and Quality Assurance Presentation - Vincent Chirchir
 
Contemporary Economic Issues Facing the Filipino Entrepreneur (1).pptx
Contemporary Economic Issues Facing the Filipino Entrepreneur (1).pptxContemporary Economic Issues Facing the Filipino Entrepreneur (1).pptx
Contemporary Economic Issues Facing the Filipino Entrepreneur (1).pptx
 
Call Girls Miyapur 7001305949 all area service COD available Any Time
Call Girls Miyapur 7001305949 all area service COD available Any TimeCall Girls Miyapur 7001305949 all area service COD available Any Time
Call Girls Miyapur 7001305949 all area service COD available Any Time
 
Islamabad Escorts | Call 03070433345 | Escort Service in Islamabad
Islamabad Escorts | Call 03070433345 | Escort Service in IslamabadIslamabad Escorts | Call 03070433345 | Escort Service in Islamabad
Islamabad Escorts | Call 03070433345 | Escort Service in Islamabad
 
2024 Numerator Consumer Study of Cannabis Usage
2024 Numerator Consumer Study of Cannabis Usage2024 Numerator Consumer Study of Cannabis Usage
2024 Numerator Consumer Study of Cannabis Usage
 
8447779800, Low rate Call girls in Uttam Nagar Delhi NCR
8447779800, Low rate Call girls in Uttam Nagar Delhi NCR8447779800, Low rate Call girls in Uttam Nagar Delhi NCR
8447779800, Low rate Call girls in Uttam Nagar Delhi NCR
 
Future Of Sample Report 2024 | Redacted Version
Future Of Sample Report 2024 | Redacted VersionFuture Of Sample Report 2024 | Redacted Version
Future Of Sample Report 2024 | Redacted Version
 
Investment in The Coconut Industry by Nancy Cheruiyot
Investment in The Coconut Industry by Nancy CheruiyotInvestment in The Coconut Industry by Nancy Cheruiyot
Investment in The Coconut Industry by Nancy Cheruiyot
 

Etude PwC Autofacts production automobile (fév. 2014)

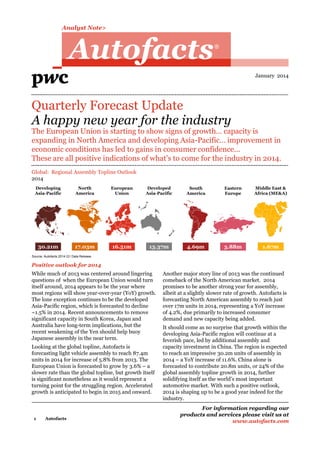
  • 1. Analyst Note> Autofacts R January 2014 Quarterly Forecast Update A happy new year for the industry The European Union is starting to show signs of growth… capacity is expanding in North America and developing Asia-Pacific… improvement in economic conditions has led to gains in consumer confidence... These are all positive indications of what’s to come for the industry in 2014. Global: Regional Assembly Topline Outlook 2014 Developing Asia-Pacific North America European Union Developed Asia-Pacific South America Eastern Europe Middle East & Africa (ME&A) 30.21m 17.03m 16.51m 13.37m 4.69m 3.88m 1.67m Source: Autofacts 2014 Q1 Data Release Positive outlook for 2014 While much of 2013 was centered around lingering questions of when the European Union would turn itself around, 2014 appears to be the year where most regions will show year-over-year (YoY) growth. The lone exception continues to be the developed Asia-Pacific region, which is forecasted to decline ~1.5% in 2014. Recent announcements to remove significant capacity in South Korea, Japan and Australia have long-term implications, but the recent weakening of the Yen should help buoy Japanese assembly in the near term. Looking at the global topline, Autofacts is forecasting light vehicle assembly to reach 87.4m units in 2014 for increase of 5.8% from 2013. The European Union is forecasted to grow by 3.6% – a slower rate than the global topline, but growth itself is significant nonetheless as it would represent a turning point for the struggling region. Accelerated growth is anticipated to begin in 2015 and onward. 1 Autofacts Another major story line of 2013 was the continued comeback of the North American market. 2014 promises to be another strong year for assembly, albeit at a slightly slower rate of growth. Autofacts is forecasting North American assembly to reach just over 17m units in 2014, representing a YoY increase of 4.2%, due primarily to increased consumer demand and new capacity being added. It should come as no surprise that growth within the developing Asia-Pacific region will continue at a feverish pace, led by additional assembly and capacity investment in China. The region is expected to reach an impressive 30.2m units of assembly in 2014 – a YoY increase of 11.6%. China alone is forecasted to contribute 20.8m units, or 24% of the global assembly topline growth in 2014, further solidifying itself as the world’s most important automotive market. With such a positive outlook, 2014 is shaping up to be a good year indeed for the industry. For information regarding our products and services please visit us at www.autofacts.com
  • 2. Analyst Note Plus Developing Asia-Pacific China and India India Sales 2013 Key Statistics (YTD through November) % Change (YoY) China light vehicle sales +14.2% China light vehicle assembly +13.5% India light vehicle sales -7.6% India light vehicle assembly -3.7% China Sales The Chinese market continued to grow at a robust pace, even amidst the economic uncertainty experienced in pockets globally. After scant growth in 2011 (1.3%) and healthy increase in 2012 (6.5%), China was expected to enter into a more moderate phase of growth. 2013 surpassed these tempered expectations with 14.2% growth through November 2013. The annual growth number is expected to climb past 15%, as December sales are generally strong for the market. This robust growth is a result of several positive factors, including the return of Japanese brands after the territorial dispute in the second half of 2012. The top three Japanese brands saw healthy sales gains for domestically-produced vehicles, with Honda, Nissan, and Toyota growing 20.5%, 18.0% and 9.2% respectively. The growing working class has also translated into more firsttime buyers and upgrade buyers into showrooms. As the Chinese market matures, so too will consumer preferences. To keep up with heightened expectations, OEMs have continued to launch new models in the market, even globally debuting select models in China. This diversification of offerings, as well as real estate purchase limitations in select cities, is driving more buyers to invest in more expensive new vehicles going forward. China Assembly Light vehicle assembly volume is expected to grow 12.1% to reach 18.7m units in 2013. For 2014, Autofacts is forecasting growth of 11.3%, reaching 20.8m units. Much of this expected increase will be supported by the increase in domestic demand. SUVs and MPVs are the two fastest growing segments due to the shifting lifestyles of the average Chinese buyer. Correspondingly, we anticipate that production of these vehicles will grow at a quicker rate through the forecast window. 2 Autofacts For the first time in 11 years, India’s new vehicle sales saw a decline in volume in 2013, despite attempts to jumpstart the market with all-new models, early product refreshes, and generous incentives. Passenger vehicle sales fell again in the month of December, consistent with the weak performance on the whole in 2013. Part of the decline was due, at least in part, to a 3% rise in excise duties on utility vehicles, which had a negative impact on the otherwise popular SUV segment. High financing rates, rising fuel prices, price hikes due to the devalued Rupee, and an increased overall cost of ownership are also existing, discouraging factors for potential buyers. Light commercial vehicles (LCVs) saw a similar fate, suffering from a lack of industrial mining activity and stalled infrastructure projects, falling by 15.6% for the full year. In the near term, an immediate turnaround in the Indian auto industry is not expected without policy corrections and stimulus programs aimed to revive the struggling market. National elections are expected in May 2014 and a change in the political environment could boost business and consumer sentiment, provided stability will come with the new government. Key political issues that could impact the future of the industry include infrastructure development, reconsideration of their tariff structure, and recalibration of central bank rates. India Assembly To keep pace with slowing demand and bridge the gap between sales and output, many leading OEMs scaled back production, and block closures (akin to line closures) have become a regular occurrence. Over the past nine months, there have been over a dozen block closures across factories, along with 75 to 80 no-production days to avoid significant inventory accumulation, according to industry estimates. This has led to a decline in inventory and a corresponding jump in excess capacity to record highs. Manufacturers are staying afloat with production cuts and re-thinking future investment plans, but the short-term outlook remains tenuous at best. Given the current and short term conditions in the market, the market is expected to remain beleaguered until the latter half of 2014, when a recovery can begin to take shape. As such, we For information regarding our products and services please visit us at www.autofacts.com
  • 3. Analyst Note Plus forecast a market recovery beginning in the second half of 2014 for a slight growth of 3.5% in assembly for 2014. EU+EFTA % Change (YoY) EU+EFTA new car registrations North America 2013 Key Statistics -1.8% EU+EFTA LCV registrations -1.6% EU regional assembly +0.2% 2013 Key Statistics % Change (YoY) US light vehicle sales +7.5% Sales Canada light vehicle sales +4.0% Mexico light vehicle sales (through Nov) +7.7% Regional assembly +6.0% Against the odds, 2013 turned out to be a better year than expected for the European Union. Registrations began to show signs of growth early on in the second half of the year, but it was the pace of recovery that was impressive, growing at a rate of 2.7% in Q3 and ~5.7% in Q4. Overall, EU+EFTA new car registrations for the full year fell to 12.3 units. Though some markets are still struggling – most notably France and Italy – the region seems to be on the road to a recovery after six consecutive years of market deterioration. Sales of light commercial vehicles (LCVs) also turned out better than originally feared with an estimated -1.6% decline to 1.42m units. The lower rate of decline helped the market narrowly avoid falling below the previous low point experienced in 2009. Sales The North American markets all saw strong results in 2013, with light vehicles sales reaching 15.5m units. 2013 marked the US’s fourth straight year of recording increases in sales of over 1m units. While Autofacts anticipates a continuation of the positive sales growth for 2014, it is expected to be at a slower pace, reaching 16.2m units. Canadian sales also enjoyed a banner year, reaching a new record high as it surpassed the 1.7m units benchmark for 1.74m units. This positive trend is expected to continue into 2014 for yet another record year at 1.76m in sales. Mexico returned to over 1m units of sales after four years below this mark, reaching 1.1m units of sales for new light vehicles. As with Canada, Mexican sales are expected to continue further in 2014 by an additional 50k units and inching towards the historical high for the region. Assembly Overall, North American assembly cleared 16m units in 2013 for the first time since 2002, buoyed by impressive growth in both the US and Mexico. The US had the largest assembly gains both on a raw volume and percentage volume YoY for 2013, but Mexico will take the lead, percentage wise, in the mid to long term range. Meanwhile, Canadian assembly saw a YoY decline and is forecasted to decline further throughout the forecast window. For 2014, Autofacts forecasts the region to top 17M units in 2014 and being to challenge the historical high assembly set in 2000. 3 Autofacts Despite the relatively positive developments in the second half of the year, EU+EFTA markets still face a host of challenges and uncertainty. Continuing fiscal woes remain for a number of markets while unemployment is still rising, expected to peak in early 2014. These lingering concerns keep the forecasted growth for 2014 at a lower rate of just over 3% for the full year for 12.7m units. As conditions stabilize, we expect the pace to accelerate in 2015 to 5.5% YoY growth. These projections are similar for the LCV market with growth of 3.4% and 7.3% for 2014 and 2015, respectively. Looking ahead into the mid- to long-term range, there are several areas that provide upside potential, which is best illustrated by the strong recovery now being seen in some of the markets that were hardest hit during the financial crisis and recession. Portugal has now seen seven consecutive months of growth for a 10.9% increase for the full year. Hungary grew by 14.6% and Greece by 8.7% in the second half, albeit from exceptional lows. Additionally, pent-up demand is increasing after years of weak consumer sentiment. Once businesses and consumers are more confident that For information regarding our products and services please visit us at www.autofacts.com
  • 4. Analyst Note Plus unemployment concerns are subsiding and economic indicators continue improving, this pentup demand could drive a stronger, sustained recovery for the market as whole. Assembly Assembly in 2013 was flat compared to 2012, owing to a strong showing in the final months from a number of countries, including Germany in particular. This outperformance was supported by both the improving demand situation and the increase in exports to major markets of the US, China and Turkey. Going forward, light vehicle assembly should be more closely aligned with regional EU+EFTA demand, increasing to 16.5m units in 2014 and 17.4m units by 2015. This represents a growth rate of 3.6% and 5.6% for the next two years. Recent announcements of assembly localization should increase both volume and plant utilisation even as exports stabilise. Developed Asia-Pacific Australia, Japan and South Korea 2013 Key Statistics % Change (YoY) Australia light vehicle sales +2.2% Japan light vehicle sales +0.1% South Korea light vehicle sales -2.7% Regional assembly -2.8% though the second half of the year brought signs of economic recovery and hope that a market revival may be underway. Positive economic indicators and a slew of attractive mini vehicles have helped keep the market from slippage. Mini vehicles have surged in recent years with lower cost of ownership and lower taxes. In 2013 alone, the segment grew by 7% and now makes up nearly 40% of the total market. Though select taxes will increase on minis in 2015, they should remain popular as new bodystyle variants are given the mini treatment. Looking ahead, sales volumes are expected to take a hit with a hike in the national sales tax rate from 5% to 8%, effective April 2014. In the mid- to long-term range, the market is expected to continue shrinking with an aging and urbanized population. Though economic conditions and consumer sentiment may improve with the 2020 Tokyo Summer Olympics on the horizon, but whether this will have any marked impact on the automotive industry is yet to be seen. Light vehicle assembly volumes in Japan in 2013 remained above 9m units in spite of the slight decline in export volumes due to aging of major export models and continuing assembly transfers. As automakers continue shifting production to overseas markets, particularly to North America, a decline in assembly volumes in Japan is expected for 2014 and beyond. Additional programs are expected to be transferred in the mid- to long-term range, prompting Japanese OEMs to reduce capacity and reconsider their global footprint. Further reduction in capacity will be needed if current utilisation rates of ~90% are to be maintained. Australia South Korea In 2013, light vehicle sales are up 2.2% from 2012 to reach 1.1 mfor a new record in Australia. Popularity of small cars and SUVs, especially small SUVs, continued to drive sales, with a combined market share of 53% in 2013. Meanwhile, mid-to large size sedans, particularly domestically built models, have struggled to regain the volumes since the emergence of more popular sectors. This is a contributing factor to the exit of major manufacturing operations in the market, and further reduction of automotive assembly is expected in the mid- to long-term range. OEMs are expected to increase import volumes by leveraging existing assembly capacity elsewhere and making Australia an export-based market. The South Korean automotive market has been fairly stagnant for the last four years, hovering around the 1.3m unit mark. While sales of domestic brands have seen gradual decline, import sales volume has nearly doubled between 2010 and 2013 to 200k units as global OEMs capitalize on free trade agreements. Looking forward, the South Korean market will be limited by the same demographic issues facing Japan with an aging, increasingly urbanized population. As such, the mid- to long-term projections for the market will remain relatively flat. Japan Light vehicle sales in Japan were relatively flat YoY, 4 Autofacts Assembly volumes in South Korea decreased slightly YoY due to the decline of the domestic demand along with lower demand for South Korean brands in major overseas markets. Frequent strikes For information regarding our products and services please visit us at www.autofacts.com
  • 5. Analyst Note Plus and steadily climbing costs of labour has also taken a toll, leaving the short-term assembly expectations flat at ~4.5m units for the remainder of the forecast window. South America 2013 Key Statistics (YTD through November) % Change (YoY) Brazil light vehicle registrations +7.5% Argentina light vehicle sales +4.0% Venezuela light vehicle registrations +7.7% Regional assembly +6.0% Sales After a decade of rapid expansion and growth, new vehicle registrations fell by- 0.9% in 2013 in Brazil. As with other market contractions, a myriad of factors had a compounding impact on consumer spending and thus, demand within South America’s largest automotive market. A stagnant macroeconomic environment, high interest rates, increased transaction prices, and social unrest have all served to restrain consumer spending, particularly on big ticket purchases. Perhaps more concerning was that the IPI tax holiday officially expired in December, which should have pulled ahead sales. Instead, demand remained weak. Going into the new year, IPI increases will be phased in with an increase of 3% instead of the 7% hike as previously expected. The tax increase will likely serve to restrict sales even more in the coming year. With this in mind, sales in Brazil is expected to stay relatively flat YoY with just under 1% growth. While new registrations struggled in Brazil, Argentina saw an impressive YoY increase in sales, thanks to the continued currency volatility with the Argentinean Pesos. As inflation soars past 26% and the peso reaches record lows near 11.6 pesos against the dollar, consumers increasingly seek dollars via the black market exchange, wherein those with dollars can exchange for pesos then invest in new vehicles. The used car market is also seeing a sales surge as vehicles are seen as safe investments against valuation losses. Barring wholesale overhaul of monetary policies, sales and registration of new vehicles is expected to continue growing, albeit at a slower pace of 8% in 2014. 5 Autofacts Venezuela is still searching for direction in the wakeof Hugo Chavez’s death, even with his handpicked successor, Nicolas Maduro, elected into office in in December 2013. Monetary, fiscal and other macroeconomic woes have plagued the country, causing a logistical headache for companies needing to import and export goods, particularly in the manufacturing industry. With such pervasive instability, it’s no surprise that vehicle sales have dropped, but the nearly 22% dip is still cause for alarm. With Maduro now elected into power, the hope is that wide-reaching policies can be enacted and bring much needed stability to the volatile nation. Thus, sales in 2014 are expected to improve on 2013’s poor performance with a 6% YoY increase, but much investment and change is needed if the market is to return to the highs reached in the mid2007. Assembly Though the political, social, and economic volatility across the region’s major markets are cause for short term concern, the South American assembly is still expected to grow significantly in the long term. With marquee events like the World Cup in 2014 and the Summer Olympics in 2016 will require critical investments in infrastructure, which should improve Brazil's overall economic environment and spread to other regional markets. Overall, regional assembly output is expected to grow by just over 3% for 2014, but pick up in 2015 as recently announced capacity investments come online and regional assembly will surpass the 5m unit mark. Eastern Europe 2013 Key Statistics % Change (YoY) Russia light vehicle sales -5.4% Turkey light vehicle sales +9.7% Regional assembly +2.8 % Sales New vehicle sales and registrations within the Eastern European markets have varied by country. As Russia continued to slide, Turkey and other Commonwealth of Independent States (CIS) countries enjoyed strong sales results for 2013. For information regarding our products and services please visit us at www.autofacts.com
  • 6. Analyst Note Plus State-subsidized auto finance programs have reached the Ministry’s targeted goal of reaching over 250k in sales up to December, but registrations remained on the downtrend for the full year in Russia, suggesting that the decelerating market is more than a momentary setback. In the short term, new vehicle sales in Russia will be hindered by slow economic development, which will translate into consumer uncertainty and hesitation. With these ongoing concerns, Russia’s market is expected to grow by a mere 1% to reach just under 2.8m units for 2014. Meanwhile, Turkey is enjoying a growth of 9.7% for the full year in 2013. This growth is expected to continue into 2014 with a 5.6% jump in sales. Assembly Though the Russian sales market remains weak, light vehicle assembly is expected to show growth, reaching 2.2m units in 2014 thanks to ongoing localization and increasing exports to neighboring countries. More production growth is expected in 2015 and beyond, with investments by global OEMs to shift towards a domestic production base. Assembly growth in Turkey has mirrored the performance of sales, and this is expected to continue into 2014 with an anticipated 9.5% growth in assembly and continued expansion throughout the forecast window. By 2020, assembly in Turkey is forecasted to surpass 1.5m units. Other developing CIS markets like Kazakhstan and Uzbekistan will see growth as well, attracting capacity investments from OEMs looking to captilise on the region’s growth potential. Download the Autofacts App Now available in Canada, China and Germany, with additional markets coming soon. © 2014 PwC. All rights reserved. PwC refers to the PwC network and/or one or more of its member firms, each of which is a separate legal entity. Please see www.pwc.com/structure for further details. This content is for general information purposes only, and should not be used as a substitute for consultation with professional advisors.PwC helps organisations and individuals create the value they’re looking for. We’re a network of firms in 157 countries with more than 184,000 people who are committed to delivering quality in assurance, tax and advisory services. Tell us what matters to you and find out more by visiting us at www.pwc.com 6 Autofacts For information regarding our products and services please visit us at www.autofacts.com
  • 7. Analyst Note Plus Baseline assembly forecast data - Global Growth analytics (2013-2018) Region1 2013 2014 2015 2016 2017 2018 Unit diff. % chg CAGR CTG % Rank2 1 Asia-Pacific - developing 27,077,994 30,205,355 33,736,262 36,868,165 38,979,556 40,291,354 13,213,360 48.8% 8.3% 61.2% 1 2 North America 16,341,199 17,032,595 17,612,413 17,926,427 18,626,929 18,494,039 2,152,840 13.2% 2.5% 10.0% 3 3 European Union 4 Asia-Pacific - developed 15,940,178 13,578,144 16,513,312 13,369,811 17,441,548 13,228,712 18,407,004 13,126,617 18,760,059 12,989,046 18,952,558 12,883,390 3,012,380 -694,754 18.9% -5.1% 3.5% -1.0% 14.0% -3.2% 2 7 4 5 South America 4,548,811 4,692,944 5,132,969 5,591,971 5,892,819 6,164,990 1,616,179 35.5% 6.3% 7.5% 6 East Europe 3,565,239 3,876,775 4,247,440 4,548,802 4,842,046 5,004,242 1,439,003 40.4% 7.0% 6.7% 5 7 Middle East & Africa 1,492,677 1,670,522 1,895,569 2,006,990 2,153,683 2,339,221 846,544 56.7% 9.4% 3.9% 6 100.0% Global total assembly 82,544,242 87,361,314 93,294,913 98,475,976 102,244,138 104,129,794 21,585,552 26.2% 4.8% Global total capacity 106,975,130 114,772,195 122,162,357 126,922,877 127,461,782 129,027,217 22,052,087 20.6% 3.8% 24,430,888 27,410,881 28,867,444 28,446,901 25,217,644 24,897,423 466,535 1.9% 0.4% 77.2% 76.1% 76.4% 77.6% 80.2% 80.7% Global excess capacity Global utilisation (%) 2013 2014 2015 2016 2017 2018 Unit diff. % chg CAGR 1 China Country 18,716,752 20,837,996 23,430,871 25,475,949 26,854,181 27,630,674 8,913,922 47.6% 8.1% CTG % Rank 41.3% 1 2 USA 11,019,796 11,748,055 12,230,029 12,529,623 13,049,780 12,913,982 1,894,186 17.2% 3.2% 8.8% 3 3 Japan 9,024,925 8,746,184 8,557,159 8,552,743 8,500,892 8,405,395 -619,530 -6.9% -1.4% -2.9% 52 4 Germany 5,673,325 5,747,464 5,919,504 6,008,901 6,130,927 6,201,093 527,768 9.3% 1.8% 2.4% 11 5 India 3,475,715 3,597,242 4,097,666 4,788,355 5,300,151 5,711,072 2,235,357 64.3% 10.4% 10.4% 2 6 South Korea 4,320,546 4,360,036 4,424,477 4,399,748 4,465,724 4,477,995 157,449 3.6% 0.7% 0.7% 20 7 Brazil 3,427,687 3,569,612 3,916,928 4,309,136 4,513,674 4,716,141 1,288,454 37.6% 6.6% 6.0% 4 8 Mexico 2,940,650 3,047,803 3,162,312 3,262,379 3,446,951 3,508,993 568,343 19.3% 3.6% 2.6% 9 9 Thailand 2,555,358 2,878,105 3,168,221 3,414,505 3,554,244 3,608,757 1,053,399 41.2% 7.1% 4.9% 5 10 Spain 2,132,684 2,258,371 2,557,919 2,811,138 2,841,754 2,802,837 670,153 31.4% 5.6% 3.1% 7 11 Russia 2,022,088 2,164,121 2,337,104 2,588,654 2,787,939 2,912,150 890,062 44.0% 7.6% 4.1% 6 12 Canada 2,380,753 2,236,737 2,220,072 2,134,425 2,130,198 2,071,064 -309,689 -13.0% -2.7% -1.4% 51 13 France 1,813,972 1,926,519 1,939,867 2,225,799 2,406,814 2,428,145 614,173 33.9% 6.0% 2.8% 8 14 United Kingdom 1,619,257 1,613,232 1,672,939 1,693,394 1,746,827 1,888,041 268,784 16.6% 3.1% 1.2% 16 15 Indonesia 1,121,623 1,427,943 1,491,521 1,570,782 1,605,916 1,641,120 519,497 46.3% 7.9% 2.4% 12 16 Turkey 1,067,072 1,167,974 1,307,760 1,359,796 1,438,727 1,463,382 396,310 37.1% 6.5% 1.8% 13 17 Czech Republic 1,042,113 1,132,382 1,180,287 1,186,859 1,195,817 1,211,257 169,144 16.2% 3.1% 0.8% 19 713,040 789,517 947,329 1,007,411 1,111,536 1,253,614 540,574 75.8% 11.9% 2.5% 10 18 Iran 20 Argentina 813,260 783,833 852,208 902,601 971,816 1,021,037 207,777 25.5% 4.7% 1.0% 17 20 Slovakia 822,037 831,563 797,388 864,482 816,672 795,496 -26,541 -3.2% -0.7% -0.1% 45 21 Malaysia 590,410 769,570 825,794 861,020 893,593 916,362 325,952 55.2% 9.2% 1.5% 14 22 Italy 571,866 611,551 845,632 909,035 900,106 866,149 294,283 51.5% 8.7% 1.4% 15 23 Poland 586,495 548,818 596,660 716,264 746,987 735,566 149,071 25.4% 4.6% 0.7% 22 24 South Africa 536,861 559,144 591,471 605,511 622,594 645,660 108,799 20.3% 3.8% 0.5% 24 25 Hungary 298,065 453,905 487,144 446,645 420,646 489,829 191,764 64.3% 10.4% 0.9% 18 26 Romania 394,954 372,907 354,981 348,323 347,065 362,884 -32,070 -8.1% -1.7% -0.1% 46 27 Taiwan 326,396 369,340 360,810 370,911 370,254 369,817 43,421 13.3% 2.5% 0.2% 33 28 Belgium 446,079 414,589 299,944 307,849 318,574 345,753 -100,326 -22.5% -5.0% -0.5% 49 29 Uzbekistan 269,385 265,026 286,384 286,704 277,087 275,112 5,727 2.1% 0.4% 0.0% 42 30 Morocco 156,013 230,199 240,899 249,353 247,810 245,332 89,319 57.3% 9.5% 0.4% 26 31 Sweden 141,248 140,889 220,177 252,191 256,640 257,783 116,535 82.5% 12.8% 0.5% 23 32 Colombia 151,126 174,995 184,907 188,232 197,079 204,471 53,345 35.3% 6.2% 0.2% 31 33 Pakistan 145,507 162,790 175,551 176,215 181,456 187,252 41,745 28.7% 5.2% 0.2% 34 34 Australia 232,673 263,591 247,076 174,126 22,430 0 -232,673 -100.0% -100.0% -1.1% 50 35 Portugal 145,530 134,382 150,889 155,419 151,052 173,639 28,109 19.3% 3.6% 0.1% 37 81,695,261 86,336,385 92,079,880 97,134,478 100,823,913 102,737,854 21,042,593 25.8% 4.7% 97.5% 99.0% 98.8% 98.7% 98.7% 97.5% Top 35 total assembly Top 35 (% of global total) 98.6% 98.6% 1Developed Asia-Pacific includes Australia, Japan, South Korea | Developing Asia-Pacific includes China, India, Indonesia, Malaysia, Pakistan, Philippines, Taiwan, Thailand, Vietnam 2Rankings based on contribution to total global growth (CTG%). Source: Autofacts Global Light Vehicle Assembly Outlook 2014 Q1 Data Release (Updated January 01 2014) 7 Autofacts January 2014 For more information please visit us at www.autofacts.com