Helen Osborne - Multiplying strategies for communicating numbers
•
1 gefällt mir•9,691 views

Presented by Helen Osborne, MEd, OTR/L, on September 26, 2013 at the fourth annual Center for Health Literacy Conference: Plain Talk in Complex Times.

Empfohlen
Empfohlen
Weitere ähnliche Inhalte
Ähnlich wie Helen Osborne - Multiplying strategies for communicating numbers
Ähnlich wie Helen Osborne - Multiplying strategies for communicating numbers (14)
Mehr von Plain Talk 2015
Mehr von Plain Talk 2015 (20)
Kürzlich hochgeladen
Kürzlich hochgeladen (20)
Helen Osborne - Multiplying strategies for communicating numbers
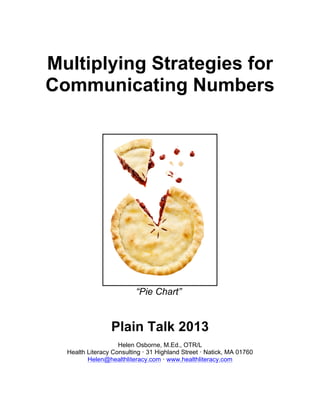
- 1. Multiplying Strategies for Communicating Numbers “Pie Chart” Plain Talk 2013 Helen Osborne, M.Ed., OTR/L Health Literacy Consulting · 31 Highland Street · Natick, MA 01760 Helen@healthliteracy.com · www.healthliteracy.com
- 2. 2 Multiplying Strategies for Communicating Numbers Plain Talk 2013. Presented by Helen Osborne, M.Ed., OTR/L Numeracy + Health = Health Numeracy There are multiple definitions for the terms “numeracy” and “health numeracy.” To me, the article that best brings these concepts together is: Golbeck AL, Ahlers-Schmidt CR, Paschal AM, and Dismuke SE, “A Definition and Operational Framework for Health Numeracy,” American Journal of Preventative Medicine 2005; 29(4):375-376. This article defines health numeracy as “the degree to which individuals have the capacity to access, process, interpret, communicate, and act on numerical, quantitative, graphical, biostatistics, and probabilistic health information needed to make effective health decisions.” The authors look at four categories of numeracy skills that the general public needs to function in today’s healthcare system. Summarized from the article, these categories are: • Basic. Skills to identify numbers and make sense of quantitative data that require no numeric manipulation. Examples include counting pills as prescribed, using a phone book to find clinic information, and knowing the time and date of appointments. • Computational. Ability to count, quantify, compute, and use simple manipulation of numbers, quantities, items, or visual elements in a health context. An example is determining net carbohydrates from a nutrition label. • Analytical. Involves higher-level concepts such as inference, estimation, proportion, percentage, and frequency. It may require pulling information from multiple sources and formats. Examples include determining whether cholesterol numbers are within normal range, understanding basic graphs, and comparing insurance benefits. • Statistical. Involves understanding basic biostatistics to critically analyze quantitative health information such as life expectancy and risk. Or statistical concepts such as randomization and “blind” studies.
- 3. 3 Multiplying Strategies for Communicating Numbers Plain Talk 2013. Presented by Helen Osborne, M.Ed., OTR/L Numeracy Tasks & Overall Strategies What numeracy tasks do we expect that others can, and will, correctly do? Mrs. Jones is on a modified diet and must restrict her intake of both sweet and salted foods. She takes six different medications, each with its own dosing schedule. She needs to monitor and record how she feels each day and notify her care providers when there are significant changes in her health. She also needs to make and keep numerous outpatient appointments and prepare for an ongoing battery of medical tests. ________________________________________________________________________ ________________________________________________________________________ ________________________________________________________________________ ________________________________________________________________________ ________________________________________________________________________ ________________________________________________________________________ ________________________________________________________________________ ________________________________________________________________________ ________________________________________________________________________ *** Overall strategies to improve understanding: • Know your purpose (problem-solving cycle) • Know your audience (professionals, public) • Know the science (study design) • Know the numbers (study data) • Know it works (teach-back, feedback) ________________________________________________________________________ ________________________________________________________________________ ________________________________________________________________________ ______________________________________________________________________ ________________________________________________________________________ ________________________________________________________________________ ________________________________________________________________________ ________________________________________________________________________ ________________________________________________________________________
- 4. 4 Multiplying Strategies for Communicating Numbers Plain Talk 2013. Presented by Helen Osborne, M.Ed., OTR/L Strategies to Convey: Quantity & Calculations In person: • Compare teaspoon, tablespoon, soupspoon, and baby spoon. • Confirm measurement system to use, such as ounces or grams. • Compare size/weight to objects such as beads or bags of flour. • Show actual items (4 ounces of chicken) or life-like replicas (1 pound of fat). • Use a divided plate to show proportion. • Use familiar analogies such as “4 ounces of meat, about the size as a deck of cards” or “5 pounds, like a bag of flour.” • Use pictures and numbers, such as the Wong-Baker FACES Pain Rating Scale from 1 (“no pain”) to 10 (“worst pain ever”). • Calculate numbers together, as adding total grams of fat from a food label. In print: • Show pictures. To show the amount of sugar in certain foods and drinks, you might compare the number of teaspoons of sugar in fruit, cereal, and soda. • Present nutrition information in terms of calories and activity level. • Compare similar units, such as cost per month or per year. • Provide spaces/lines to add numbers, such as 100.2 + 100. • Be cautious with words that convey quantitative concepts such as “reduce” and “chance of.” • Be wary of words with multiple meanings such as “and” that can mean “also” or “to add.” • List numbers in logical order, often this is higher (better) to lower (worse). • When possible, round decimals to the nearest whole number. • Add necessary 0, such as 0.2 (rather than .2). • Do not assume that readers know mathematic symbols such as “>” (greater than) or “<” (less than). With technology & devices, such as: • Online calculators, to determine recipe amounts. • Grocery cart scanners, to total the cost of food. • Kitchen scales, for measuring ingredients by weight, not size. • Pharmacy dosing devices, to accurately measure liquid medication.
- 5. 5 Multiplying Strategies for Communicating Numbers Plain Talk 2013. Presented by Helen Osborne, M.Ed., OTR/L Strategies to Convey: Time In person: • Ask whether he or she uses a digital or analog clock/watch. Then demonstrate on the same. • Schedule around a person’s daily habits, such as “Take 1 pill after brushing your teeth in the morning and at night.” • Supplement with stories. For instance, to help explain “moderate exercise three times a day” you could write, “Pat walks 10 minutes after she eats breakfast, lunch and dinner.” In print: • Make a chart of what pills to take, when. Include check-off boxes so the person can mark each time he or she takes these pills. • Include visuals representing time, such as sunrise and sunset. • Use colors to indicate urgency such as: red (emergency, act now); yellow (important, call soon); green (can wait until next appointment). • Draw pictures, such as of an infant’s developmental milestones. • Use “gutters” in comics to show passage of time. With technology & devices, such as: • Pill boxes sectioned into day of week and time of day • Buzzers, phone alarms, and other electronic prompts
- 6. 6 Multiplying Strategies for Communicating Numbers Plain Talk 2013. Presented by Helen Osborne, M.Ed., OTR/L Strategies to Convey: Risk & Other Comparative Data In person: • Teach number-related terms such as “risk” and “frequency.” • Provide context, such as stating what a person’s cholesterol level is this year versus last, or in relation to others of the same age. • Use gestures, as for indicating high/low risks and benefits. • Draw risk ladders with rungs from bottom (least risk) to top (most risk). • Speak of data in terms of absolute risk, not just relative risk reduction. • When talking about studies, include the denominator (how many people were in the study) and time frame (over what period of time). • As indicated, frame results as positive (95% of patients improve), not negative (5% of patients do not improve or get worse). In print: • Use graphics to compare data: Icon arrays show part to whole. Line graphs tell story over time. Bar graphs compare differences in a series. Pie charts show proportion. • When asking people to rate opinions (such as about satisfaction) on a numeric scale, have the biggest number mean the best. • Provide context, such as normal or ideal cholesterol numbers. • Use a common denominator such as 10, 100, or 1,000. • Define important terms such as “common” and “rare.” • As possible, write “half” rather than “50%.” • As possible, state numbers as 100 or less, and 1 or more. • Consider “choice architecture,” the order in which you list alternatives. • Be flexible about writing rules. Really, it’s okay to write “5” rather than “five.” With technology & devices, such as: • Symbols, such as ratings with stars (books) or forks (recipes) These strategies are just a start. They were compiled from many sources. See “Ways to Learn More” (starting on p. 8) for a list of references.
- 7. 7 Multiplying Strategies for Communicating Numbers Plain Talk 2013. Presented by Helen Osborne, M.Ed., OTR/L Multiplying: Ideas x participants ________________________________________________________________________ ________________________________________________________________________ ________________________________________________________________________ ________________________________________________________________________ ________________________________________________________________________ ________________________________________________________________________ ________________________________________________________________________ ________________________________________________________________________ ________________________________________________________________________ ________________________________________________________________________ ________________________________________________________________________ ________________________________________________________________________ ________________________________________________________________________ ________________________________________________________________________ ________________________________________________________________________ ________________________________________________________________________ ________________________________________________________________________ ________________________________________________________________________ ________________________________________________________________________ Dividing: What this means to me ________________________________________________________________________ ________________________________________________________________________ ________________________________________________________________________ ________________________________________________________________________ ________________________________________________________________________ ________________________________________________________________________ ________________________________________________________________________ ________________________________________________________________________ ________________________________________________________________________ ________________________________________________________________________ ________________________________________________________________________ ________________________________________________________________________ ________________________________________________________________________ ________________________________________________________________________ ________________________________________________________________________ ________________________________________________________________________ ________________________________________________________________________ ________________________________________________________________________ ________________________________________________________________________
- 8. 8 Multiplying Strategies for Communicating Numbers Plain Talk 2013. Presented by Helen Osborne, M.Ed., OTR/L Ways to Learn More • AHRQ: How to Create a Pill Card. At http://www.ahrq.gov/patients- consumers/diagnosis-treatment/treatments/pillcard/pillcard.html • American College of Physicians, (2006). Living with Diabetes: An Everyday Guide for You and Your Family. Order at https://www.acponline.org/ebizatpro/ProductsandServices/EverydayGuides/E verydayGuidesDetail/tabid/242/Default.aspx?ProductId=20679 • Ancker JS, Senathirajah Y, Kufafka R, Starren JB (2006). “Design Features of Graphs in Health Risk Communication: A Systematic Review,” J Am Med Inform Assoc 13:608-618. • Apter AJ, Paasche-Orlow MK, Remillard JT, Bennett IM, Ben-Joseph EP, Batista RM, Hyde J, Rudd RE (October 2, 2008), “Numeracy and Communication with Patients: They Are Counting on Us,” Journal General Internal Medicine 23(12): 2117-24. • Bigwood S, Spore M (2003). Presenting Numbers, Tables, and Charts. Oxford University Press. • Davis TC, et al (2006), “Literacy and Misunderstanding of Prescription Drug Labels.” Annals of Internal Medicine, 145(12):887-894. • Doak C, Doak L, and Root J (1996). Teaching Patients with Low Literacy Skills, Second Edition. J.B.Lippincott Company, Philadelphia. Available online at http://www.hsph.harvard.edu/healthliteracy/resources/teaching-patients- with-low-literacy-skills/ • Fagerlin A, ZIkmund-Fisher BJ, Ubel PA et al (2007), “Measuring Numeracy without a Math Test: Development of the Subjective Numeracy Scale.” Medical Decision Making, 27:672-680. • Garcia-Retamero R, Okan Y, Cokely ET (2012), “Using Visual Aids to Improve Communication of Risks about Health: A Review,” The Scientific World Journal. Vol. 2012, Article ID 562637. • Gigerenzer G, Edwards A (2003). “Simple Tools for Understanding Risks: From Innumeracy to Insight,” British Medical Journal. 327:741-744. • Golbeck AL, Ahlers-Schmidt CR, Paschal AM, Dismuke SE (2005), “A Definition and Operational Framework for Health Numeracy,” American Journal of Preventative Medicine, 29(4):375-376. • Hibbard JH, Peters E, Dixon A, Tusler M (2007), “Consumer Competencies and the Use of Comparative Quality Information: It Isn’t Just About Literacy,” Med Care Res Rev 2007; 64;379. Available at http://mcr.sagepub.com/cgi/content/abstract/64/4/379 • Hill LH (2008), “The Role of Visuals in Communicating Health Information to Low Literate Adults.” Focus on Basics: Connecting Research and Practice, 9(B), World Education. • IconArray.com, at http://www.iconarray.com • Jackob Nielsen’s Alertbox (2007), “Show Numbers as Numerals When Writing for Online Readers,” http://www.useit.com/alertbox/writing- numbers.html
- 9. 9 Multiplying Strategies for Communicating Numbers Plain Talk 2013. Presented by Helen Osborne, M.Ed., OTR/L • Khamsi R, (March 18, 2013) “Tread Lightly: Labels That Translate Calories into Walking Distance Could Induce People to Eat Less,” Scientific American. At http://www.scientificamerican.com/article.cfm?id=labels-that-translate- calories-into-walking-distance • Lipkus IM, Hollands JG (1999). “The Visual Communication of Risk,” Journal of the National Cancer Institute. Monograph 25:149 -163. • McNaughton CD, Collins S, Kripalani S et al (2013). “Low numeracy is associated with increased odds of 30-day emergency department and hospital recidivism for patients with acute heart failure.” Circulation Heart Failure. • National Assessment of Adult Literacy (2003), http://nces.ed.gov/naal • National Cancer Institute, US Department of Health and Human Services (2011). Making Data Talk: A Workbook. At http://www.cancer.gov/cancertopics/cancerlibrary/MDT-Workbook.pdf • Osborne H (host), Zikmund-Fisher B (guest). (August 27, 2013). When Communicating Risk, Consider What Patients Need and Want to Know (HLOL #102). At http://healthliteracy.com/hlol-risk • Osborne H (host), McNaughton C (guest). (February 26, 2013), Numeracy, Chronic Disease, and Repeat Emergency Room Visits or Hospitalizations (HLOL #92). At http://healthliteracy.com/hlol-numeracy-hospitalizations • Osborne H (host), Quincy L (guest). (November 11, 2012). Choosing A Health Plan: Ways to Make This Experience Easier and More Consumer-Friendly (HLOL #87). At http://www.healthliteracy.com/hlol-healthplan • Osborne H (host), Nelson D (guest). (September 4, 2012). Clearly Communicating Scientific Information (HLOL #83). http://www.healthliteracy.com/hlol-scientific-information • Osborne H (host), Kristiansen K (guest) (May 29, 2012). A Tool That Pictures Pain (HLOL #78). At http://www.healthliteracy.com/hlol-pain-picture • Osborne H (host), Schwarz LM and Woloshin S (guests) (April 5, 2011). Helping Others Understand Health Messages (HLOL #56). At http://healthliteracy.com/hlol-understand-health-messages • Osborne H (host), Apter A (guest) (May 25, 2010). Numeracy: Helping Patients Understand Numeric Concepts (HLOL #38). At http://www.healthliteracy.com/hlol-numeric-concepts • Osborne, H (2011). Health Literacy From A to Z: Practical Ways to Communicate Your Health Message, Second Edition. Jones & Bartlett Learning. • Peters E, Meilleur L, Tompkins MK, (2013). “Numeracy and the Affordable Care Act: Opportunities and Challenges.” A paper commissioned by the Roundtable on Health Literacy, Institute of Medicine. At http://www.iom.edu/Activities/PublicHealth/~/media/Files/Activity%20Files/Pub licHealth/HealthLiteracy/Commissioned%20Papers/Numeracy%20and%20the %20Affordable%20Care%20Act%20- %20Opportinities%20and%20Challenges.pdf
- 10. 10 Multiplying Strategies for Communicating Numbers Plain Talk 2013. Presented by Helen Osborne, M.Ed., OTR/L • Reyna VF, Nelson WL, Han PK, Dieckmann NF (2009). “How Numeracy Influences Risk Comprehension and Medical Decision Making,” Psychology Bulletin, 135 (6): 943-973. • Rothman RL, Housam R, Weiss H et al (2006), “Patient Understanding of Food Labels: The Role of Literacy and Numeracy,” Am J Preventative Medicine; 31(5) 391-398. • Schwartz J (August 10, 2013). “Japan’s Debt Looks Like This: 1,000,000,000,000,000 Yen,” New York Times. At http://www.nytimes.com/2013/08/10/world/asia/japans-debt-reaches-new- milestone.html • SugarStacks. At http://www.sugarstacks.com • Thaler RH, Sunstein CR (2009), Nudge: Improving Decisions about Health, Wealth, and Happiness. Penguin Books. • Wheelan C (2013). Naked Statistics: Stripping the Dread from the Data. WW Norton Co, Inc. • Woloshin S, Schwartz LM, Welch HG (2008). Know Your Chances: Understanding Health Statistics. University of California Press. • Woloshin S, Schwartz LM, Welch HG (2002). “Risk Charts: Putting Cancer in Context.” Journal of the National Cancer Institute, Vol. 94, No. 11: 799-804. jncicancerspectrum.oupjournals.org/cgi/content/full/jnci;94/11/799?ij • Zikmiund-Fisher BJ (2013), “The Right Tool Is What They Need, Not What We Have; A Taxonomy of Appropriate Levels of Precision in Patient Risk Communication, “ Medical Care Research and Review, Supplement to 70(1) 35S-49A. Abstract at http://www.ncbi.nlm.nih.gov/pubmed/22955699 • Zikmund-Fisher BJ, Fagerlin A, Ubel PA (2010), “Risky Feelings: Why a 6% risk of cancer doesn’t always feel like 6%, Patient Education Counseling. ***