1. T he value of geographic information system (GIS)
technology for managers and executives in the
civic sphere has been clear for decades. In a very
broad sense, GIS gives stakeholders a holistic picture
of a community’s assets, resources, and problems by
contextualizing them with location. In the simplest
terms, GIS enables understanding of every aspect of
community data as it relates to geography. Today’s
expectations of GIS as a government solution are driven
by the principle of taking more prescriptive action.
Much money and effort is spent by public agencies
like utilities and emergency responders reacting
to events. Esri®
GIS technology now gives decision
makers the tools they need to get ahead of problems.
Over the past few years, governments have been
increasingly expected to deliver services in real-time
and make information more accessible, not only within
departments but with stakeholders such as other
governments and the tax-paying public. At the very
least, problem identification to action must now
occur in real-time.
Here are four ways GIS provides community leaders
with the ability to make informed decisions and
actualize real progress:
Real-time dashboards provide a way to absorb and derive
meaning from real-time data. Dashboards allow government
organizations to visualize information on a large scale and
allocate resources where they’re needed. During weather
emergencies, for instance, dashboards enable more efficient
ways to respond to flurries of endless snow.
In the city of Boston, Massachusetts, public works staff
now use dashboards and real-time data feeds to monitor and
respond to ice storms. During one of the largest blizzards in
U.S. history, that helped the city make decisions in real time,
saving money and protecting the lives of Boston commuters
and pedestrians.
Part of the decision-making process is communicating with
stakeholders. Esri®
story maps are an effective tool to improve
communication and understanding, not just with key members
of government but with citizens as well. They make data
accessible so that people who need critical information can
get the intelligence they need and take immediate action.
Advertising Supplement | esri.com
The Kids First Allen Story Map Journal was used effectively
to spur the eventual passage of a $272 million school bond
measure for Allen Independent School District (AISD) in
the Dallas suburb of Allen, Texas. It helped educate voters
about why a school bond was needed and included school
plans and potential tax implications.
The Celebrating Lost Loved Ones map was created to show
both prescription drug and heroin deaths to show that the
prescription drug and heroin addiction epidemics are bound
together, jointly causing massive impact. States are putting
together resources to display and analyze data such as
mortality trends within a community, prescription drug
dropbox locations, and prescription drug access points.
Each of these resources helps communities become better
informed about the effects of opioid addiction and enables
them to more intelligently fight it. Removing the stigma
attached to both legal and illegal drug addiction using
authoritative data will better inform future response to
opioid addiction in the U.S.
Learn more at
esri.com/DataDrivenDecisions
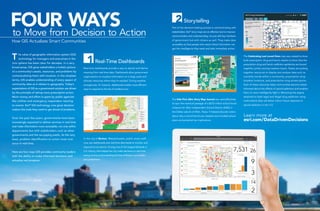
Real-Time Dashboards
Storytelling
FOUR WAYSto Move from Decision to Action
How GIS Actualizes Smart Communities