SlideShare ist ein Scribd-Unternehmen logo
1 von 85
Downloaden Sie, um offline zu lesen
SURVEY METHODOLOGY
•    From June 1, 2011 to June 8, 2011, Penn Schoen Berland conducted 2,017 interviews with
     the adult general population of the United States. Of the 2,017 interviews completed, 1,008
     interviews were conducted by phone and 1,009 interviews were conducted online.
                                                              Sample Size        Margin of Error
     General Population (All), including:                         2,017              ±2.18%
          Male                                                     968               ±3.15%
          Female                                                  1,049              ±3.03%
          Age 18-29                                                444               ±4.65%
          Age 30-44                                                545               ±4.20%
          Age 45-64                                                686               ±3.74%
          Age 65+                                                  343               ±5.29%
          Democrats                                                625               ±3.92%
          Republicans                                              585               ±4.05%
          Independents/Undecided                                   807               ±3.45%
          Less than $75K annual income                            1,392              ±2.63%
          $75K+ annual income                                      524               ±4.28%
          College degree                                           629               ±3.91%
          No college degree                                       1,357              ±2.66%
          White                                                   1372               ±2.65%
          African-American                                         242                ±6.3%
          Hispanic                                                 262               ±6.05%


•    The data presented in this study is reflective of the U.S. Census Bureau demographic
     statistics in terms of gender, age, ethnicity, income, education, region, and urbanicity.
                                                                                                   1
KEY FINDINGS
The Decade’s Defining Moment: September 11, 2001
  •  41% of respondents cite September 11, 2001 as the single most important event of
     the past decade
  •  63% of Americans think that the events of 9/11 weakened the U.S. and only 6%
     believe that the country has completely recovered from the events of 9/11
  •  71% are satisfied with the government’s response to September 11, 2001 (23% not
     satisfied) and 41% say the government could have taken additional actions to
     respond to the events (35% say no additional actions should have been taken)
A Decade of Decline
  •  68% of respondents think the past decade has been one of decline for the United
     States as a country, while only 23% believe the U.S. has progressed as a country in
     the past 10 years
  •  71% of Americans believe that the U.S. is in a worse position today than it was a
     decade ago, while only 11% think the country is in a better position
  •  47% say the past decade was one of the worst decades in the past century, 32%
     say it was about the same as other decades in the past century, while only 13%
     believe it was one of the best
Americans Blame their Political Leaders, not Terrorists, for the Decline
  •  Among the 71% of respondents who think the country is in a worse position, there is
     a clear consensus that their leaders are most to blame: 23% most blame the Bush
     Administration, 20% blame the Obama Administration, and 16% cite the U.S.
     Congress
  •  Only 7% of the American people who think the U.S. is now in a worse position than
     a decade ago believe that terrorist groups are most to blame for it

                                                                                           2
        ©PENN, SCHOEN & BERLAND ASSOCIATES, LLC.
KEY FINDINGS (CONTINUED)
The Enemy is Within: Economic Issues are Paramount
  •  66% think the greatest threats to long-term stability in the United States come primarily
     from within the United States, not from outside (27%)
  •  75% say that economic concerns present a greater threat to the current stability of the
     U.S. than national security concerns – only 18% think the reverse is more accurate
  •  Only 10% of Americans think that these internal threats are being addressed very
     effectively (another 32% say somewhat effectively, but 53% say not effectively)
  •  62% of respondents think that the U.S. is too involved in international affairs (10% say
     that it is not involved enough) and 83% say the U.S. needs to focus on domestic, not
     international, issues in the next decade – only 12% say the focus should be international

A Major Terrorist Attack is Likely in the Next Decade
  •  78% say it is likely that a major terrorist attack will take place in the U.S. in the next
     decade (35% say very likely and 43% say somewhat likely)
  •  49% of respondents are concerned that they will become a victim of terrorism in the next
     decade (versus 48% who say they are not concerned about the possibility)
  •  41% of Americans think that the killing of bin Laden has increased the threat of terrorism
     against the U.S. (19% say it has decreased the threat) and only 31% say the killing of bin
     Laden gives them a sense of closure (56% say the killing does not give them closure)
Time to Leave Afghanistan; Democratic Elections in Middle East Perceived to
Have Little Impact on U.S. National Interests
  •  2 in 5 Americans think that President Obama’s timeline to end U.S. combat operations in
     Afghanistan by 2014 is too slow, 38% think it is about right, while 10% perceive the
     timeline as too fast
  •  Fewer than 3 in 10 Americans expect that the new governments in Tunisia and Egypt will
     be friendlier towards the U.S. or will work to reduce terrorism, while the rest expect no
     change (1 in 3) or a turn for the worse (1 in 5)

                                                                                                  3
         ©PENN, SCHOEN & BERLAND ASSOCIATES, LLC.
THE DECADE’S DEFINING MOMENT:
SEPTEMBER 11, 2001


 NEW YORK • WASHINGTON • DENVER • SEATTLE • LOS ANGELES • SAN FRANCISCO • AUSTIN• LONDON • HONG KONG • BEIJING • DUBAI
                                                                                                                         4
 ©PENN, SCHOEN & BERLAND ASSOCIATES, LLC.
THE DECADE’S DEFINING MOMENT:
               SEPTEMBER 11, 2001
                    What was the single most important EVENT in the past decade?
                                             OPEN-END

          September 11, 2001                                                 41%
   Election of Barack Obama                                 9%
         Economic recession                                7%
   Death of Osama bin Laden                            5%
                       War in Iraq                    3%
             The war on terror                        3%
       Housing market crash                      2%
Passage of the Healthcare bill                 1%
Reelection of George W. Bush                   1%
                                Other                             15%
                       Don’t know                                13%          Showing All

                                                                                            5
           ©PENN, SCHOEN & BERLAND ASSOCIATES, LLC.
9/11 IS SEEN AS THE MOST IMPORTANT EVENT
        OF THE DECADE BY EVERY SUB-GROUP
What was the                                                                                                     College
                                                                                     Political
single most                         Gender                       Age                                   Income    Attainme        Race
                                                                                    Affiliation
important EVENT                                                                                                      nt
in the past                All
decade? OPEN-                      M        F    18-29 30-44 45-64 65+          D       R         I   <$75k>$75k No   Yes White AA Hisp
END
September 11, 2001         41      40      41      46        45    39      31   36      46    41       38   46   38   48    43    27        39
Election of Barack
                            9       9       9       7        8     11      8    15      4         8    9    9    9     8    7     24        9
Obama
Economic recession          7       8       7       7        5         9   8    7       8         7    6    9    7     7    8     7         6
Death of Osama bin
                            5       4       6       6        6         4   5    5       4         6    6    4    5     4    5     5         8
Laden
The war on terror           3       2       4       3        4         3   3    2       4         3    3    3    3     4    3     4         4

War in Iraq                 3       2       3       3        3         2   3    3       2         2    3    3    3     2    3     3         2

Housing market crash        2       2       2       2        1         3   2    1       2         2    2    3    2     2    2     0         2
Reelection of George
                            1       0       1       0        0         1   0    1       0         0    0    1    1     0    0     0         1
W. Bush
Passage of the
                            1       1       1       0        0         1   1    1       0         1    1    1    1     1    1     0         0
Healthcare bill
Others                     15      16      13      11        15    15      18   14      14    16       15   15   15   14    14    15        17

Don't Know                 13      14      13      15        12    10      20   14      14    13       16   8    15    9    14    14        12

                                                                                                                                        6
                  ©PENN, SCHOEN & BERLAND ASSOCIATES, LLC.
63% THINK THE EVENTS OF 9/11 AT LEAST
             SOMEWHAT WEAKENED THE UNITED STATES
                                 To what extent did the events of 9/11 weaken the U.S.?

                A great deal                        Somewhat                          Not very much                         Not at all


                22%                                                   41%                                      18%                   12%

                                                                                                                            Showing All


                                                                                                                        College
                                Gender                          Age              Political Affiliation     Income                            Race
                                                                                                                       Attainment
                      All
                               M        F     18-29   30-44       45-64    65+    D       R        I     <$75k >$75k   No      Yes   White   AA         Hisp

WEAKEN (TOTAL)        63      57       67      63      62             62   64    65      61       62      65    59     63      62     61     63         69
A great deal          22       20      23      19          22         24   18    25       17      22      23    20     23      19     18      29        34
Somewhat              41       37      44      44          40         38   46    40       44      40      42    39     40      43     43      34        35
NOT WEAKEN
                      30      37       24      28      31             32   31    29      34       28      29    38     29      34     32     28         23
(TOTAL)
Not very much         18       22      14      19          19         17   19    16       20      18      18    20     18      19     19      15        15
Not at all            12       15      10       9          12         15   12    13       14      10      11    18     11      15     13      13         8
Don’t know             7       5        9      10          7          7    4      6       5       10      7      4      8      4      6       8          9
                                                                                                                                                    7
                ©PENN, SCHOEN & BERLAND ASSOCIATES, LLC.
MAJORITY SAYS 9/11 HAS HAD A MOSTLY
             NEGATIVE LONG-TERM IMPACT
     •       However, 3 in 10 Americans believe that the long-term impact of 9/11 has been
             mostly positive on the United States

              Looking back on the events of 9/11, would you say that their long-term impact on the
                                             United States was…


                         Mostly positive                             Mostly negative                               Don't Know


                    30%                                                         56%                                              14%


                                                                                                                          Showing All

                                                                                                                     College
                             Gender                       Age              Political Affiliation     Income                              Race
                                                                                                                    Attainment
                   All
                            M        F     18-29    30-44    45-64   65+    D       R        I     <$75k   >$75k    No    Yes    White   AA         Hisp

Mostly positive    30      33       27       28      29         31   32    30       34      27      30      29      30     29     31      35        21
Mostly negative    56      54       58       58      59         52   57    54       54      59      54      61      54     60     55      49        59
Don’t know         14      13       15       14      12         17   12    16       12      14      16      10      16     10     14      16        20


                                                                                                                                                8
                  ©PENN, SCHOEN & BERLAND ASSOCIATES, LLC.
ONLY 6% BELIEVE THE COUNTRY HAS
               RECOVERED FROM 9/11 COMPLETELY
      •       Republicans are more likely than Democrats or Independents to think that the
              U.S. has recovered from the events of 9/11

             To what extent do you think that the United States has recovered from the events of 9/11?

                       Completely                                  Mostly                     A little                    Not at all


           6%                                    51%                                                              33%                         5%

                                                                                                                               Showing All
                                                                                                                           College
                                    Gender                         Age              Political Affiliation     Income                            Race
                                                                                                                          Attainment
                           All
                                    M       F     18-29   30-44      45-64    65+    D       R        I     <$75k >$75k   No      Yes   White   AA         Hisp

RECOVERED
                           57      59      55      58         56         55   57    57      63       51      55    59     56      59     58     51         53
(TOTAL)
Completely                  6       7       5       8         4          6    4      6       5        6      5      7      6       6     5       10         6
Mostly                     51      52      50       50        52         49   53    51       58      45      50    52     50      53     53      41        47
NOT RECOVERED
                           38      37      40      35         39         40   41    39      33       42      39    40     39      39     37     42         43
(TOTAL)
A little                   33      31      35       28        34         35   36    33       30      35      34    33     34      33     32      36        37
Not at all                  5       6       5       7         5          5    5      6       3        7      5      7      5       6     5       6          6
Don’t know                  5       5       6       7         6          5    2      3       4        8      5      2      5       2     5       8          4
                                                                                                                                                       9
                   ©PENN, SCHOEN & BERLAND ASSOCIATES, LLC.
7 IN 10 ARE AT LEAST SOMEWHAT SATISFIED
           WITH THE GOVERNMENT’S RESPONSE TO 9/11
      •      Younger Americans (18-29) and Independents are least likely to be satisfied
             with the response
                       Looking back, how satisfied are you with the government’s response to 9/11?

                 Very satisfied               Somewhat satisfied                     Not very satisfied                    Not at all satisfied


                        25%                                                      46%                                        15%                8%

                                                                                                                                 Showing All

                                                                                                                            College
                                      Gender                      Age              Political Affiliation     Income                              Race
                                                                                                                           Attainment
                            All
                                     M       F      18-29   30-44   45-64    65+    D       R        I     <$75k   >$75k    No     Yes   White   AA          Hisp

SATISFIED
                            71      72      71       64      69         75   79    71      83       62      71      75     70       74    73     66          67
(TOTAL)
Very satisfied              25      27       24      19      26         29   26    24       35      19      27      23      26      24    26      26         26
Somewhat satisfied          46      45       47      45      43         46   53    47       48      43      44      52      44      50    47      40         41
NOT SATISFIED
                            23      23      22       25      26         21   18    23      12       29      23      22     22       24    20     25          25
(TOTAL)
Not very satisfied          15      15       15      16      17         13   13    15       9       18      16      12      15      14    13      16         16
Not at all satisfied         8       8       7        9       9         8    5      8       3       11      7       10      7       10    7       9           9
Don’t know                   6       6       7       11       6         5    4      6       4        9      6       3       8       2     6       9           8
                                                                                                                                                        10
                       ©PENN, SCHOEN & BERLAND ASSOCIATES, LLC.
27% THINK THE U.S. HAS NOT SPENT ENOUGH
     MONEY TO PROTECT ITSELF FROM TERRORISM
     •       Independents are more likely than Democrats or Republicans to say the U.S.
             has spent too much money securing the country from terrorism
                    Do you think the U.S. has spent too much money securing the country from
                            terrorism, not enough, or just the right amount of money?


                                                                                                           Too much
                                                                38%                                        money
                                                                                                           Not enough
                                                 27%
                                                                     14%                                   Just the right
                                                           21%                                             amount
                                                                                                           Don't know
                                                                               Showing All

                                                                                                                            College
                                     Gender                         Age              Political Affiliation     Income                           Race
                                                                                                                           Attainment
                            All
                                    M        F     18-29   30-44      45-64    65+    D       R        I     <$75k >$75k   No    Yes    White   AA          Hisp

Too much money              21      23      20      25         25         18   17     19      16      27      22    20     20     26     21      19         23
Not enough                  27      28      26      16         24         33   30     23      35      23      27    28     28     24     28      29         24
Just the right amount       38      37      39      44         39         34   38     45      37      34      37    42     38     40     38      37         39
Don’t know                  14      13      15      15         12         14   15     12      12      16      14    10     14     11     14      15         14

                                                                                                                                                       11
                    ©PENN, SCHOEN & BERLAND ASSOCIATES, LLC.
MOST THINK THAT THE GOVERNMENT’S
             RESPONSE DOMESTICALLY WAS JUSTIFIED
      •      Independents, young Americans (18-29), and those with a college degree are
             less likely than other sub-groups to be satisfied with the domestic response

               Do you think the government’s response to 9/11 within the United States, including
               the Patriot Act, enhanced security at airports, and the creation of the Department of
                Homeland Security went too far and encroached on American civil liberties or was
                        the response justified as a means of protecting American citizens?

                               Went too far                               Justified                           Don't Know


                   26%                                                           62%                                               12%

                                                                                                                           Showing All


                                                                                                                       College
                                   Gender                      Age              Political Affiliation     Income                           Race
                                                                                                                      Attainment
                         All
                                  M        F     18-29   30-44   45-64    65+    D       R        I     <$75k >$75k   No     Yes   White   AA      Hisp

Went too far             26       31      22      30      29         23   24    24       21      32      26    28     24      33    26      20         30
Justified                62       60      64      52      59         68   69    65       71      53      62    66     63      62    63      64         57
Don’t know               12       9       14      19      12         9    7      11      8       15      12     7     13      6     10      16         13

                                                                                                                                                  12
                   ©PENN, SCHOEN & BERLAND ASSOCIATES, LLC.
PLURALITY SAYS THE GOVERNMENT SHOULD
      HAVE TAKEN ADDITIONAL ACTIONS AFTER 9/11
      •      Men, Hispanics, and those with an annual income exceeding $75,000 are the
             three sub-groups most likely to say that the government should have taken
             additional actions

                           Thinking about the government’s response to 9/11, were there
                           additional actions that you think SHOULD HAVE been taken?


                                  Yes                                        No                             Don't Know


                            41%                                                      35%                                       24%

                                                                                                                            Showing All

                                                                                          Political                        College
                                    Gender                        Age                                         Income                           Race
                                                                                         Affiliation                      Attainment
                          All
                                   M       F     18-29      30-44   45-64     65+   D        R         I    <$75k >$75k   No    Yes    White   AA          Hisp

Yes                       41      46      37       38        45         42    37    41       37        44    40    46     41     43     39      45         46
No                        35      34      36       39        35         33    34    34       40        32    35    37     34     37     36      32         32
Don’t know                24      20      27       23        19         25    29    25       22        24    25    17     25     20     24      23         22


                                                                                                                                                      13
                 ©PENN, SCHOEN & BERLAND ASSOCIATES, LLC.
ADDITIONAL ACTIONS THAT SHOULD
          HAVE BEEN TAKEN AFTER 9/11
      IF ADDITIONAL ACTIONS (N=831): What actions should have been taken? OPEN-END

                  More aggressive/rapid response                                       19%
         Should have gone after the right people                           12%
        Better transportation and border security                         11%
                                       More intelligence             5%
                   Taken warnings more seriously                     5%
Just did not like the way the govt. handled things                  4%
           Should not have rushed to war so fast                  3%
                    More for families of the victims              3%
       Cut ties to countries that harbor terrorists              2%
                   The government did a good job                2%
                      More international diplomacy              2%
                       Earlier/quicker investigation            2%
      The government should have told the truth                 1%
                           Less political correctness          1%
                           Focused more on the U.S.            1%
                                                       Other                     16%
                                               Don't know                  13%
                                                                                             14
            ©PENN, SCHOEN & BERLAND ASSOCIATES, LLC.
1 IN 4 SAYS SOME OF THE U.S. ACTIONS
           AFTER 9/11 SHOULD NOT HAVE BEEN TAKEN
      •      Democrats, those with a higher level of income, and those respondents with a
             college degree are more likely than other sub-groups to say that some actions
             that were taken should not have been taken as a response to 9/11

                           Thinking about the government’s response to 9/11, did the
                      government take actions that you think should NOT have been taken?


                                   Yes                                  No                              Don't Know


                  26%                                                         55%                                              19%

                                                                                                                           Showing All

                                                                                                                       College
                               Gender                        Age              Political Affiliation     Income                             Race
                                                                                                                      Attainment
                     All
                              M        F      18-29   30-44    45-64    65+    D       R        I     <$75k   >$75k   No     Yes   White   AA          Hisp

Yes                   26      29       23      26      30          27   18    31       17      29      24      34     22      34    25      30         25
No                    55      54       56      51      54          55   63    48       69      51      56      54     57      53    57      50         53
Don’t know            19      16       21      23      16          18   20    21       14      20      20      12     21      13    18      20         23


                                                                                                                                                  15
                  ©PENN, SCHOEN & BERLAND ASSOCIATES, LLC.
ACTIONS THAT SHOULD NOT HAVE BEEN
            TAKEN IN RESPONSE TO 9/11
•    Those who say the U.S. should not have taken certain actions following 9/11
     primarily cite the invasion of Iraq
                          IF ACTIONS SHOULD NOT HAVE BEEN TAKEN (N=526):
                           What actions should not have been taken? OPEN-END


          * A word cloud is a visual representation of free-form text, with a larger font size
          indicating a greater number of respondents referenced the term in their response
                                                                                                 16
          ©PENN, SCHOEN & BERLAND ASSOCIATES, LLC.
2 IN 5 SAY THEIR DAILY LIVES ARE STILL
              AFFECTED BY THE EVENTS OF 9/11
      •      Hispanics are most likely to say that the events of 9/11 still affect their daily
             lives, while those respondents age 18-29 are least likely to say they feel the
             effect of the events on a daily basis


                               Did the events of 9/11 change your life in ways that still affect
                                                    your day-to-day life?

                                   Yes                                   No                                 Don't Know


                           39%                                                                      55%                                    6%


                                                                                                                           Showing All

                                                                                                                       College
                            Gender                       Age                  Political Affiliation     Income                             Race
                                                                                                                      Attainment
                  All
                          M        F      18-29    30-44     45-64   65+       D       R        I     <$75k   >$75k   No     Yes   White    AA         Hisp

Yes               39      37       40      34       43         40    36       39       41      37      37      45     38     41     36      45         48
No                55      56       54      58       52         52    61       54       55      56      55      52     55     54     59      44         43
Don’t know        6        7       6        8        5         8     3         7       4        7      7       3       7     4      5       12          9


                                                                                                                                                  17
                  ©PENN, SCHOEN & BERLAND ASSOCIATES, LLC.
WAYS 9/11 STILL AFFECTS PEOPLE’S DAILY
                   LIVES TODAY
•    Increased caution while traveling and dealing with enhanced airport security
     are the primary ways Americans say their life is still affected by 9/11

                          IF STILL AFFECTED (N=783): In what ways? OPEN-END


          * A word cloud is a visual representation of free-form text, with a larger font size
          indicating a greater number of respondents referenced the term in their response

                                                                                                 18
          ©PENN, SCHOEN & BERLAND ASSOCIATES, LLC.
4 IN 5 THINK THE COUNTRY FELT MORE
              VULNERABLE THAN EVER AFTER 9/11
       After the events of 9/11 do you think the country went through an emotional change– do you
       think the U.S. felt more vulnerable than ever to a potential attack or did the events of 9/11 not
                                   really change the country emotionally?


                                   The U.S. felt more vulnerable than ever to a potential attack
                                   Did not really change the country emotionally
                                   Don't Know


                                                               81%                                                           12%           7%

                                                                                                                             Showing All


                                                                                                                         College
                                   Gender                      Age              Political Affiliation     Income                             Race
                                                                                                                        Attainment
                         All
                                  M       F      18-29   30-44   45-64    65+    D       R        I     <$75k   >$75k   No     Yes   White   AA          Hisp
The U.S. felt more
vulnerable than ever     81      80       82      76      81         84   84    82       83      80      80      85     79      85    84      74         80
to a potential attack
Did not really change
the country              12      12       11      14      12         10   12    11       12      12      12      10     12      10    10      16         12
emotionally
Don’t know                7       7       6        9       7         7    4      7       5        8      7       5       8      4     6       10          9
                                                                                                                                                    19
                    ©PENN, SCHOEN & BERLAND ASSOCIATES, LLC.
THE EVENTS OF 9/11 MOSTLY UNITED
                           AMERICANS
     •       Hispanics are more likely than white Americans or African-Americans to say
             that the impact of the 9/11 events has been mostly divisive on Americans

                 Looking back on the events of 9/11, would you say that their impact has mostly
                                  divided Americans or mostly united them?

                        Mostly united                                        Mostly divided                             Don't Know


                                                   71%                                                                   19%            10%


                                                                                                                                Showing All

                                                                                                                            College
                                   Gender                         Age                Political Affiliation     Income                           Race
                                                                                                                           Attainment
                          All
                                  M        F     18-29   30-44      45-64      65+    D       R        I     <$75k >$75k   No     Yes   White   AA          Hisp

Mostly united             71      71      71      63         69         75     78     73      75      66      70    74     71     70     73      70         62
Mostly divided            19      20      18      25         21         16     15     19      16      22      18    21     17     24     18      18         25
Don’t know                10       9      11      13         10         9      7      8       9       12      12     5     12      6     9       13         13


                                                                                                                                                       20
                  ©PENN, SCHOEN & BERLAND ASSOCIATES, LLC.
MOST THINK AMERICANS ARE WORKING
              TOGETHER MORE SINCE 9/11
     •       Independents are less likely than Republicans and Democrats to say that
             Americans are working together more since 9/11

             Since the events of 9/11, do you think Americans are working together more to achieve
                       common objectives, or are they working against each other more?


                   Working together                               Working against each other                             Don't Know


                                           57%                                                       27%                         16%

                                                                                                                          Showing All


                                                                                                                     College
                              Gender                       Age              Political Affiliation     Income                             Race
                                                                                                                    Attainment
                    All
                             M        F     18-29    30-44    45-64   65+    D       R        I     <$75k   >$75k   No    Yes    White   AA          Hisp

Working together    57      53       61       56      56         60   56    67       59      48      58      55     60     50     55      64         63
Working against
                    27      31       23       30      27         25   25    22       24      32      25      33     23     35     28      23         22
each other
Don’t know          16      16       16       14      17         15   19    11       17      19      17      12     17     15     17      13         16

                                                                                                                                                21
                   ©PENN, SCHOEN & BERLAND ASSOCIATES, LLC.
A NECESSARY CONVERSATION ABOUT
          ALLEGIANCE OR MORE INTOLERANCE?
     •       Republicans, respondents age 65+, and men are more likely to say that 9/11 led
             to a necessary conversation, while young Americans (18-29), Democrats, and
             minorities are more likely to say it raised intolerance towards minorities
                                                               Which is closer to your view?

The events of 9/11
led to a necessary                                                                                                                  The events of 9/11
   conversation                                                                                                                        senselessly
     about the                                                                                                                      raised intolerance
 allegiance to the                                                                    48%                 37%                       toward minorities
 United States of                                                                                                                       living in the
 certain groups of                                                                                                                    United States.
      people.                                                                           Showing All


                                                                                             Political                        College
                                       Gender                        Age                                         Income                           Race
                                                                                            Affiliation                      Attainment
                              All
                                      M       F     18-29      30-44   45-64    65+    D        R         I    <$75k >$75k   No    Yes    White   AA          Hisp
Necessary conversation
about the allegiance to the   48     52      44       40        45         50   57     37       66        43    47    52     46     51     51      38         40
United States
Senselessly raised
intolerance toward            37     35      39       44        38         36   27     48       22        38    36    38     36     38     35      41         43
minorities
Don’t Know                    15     14      17       15        17         14   15     14       12        19    17    10     18     11     14      21         17
                                                                                                                                                         22
                    ©PENN, SCHOEN & BERLAND ASSOCIATES, LLC.
2 IN 5 SAY AMERICANS HAVE BECOME MORE
             TOLERANT OVER THE PAST DECADE

                Do you generally think that Americans are more tolerant today of other people, less
                 tolerant, or are they about as tolerant of other people as they were a decade ago?


                                                                                               More tolerant
                                                      29%
                                                                                               Less tolerant
                                                                         28%
                                                    39%                                        About the same
                                                                         4%
                                                                                               Don't know
                                                                           Showing All

                                                                                                                         College
                               Gender                         Age               Political Affiliation     Income                             Race
                                                                                                                        Attainment
                     All
                              M        F     18-29    30-44     45-64     65+    D       R        I     <$75k   >$75k   No    Yes    White   AA          Hisp

More tolerant        39       39      39       36      42           40    35    39       42      36      37      42     38     40     38      41         41
Less tolerant        29       28      30       30      29           30    27    33       23      31      31      25     30     28     28      27         35
About the same       28       29      27       28      25           27    33    24       31      28      27      31     27     29     29      28         20
Don’t know            4       4        4       6        4           3      5     4       4        5      4       2       5     3      4       4           4

                                                                                                                                                    23
                   ©PENN, SCHOEN & BERLAND ASSOCIATES, LLC.
SOME SAY AMERICANS HAVE BECOME
       LESS TOLERANT OF MUSLIMS
        IF LESS TOLERANT (N=589): Which specific group or groups of people do you
         think Americans are less tolerant of than they were a decade ago? OPEN-END

                     Muslims                                          33%
                Immigrants                                      20%
                  Hispanics                               16%
       Gays and lesbians                           8%
             Young adults                          8%
   Upper class Americans                          7%
       African-Americans                         6%
                      Seniors                    6%
                Caucasians                      5%
 Working class Americans                        5%
  Middle class Americans                        5%
                          Jews                3%
Don't Know / No Response                                13%
                                                                        Showing All (N=589)
                       Others                           13%
                                                                                              24
         ©PENN, SCHOEN & BERLAND ASSOCIATES, LLC.
9/11: A LASTING IMPACT ON HOW
                   AMERICANS PERCEIVE MUSLIMS
      •      In each major sub-group approximately 3 in 4 say that the events of 9/11 have
             had a lasting impact on Americans’ tolerance of Muslims

                    Do you think the events of 9/11 have had a lasting impact on Americans’
                                            tolerance of Muslims?


                                   Yes                                        No                              Don't Know


                                                          78%                                                               14%               8%

                                                                                                                                Showing All


                                                                                           Political                        College
                                     Gender                        Age                                         Income                            Race
                                                                                          Affiliation                      Attainment
                           All
                                    M       F     18-29      30-44   45-64     65+   D        R         I    <$75k >$75k   No      Yes   White   AA          Hisp

Yes                        78      77      78       80        76         79    76    78       81        75    77    81     77      79     79      71         80
No                         14      15      12       11        15         14    15    14       14        14    15    13     14      14     14      14         10
Don’t Know                  8       8       9       9         10         7     9     9        5         11    9      6      9       7     7       15         10

                                                                                                                                                        25
                  ©PENN, SCHOEN & BERLAND ASSOCIATES, LLC.
A DECADE OF DECLINE


 NEW YORK • WASHINGTON • DENVER • SEATTLE • LOS ANGELES • SAN FRANCISCO • AUSTIN• LONDON • HONG KONG • BEIJING • DUBAI
                                                                                                                         26
 ©PENN, SCHOEN & BERLAND ASSOCIATES, LLC.
A DECADE OF DECLINE
     •       Fewer than 1 in 4 of respondents think that it has been a decade of progress;
             African-Americans are the most likely sub-group to say that the pass decade
             has been one of progress (43% versus 23% of all respondents)

           Overall, do you think the past decade has been one of progress or decline for the United
                                             States as a country?

                              Progress                                       Decline                             Don't Know


                 23%                                                                 68%                                                  9%

                                                                                                                              Showing All


                                                                                                                          College
                                  Gender                          Age              Political Affiliation     Income                            Race
                                                                                                                         Attainment
                        All
                                 M        F     18-29 30-44 45-64            65+    D       R        I     <$75k >$75k   No      Yes   White   AA          Hisp
Progress                23       24      22      27          24         20   20    32       14      22      23    23     24      21     18      43         29
Decline                 68       69      67      60          67         72   72    56       79      69      67    70     66      71     74      46         58
Don’t Know               9       7       11      13          9          7     8    12       7        9      10     7     10      8      8       11         12


                                                                                                                                                      27
                  ©PENN, SCHOEN & BERLAND ASSOCIATES, LLC.
7 IN 10 THINK THE COUNTRY IS IN A WORSE
                POSITION THAN IT WAS A DECADE AGO
     •       Republicans, seniors (age 65 and older), and white Americans are most likely to
             say that the country is worse off than it was a decade ago
             Generally speaking, do you think the U.S. is in a better or worse position than it was a
                                     decade ago, or is it about the same?


                                                  71%                                               Better
                                                                                                    Worse
                                                                             16%                    About the same
                                                                                                    Don't know
                                                                             2%
                                                             11%                  Showing All


                                                                                                                            College
                                   Gender                         Age                Political Affiliation     Income                           Race
                                                                                                                           Attainment
                          All
                                  M        F     18-29   30-44      45-64     65+     D       R        I     <$75k >$75k   No    Yes    White   AA          Hisp

Better                    11      12      10      12         12         10    7       18      4       10      11    11     11     11     8       22         10
Worse                     71      70      72      66         68         74    78      60      84      71      71    71     71     72     77      43         70
About the same            16      16      16      20         18         13    13      20      10      17      16    16     16     16     13      31         16
Don’t know                 2       2       2       2         2          2     2       2       1       2       2      2      2     2      1       4           4
                                                                                                                                                       28
                  ©PENN, SCHOEN & BERLAND ASSOCIATES, LLC.
THE RISING NATIONAL DEBT – THE MOST
         IMPORTANT TREND OF THE DECADE
           Which of the following is the most important TREND of the past decade? OPEN-END

                               The rising national debt                    16%
                        U.S. jobs being sent overseas                   14%
                         Increased use of technology                   13%
                           Increasing corporate greed             9%
                            Spread of global terrorism          7%
                                Increasing immigration        5%
                           The decline of home prices         5%
                               The rise of social media       5%
Increasing role of women in the workplace and politics      3%
The U.S. population becoming more ethnically diverse        3%
                     The U.S. population getting older     2%
                                  The 24-7 news cycle      2%
                              The rise of online search    2%
         The increasing number of independent voters      1%
               Arab Spring protests in the Middle East    1%
                            The decline of print media    1%
                                                  Other      4%
                                                                              Showing All
                                            Don’t know         6%
                                                                                             29
               ©PENN, SCHOEN & BERLAND ASSOCIATES, LLC.
WEAKER ECONOMY THE TOP REASON FOR
       THE U.S. BEING IN A WORSE POSITION
             IF U.S. IS IN WORSE POSITION (N=1,440) Why do you think the U.S. is in a
                         worse position than it was a decade ago? OPEN-END

                            Weaker economy                                       28%
                         Rising national debt                             17%
                       Higher unemployment                               16%
                Wars in Afghanistan and Iraq                       12%
                  High government spending                        11%
                    Loss of jobs to overseas                     10%
                              High fuel costs                  8%
                          Weaker U.S. dollar                   8%
                           Healthcare reform              5%
Rise of other global powers like China, India             5%
             Weaker partnerships with allies             4%
                More government regulation               4%
                            Fear of terrorism            4%
           More partisanship in Washington               4%
                     Fewer personal liberties           3%
                                     Tax cuts           3%
                 Less government regulation            2%
                                        Other                                    28%
                  Don't Know / No Response                6%                      Showing All
                                                                                  (N=1,440)     30
            ©PENN, SCHOEN & BERLAND ASSOCIATES, LLC.
AMERICANS WHO THINK THE U.S. IS IN A
     BETTER POSITION: THE TOP REASONS
              IF U.S. IS IN BETTER POSITION: Why do you think the U.S. is in a better
                            position than it was a decade ago? OPEN-END

          Barack Obama elected president                                    22%
                    Technological advances                           16%
                         Stronger economy                       9%
Improvements in national security and safety               6%
        More democracy in the Middle East                  6%
          Stronger partnerships with allies               5%
                          Healthcare reform               5%
                            Progress in Iraq              5%
                    Progress in Afghanistan              4%
                 Death of Osama bin Laden                4%
                 Death of Saddam Hussein               2%
               Less government regulation             1%
               More government regulation             1%
                                    Tax cuts          1%
                                      Other                                                 34%
                                Don't know                                 20%
                                                                                  Showing All (N=214)

                                                                                                  31
           ©PENN, SCHOEN & BERLAND ASSOCIATES, LLC.
35% OF AMERICANS ARE WORSE OFF
                THAN THEY WERE A DECADE AGO
     •       Americans whose annual income is more than $75,000 are significantly more
             likely than those with a lower income to say their life has improved
                   Are you personally in a better or worse position than you were a decade
                                         ago, or is it about the same?


                                                   35%                                         Better

                                                                      33%                      Worse
                                                                                               About the same
                                                     32%                                       Don't know
                                                                       1%
                                                                       Showing All

                                                                                                                        College
                              Gender                        Age                Political Affiliation     Income                             Race
                                                                                                                       Attainment
                    All
                             M        F      18-29   30-44    45-64      65+    D       R        I     <$75k   >$75k   No    Yes    White   AA          Hisp

Better               32      33       30      36      43          24     21    34       28      32      26      46     28     40     30      39         31
Worse                35      34       35      26      31          41     38    36       36      33      40      21     37     28     35      30         32
About the same       33      32       33      35      25          34     40    29       34      34      32      32     33     32     33      29         35
Don’t know           1        1       1        3       1          1      0      1       2        1      2       1       2     1      1       2           1
                                                                                                                                                   32
                 ©PENN, SCHOEN & BERLAND ASSOCIATES, LLC.
ONE OF THE WORST DECADES IN THE
                       PAST CENTURY
     •       White Americans are significantly more likely than racial minorities to perceive
             it as one of the worst decades
      In your opinion, how does the past decade compare to the other decades in the past hundred
     years? Would you say this past decade has been one of the best in the past century, one of the
                                 worst, or has it been about the same?


                                                                                                  One of the best

                                                                    32%                           One of the
                                               47%
                                                                                                  worst
                                                                                                  About the same
                                                                        8%
                                                          13%
                                                                                                  Don't know
                                                                                 Showing All

                                                                                                                           College
                                  Gender                      Age                 Political Affiliation     Income                             Race
                                                                                                                          Attainment
                        All
                                 M       F      18-29   30-44   45-64    65+       D       R        I     <$75k   >$75k   No    Yes    White   AA          Hisp

One of the best         13      15       11      15      14         12   10       17       11      11      13      12     15     9      9       21         23
One of the worst        47      47       47      40      47         50   51       42       51      48      47      47     45     51     52      34         34
About the same          32      32       33      36      31         31   32       32       30      34      31      35     31     34     31      37         35
Don’t know               8       6       9        9       8         7        7     9       8        7      8       7       9     6      8       8           8
                                                                                                                                                      33
                   ©PENN, SCHOEN & BERLAND ASSOCIATES, LLC.
RESPONDENTS SAY THE OVERALL QUALITY OF
      LIFE HAS DECLINED FOR MANY AMERICANS
      Please indicate whether you think the overall quality of life has improved, declined, or stayed the
       same in the past decade for each of the following groups of people living in the United States.


                                         Declined             Improved          Stayed the same
                                                                                                          Upper class
                                                                                                                      Gays and
                                                                                                          Americans
                                                                                                  Hispanics           lesbians
                                                                              African-
                                                                                         Immigrants
                                                                             Americans
                                        Jews
                                                                                                            48%
                                        15%           16%                       33%                44%               55%
                                                                                          41%
                          14%                                 17%      23%
     9%       10%
                                        41%           37%
                          25%                                                   32%                25%      31%
     17%      20%                                             22%      22%                23%                        19%
                                        16%                                                        19%      15%      11%
                                                                       32%      24%       24%
                                                      38%
                          55%                                 54%
     70%      64%                                                     Muslims
                                                 Caucasians

                        Seniors                             Young adults
             Middle class
Working class Americans                                                                            Showing All
 Americans
                                                                                                                       34
                ©PENN, SCHOEN & BERLAND ASSOCIATES, LLC.
DETERIORATED RELATIONSHIPS WITH
            MANY FOREIGN COUNTRIES
                  In the past decade, has each of the following country’s relationship with
                           the U.S. improved, deteriorated, or remained the same?

                            Deteriorated                   Improved              Remained the same            United Kingdom

                                                                                                            India            China
                                                                                            Russia
                                                                                                                    26%
                                                            Saudi
                                                            Arabia           Israel         19%             24%
                                                                                                                             33%
                                                            10%              12%
                                                                     11%
4%                 5%                    7%
                              6%                                                                     22%            47%
        5%                                          7%      38%                       15% 42%               40%
29%               26%                                                31% 35%                                                 33%
        17%                  19% 25% 17%                                              14%            14%

                                                                                                            15% 13%
                                                                                            22%                              24%
                  38%                                       34% 38% 35%
42%
                                        51%                                                          51%
        58%                  62%                   62%                                59%
                 Yemen                                               Egypt
Syria
                                        North                                                        Iraq
        Libya                           Korea
                               Iran              Pakistan                        Afghanistan                   Showing All
                                                                                                                              35
                ©PENN, SCHOEN & BERLAND ASSOCIATES, LLC.
AMERICANS BLAME THEIR LEADERS, NOT
TERRORISTS, FOR THE DECLINE


 NEW YORK • WASHINGTON • DENVER • SEATTLE • LOS ANGELES • SAN FRANCISCO • AUSTIN• LONDON • HONG KONG • BEIJING • DUBAI
                                                                                                                         36
 ©PENN, SCHOEN & BERLAND ASSOCIATES, LLC.
AMERICANS BLAME THEIR LEADERS
      IF U.S. IS IN A WORSE POSITION : Which of these, if any, is most to blame for the U.S.
                       being in a worse position than it was a decade ago?

         The Bush administration                                             23%
        The Obama administration                                           20%
                  The U.S. Congress                                  16%
                      Corporate CEOs                            8%
                      Terrorist groups                      7%
                               Wall Street                 6%
           Special interest groups                         5%
                              Immigrants              3%
        Ordinary American people                      3%
Rising powers like China and India                    2%
                           Labor unions               2%
                                       Other          3%
                                                                                   Showing All
                              Don’t know              2%                           (N=1,440)
                                                                                                 37
           ©PENN, SCHOEN & BERLAND ASSOCIATES, LLC.
AMERICANS BLAME THEIR LEADERS FOR
                   THE DECLINE
IF U.S. in a worse                                                                                                                College
                                          Gender                      Age               Political Affiliation     Income                                Race
position: Which of                                                                                                               Attainment
those, if any, is most
                             All
to blame for the U.S.      (N=1,440)
being in a worse                          M       F     18-29   30-44   45-64    65+      D       R       I     <$75k >$75k      No      Yes     White    AA      Hisp
                                       (N=683) (N=757) (N=295) (N=369) (N=508) (N=268) (N=376) (N=493) (N=571) (N=992) (N=373) (N=962) (N=455) (N=1062) (N=104) (N=183)
position than it was a
decade ago?
The Bush administration      23          19      26      31      25         21   13      45       7      21      24      17      24      22       17      54        33
The Obama
                             20          20      20      15      14         21   32       6      36      16      19      23      20      21       24      1         13
administration
The U.S. Congress            16          21      11      10      15         17   21       9      20      16      16      16      16      16       18      9         12
Wall Street                   6          7       6       5        7         7     4       6       6       6       5       8       6       7       5       10        9
Corporate CEOs                8          7       9       7       10         8     6      10       5       9       8       8       7      10       8       4         3
Special interest groups       5          5       4       3        6         5     3       3       5       5       4       6       4       5       4       3         7
Labor unions                  2          2       1       1        1         2     3       0       2       2       1       2       2       1       2       0         2
Terrorist groups              7          6       8       12       7         6     4       7       5       9       8       5       8       5       7       6         9
Ordinary American
                              3          4       2       7        5         1     1       3       2       5       3       4       3       4       3       2         7
people
Rising powers like China
                              2          2       2       1        2         1     4       2       3       1       2       2       2       1       2       1         1
and India
Immigrants                    3          2       5       4        2         4     3       5       3       3       4       3       4       2       4       5         1
Other                         3          3       3       1        4         3     3       2       3       3       3       3       3       3       3       2         1
None of these                 0          0       0       0        1         0     0       0       0       0       0       1       0       1       0       0         0
Don’t know                    2          2       2       3        1         2     2       1       2       3       2       1       2       1       2       3         1


                                                                                                                                                               38
                    ©PENN, SCHOEN & BERLAND ASSOCIATES, LLC.
THE ENEMY IS WITHIN: ECONOMIC ISSUES
ARE PARAMOUNT


 NEW YORK • WASHINGTON • DENVER • SEATTLE • LOS ANGELES • SAN FRANCISCO • AUSTIN• LONDON • HONG KONG • BEIJING • DUBAI
                                                                                                                         39
 ©PENN, SCHOEN & BERLAND ASSOCIATES, LLC.
2 IN 3 SAY THE ENEMY IS WITHIN
     •       Those Americans with a college degree and those whose annual income exceeds
             $75,000 are more likely than those without a degree or those respondents with
             less than $75,000 to think that major threats originate within the U.S.

             Do the greatest threats to long-term stability in the United States come primarily from
                   within the United States or do they come from outside the United States?


                          Within the U.S.                             Outside the U.S.                              Don't Know


                                                   66%                                                            27%                   7%

                                                                                                                          Showing All


                                                                                                                      College
                              Gender                       Age              Political Affiliation     Income                              Race
                                                                                                                     Attainment
                    All
                             M        F     18-29    30-44    45-64   65+    D       R        I     <$75k   >$75k    No     Yes   White   AA          Hisp

Within the U.S.     66      69       63       62      70         65   64    62       68      66      62      76      62     75     68      55         59
Outside the U.S.    27      26       28       28      23         29   29    30       26      25      30      18      30     20     25      34         32
Don’t Know          7        5       10       10       7         6    7      7       6        8      7       6        8      5     7       11          9

                                                                                                                                                 40
                   ©PENN, SCHOEN & BERLAND ASSOCIATES, LLC.
ECONOMIC, NOT NATIONAL SECURITY,
      CONCERNS PRESENT A GREATER THREAT
     •       White Americans are more likely than African-Americans or Hispanics to view
             economic concerns as a greater threat to the current stability of the U.S.

                                                            Which is closer to your view?


     Economic                                                                                                                       National security
concerns present a                                                                                                                 concerns present a
                                                                                                                                     greater threat to
                                                                                                     75% 18%
  greater threat to
the current stability                                                                                                              the current stability
     of the U.S.                                                                                                                        of the U.S.

                                                                                           Showing All


                                                                                             Political                        College
                                        Gender                        Age                                        Income                           Race
                                                                                            Affiliation                      Attainment
                               All
                                       M       F     18-29      30-44   45-64    65+   D        R         I    <$75k >$75k   No    Yes    White   AA          Hisp
Economic concerns
present a greater threat to
                               75     76      75       72        77         77   73    74       81        73    73    84     72     84     80      63         67
the current stability of the
U.S.
National security concerns
present a greater threat to
                               18     18      17       20        16         16   20    19       14        19    19    11     20     12     14      26         25
the current stability of the
U.S.
Don’t Know                     7       6       8       8         7          6    7     7        4         9     7      5      8     4      6       11          8
                                                                                                                                                         41
                     ©PENN, SCHOEN & BERLAND ASSOCIATES, LLC.
INTERNAL THREATS VERSUS EXTERNAL
               THREATS
Please indicate whether each of the following presents a major threat, minor threat, or no threat at
                          all to long-term stability in the United States.

                                       Internal Threat   External Threat
                     Rising national debt                                               78%
              High government spending                                                  77%
                       The budget deficit                                              75%
                  Rising healthcare costs                                             73%
                   Weakening U.S. Dollar                                             72%
America's education system falling behind                                            71%
      American jobs being sent overseas                                              71%
              Spread of nuclear weapons                                            67%
 America's dependence on foreign energy                                            66%
                                  Al Qaeda                                    58%
                 Lack of high-paying jobs                                    56%
                       Domestic terrorists                                   56%
                  Decline of moral values                                    55%
                                    Taliban                                 53%
                           Partisan politics                              49%
  Rise of new powers like China and India                               45%
                        Illegal immigrants                              44%
                       Government of Iran                               44%
              Government of North Korea                               39% Showing % Major threat
                                 Hezbollah                      27%
                                    Hamas                       27%                                42
           ©PENN, SCHOEN & BERLAND ASSOCIATES, LLC.
YOUNG AMERICANS LESS LIKELY TO VIEW AL
      QAEDA AND THE TALIBAN AS MAJOR THREATS
Please indicate whether each of                                                                     Political                       College
the following presents a major                      Gender                   Age                                        Income                         Race
                                                                                                   Affiliation                      Degree
threat, minor threat, or no threat
at all to long-term stability in the        All
United States.                                      M      F     18-29 30-44 45-64      65+   D        R         I    <$75k >$75k   No   Yes   White   AA         Hisp
Showing % Major threat
Rising national debt                        78     77      78     71    75         81   83    68       89        77    77    80     77   79     84      60        66
High government spending                    77     73      80     69    77         77   84    68       88        75    78    73     78   73     80      61        73
The budget deficit                          75     75      75     66    76         78   80    69       84        73    75    77     75   75     79      59        69
Rising healthcare costs                     73     69      76     64    75         75   76    78       71        70    73    71     71   76     74      68        67
Weakening U.S. dollar                       72     70      75     60    72         78   74    70       77        71    73    70     74   70     75      65        66
American jobs being sent overseas           71     71      72     54    71         80   76    77       72        67    72    70     73   69     76      67        59
America’s education system falling
                                            71     70      73     68    74         73   71    74       69        71    69    76     70   76     72      70        72
behind
Spread of nuclear weapons                   67     65      68     63    65         71   67    67       70        64    69    61     69   62     66      68        68
America’s dependence on foreign oil         66     65      67     56    68         72   65    66       72        62    65    69     64   72     70      55        55
Al Qaeda                                    58     53      63     43    56         64   70    61       68        50    60    57     58   59     61      51        57
Lack of high-paying jobs                    56     54      59     50    58         61   51    61       54        55    59    50     59   50     57      56        56
Domestic terrorists in the United
                                            56     49      63     49    57         60   57    56       63        52    59    48     59   51     57      60        54
States
Decline in moral values                     55     52      58     47    58         57   60    46       67        55    58    48     58   49     58      52        47
Taliban                                     53     47      59     39    52         59   60    54       62        45    55    49     55   47     54      54        52
Partisan politics and political gridlock    49     50      48     32    47         55   60    49       52        45    48    52     47   53     53      42        33
Rise of new global powers like China
                                            45     40      49     36    45         50   44    40       52        42    45    44     45   43     45      45        42
and India
Illegal immigrants                          44     45      42     29    39         49   60    35       57        41    47    36     48   36     49      35        18
Government of Iran                          44     44      45     28    43         51   55    41       53        41    46    41     45   42     47      38        45
Government of North Korea                   39     40      38     27    37         47   41    38       51        31    40    39     40   37     39      37        39
Hezbollah                                   27     33      21     17    25         32   35    23       36        22    27    28     26   28     29      22        23
Hamas                                       27     29      26     15    25         33   37    22       37        25    28    26     27   29     30      20        23
                                                                                                                                                             43
                      ©PENN, SCHOEN & BERLAND ASSOCIATES, LLC.
60% SAY THE COUNTRY IS ADDRESSING
             EXTERNAL THREATS AT LEAST SOMEWHAT
                         EFFECTIVELY
                               How effectively are we, as a country, addressing the threats that are
                                                     OUTSIDE our control?


                Very effectively                 Somewhat effectively                      Not very effectively                 Not at all effectively


              13%                                                   47%                                                   21%                     8%

                                                                                                                                       Showing All

                                                                                                                                  College
                                          Gender                         Age              Political Affiliation     Income                              Race
                                                                                                                                 Attainment
                                 All
                                         M        F     18-29   30-44      45-64    65+    D       R        I     <$75k >$75k     No      Yes   White   AA          Hisp

EFFECTIVELY
                                 60      60      61      65         61         61   52    64      56       60      61    58       61      59     57     69          68
(TOTAL)
Very effectively                 13      15      11      16         14         13   8      16      8       14      14    10       15       9     9       24         21
Somewhat effectively             47      45      50      49         47         48   44     48      48      46      47    48       46      50     48      45         47
NOT EFFECTIVELY
                                 29      33      27      23         28         30   40    26       36      28      29    33       27      34     33     18          23
(TOTAL)
Not very effectively             21      23      20      17         19         21   31     19      25      20      20    25       19      26     24      12         17
Not at all effectively            8      10       7       6         9          9    9      7       11      8       9      8       8        8     9       6           6
Don’t know                       10       8      12      12         11         10   7      10      8       11      10     8       12       7     10      13          9
                                                                                                                                                               44
                         ©PENN, SCHOEN & BERLAND ASSOCIATES, LLC.
THE MAJOR THREATS ARE WITHIN OUR
                CONTROL AS A COUNTRY
     •       African-Americans and Hispanics are the two sub-groups most likely to say
             that the threats affecting the long-term stability are mostly outside the
             country’s control
                                                           Which is closer to your view?


     The threats                                                                                                                       The threats
 affecting the long-                                                                                                               affecting the long-
                                                                                                                                  term stability of the
term stability of the                                                                           71% 20%                             U.S. are mostly
  U.S. are mostly
WITHIN our control                                                                                                                    OUTSIDE our
    as a country.                                                                                                                      control as a
                                                                                          Showing All                                    country.


                                                                                            Political                        College
                                       Gender                        Age                                        Income                           Race
                                                                                           Affiliation                      Attainment
                             All
                                      M       F     18-29      30-44   45-64    65+   D        R         I    <$75k >$75k   No    Yes    White   AA          Hisp
The threats affecting the
long-term stability of the
                             71      72      70       66        75         71   68    69       76        68    67    82     66     81     75      61         60
U.S. are mostly WITHIN
our control as a country.
The threats affecting the
long-term stability of the
                             20      20      19       24        17         19   21    22       17        20    22    13     22     15     16      26         28
U.S. are mostly OUTSIDE
our control as a country.
Don’t Know                    9       8       11      9         8          10   11    9        7         12    11     4     12     5      9       13         12
                                                                                                                                                        45
                    ©PENN, SCHOEN & BERLAND ASSOCIATES, LLC.
ONLY 10% THINK THAT INTERNAL THREATS
           ARE BEING ADDRESSED VERY EFFECTIVELY
      •      53% of respondents think that the country is not effectively addressing the
             threats that are within its control

                               How effectively are we, as a country, addressing the threats that are
                                                       WITHIN our control?

               Very effectively                    Somewhat effectively                  Not very effectively               Not at all effectively


           10%                                32%                                                 36%                                   17%

                                                                                                                                Showing All

How effectively are we, as a                                                              Political                         College
                                                    Gender               Age                                 Income                             Race
country, addressing the threats                                                          Affiliation                       Attainment
that are WITHIN our control?                 All
                                                    M     F   18-29 30-44 45-64 65+     D    R         I   <$75k   >$75k   No     Yes   White   AA      Hisp

EFFECTIVELY (TOTAL)                          42    39    43    46    41    41      36   54   33    39       44      36     45     35     36     61          51
Very effectively                             10     10    9    10    10        9   9    14   6     9        11      6      12      5     7       23         12
Somewhat effectively                         32     29   34    36    31    32      27   40   27    30       33      30     33     30     29      38         39
NOT EFFECTIVELY (TOTAL)                      53    56    49    45    54    53      60   40   64    53       50      62     48     63     59     30          39
Not very effectively                         36     35   36    34    36    34      41   31   43    34       35      40     33     42     39      23         28
Not at all effectively                       17     21   13     11   18    19      19   9    21    19       15      22     15     21     20      7          11
Don’t know                                   6      4     7     9    5         5   4    6    3     8        6       2      8       2     4       9          11
                                                                                                                                                       46
                         ©PENN, SCHOEN & BERLAND ASSOCIATES, LLC.
INTERNAL THREATS THAT NEED TO BE
            ADDRESSED MORE EFFECTIVELY
•    The economy, jobs, government spending, budget deficit, national debt,
     immigration, healthcare, and education are the primary threats within our
     control that Americans do not feel are being addressed effectively
           IF NOT EFFECTIVELY (N=1,040): What specific threats that are WITHIN our
                   control, are not being addressed effectively? OPEN-END


          * A word cloud is a visual representation of free-form text, with a larger font size
          indicating a greater number of respondents referenced the term in their response
                                                                                                 47
          ©PENN, SCHOEN & BERLAND ASSOCIATES, LLC.
MAJORITY THINKS THE COUNTRY IS
               GOING IN THE WRONG DIRECTION

              Generally speaking, would you say things in this country are heading in the right
                                   direction or in the wrong direction?


                          Right direction                                Wrong direction                          Don't know


                   28%                                                                  62%                                            10%


                                                                                                                            Showing All

                                                                                          Political                        College
                                     Gender                        Age                                        Income                           Race
                                                                                         Affiliation                      Attainment
                           All
                                    M       F     18-29      30-44   45-64    65+   D        R         I    <$75k >$75k   No    Yes    White   AA          Hisp

Right direction            28      28      29       34        32         25   21    48       10        26    28    30     28     29     21      55         36
Wrong direction            62      63      60       53        58         66   69    41       84        61    62    63     61     62     71      31         50
Don’t Know                 10       9       11      12        10         9    10    11       6         13    10     7     11     9      9       13         15


                                                                                                                                                      48
                  ©PENN, SCHOEN & BERLAND ASSOCIATES, LLC.
Time aspen ideas festival 2011 full report

Weitere ähnliche Inhalte

Was ist angesagt?

Public Opinion Landscape - State of the Union
Public Opinion Landscape -  State of the Union Public Opinion Landscape -  State of the Union
Public Opinion Landscape - State of the Union GloverParkGroup
 
Public opinion landscape state of the union - jan 20
Public opinion landscape   state of the union - jan 20Public opinion landscape   state of the union - jan 20
Public opinion landscape state of the union - jan 20GloverParkGroup
 
The Public Opinion Landscape - Energy and the Environment
The Public Opinion Landscape - Energy and the EnvironmentThe Public Opinion Landscape - Energy and the Environment
The Public Opinion Landscape - Energy and the EnvironmentGloverParkGroup
 
International Affairs Public Opinion Landscape
International Affairs Public Opinion Landscape     International Affairs Public Opinion Landscape
International Affairs Public Opinion Landscape GloverParkGroup
 
Public Opinion Landscape: Economy - 5.12.15
Public Opinion Landscape: Economy - 5.12.15Public Opinion Landscape: Economy - 5.12.15
Public Opinion Landscape: Economy - 5.12.15GloverParkGroup
 
Public Opinion Landscape - Health Care and the ACA
Public Opinion Landscape - Health Care and the ACAPublic Opinion Landscape - Health Care and the ACA
Public Opinion Landscape - Health Care and the ACAGloverParkGroup
 
Survey on Attitudes Towards the Economy
Survey on Attitudes Towards the EconomySurvey on Attitudes Towards the Economy
Survey on Attitudes Towards the EconomyBradleyHonan
 
National Israel-Hamas Conflict Poll- charts
National Israel-Hamas Conflict Poll- chartsNational Israel-Hamas Conflict Poll- charts
National Israel-Hamas Conflict Poll- chartsThe Israel Project
 
Retirement Derailers Research Report
Retirement Derailers Research ReportRetirement Derailers Research Report
Retirement Derailers Research ReportBrendan K. Maginnis
 
TIP National Voter Survey On Israel
TIP National Voter Survey On IsraelTIP National Voter Survey On Israel
TIP National Voter Survey On IsraelThe Israel Project
 
Indy politics informal survey for jan 2021
Indy politics informal survey for jan 2021Indy politics informal survey for jan 2021
Indy politics informal survey for jan 2021Abdul-Hakim Shabazz
 
The 2013 Atlantic/Aspen Institute Annual American Values Survey: One Nation, ...
The 2013 Atlantic/Aspen Institute Annual American Values Survey: One Nation, ...The 2013 Atlantic/Aspen Institute Annual American Values Survey: One Nation, ...
The 2013 Atlantic/Aspen Institute Annual American Values Survey: One Nation, ...Burson-Marsteller
 
The Atlantic/Aspen Institute Survey 2015: The American Dream - Abbreviated
The Atlantic/Aspen Institute Survey 2015: The American Dream - Abbreviated The Atlantic/Aspen Institute Survey 2015: The American Dream - Abbreviated
The Atlantic/Aspen Institute Survey 2015: The American Dream - Abbreviated Burson-Marsteller
 
Gpg 2012 Post Election
Gpg 2012 Post ElectionGpg 2012 Post Election
Gpg 2012 Post ElectionBKWLD
 
Oct. 2014 civil beat poll full results
Oct. 2014 civil beat poll full resultsOct. 2014 civil beat poll full results
Oct. 2014 civil beat poll full resultsHonolulu Civil Beat
 
Public Opinion Landscape - Foreign Policy - October 22
Public Opinion Landscape - Foreign Policy - October 22Public Opinion Landscape - Foreign Policy - October 22
Public Opinion Landscape - Foreign Policy - October 22GloverParkGroup
 
Enroll America's Uninsured Landscape Findings for 2015
Enroll America's Uninsured Landscape Findings for 2015Enroll America's Uninsured Landscape Findings for 2015
Enroll America's Uninsured Landscape Findings for 2015Enroll America
 
Public Opinion Landscape Political - October 25, 2012
Public Opinion Landscape  Political - October 25, 2012Public Opinion Landscape  Political - October 25, 2012
Public Opinion Landscape Political - October 25, 2012GloverParkGroup
 
American Public Opinion Landscape – International Affairs
American Public Opinion Landscape – International AffairsAmerican Public Opinion Landscape – International Affairs
American Public Opinion Landscape – International AffairsGloverParkGroup
 

Was ist angesagt? (20)

Public Opinion Landscape - State of the Union
Public Opinion Landscape -  State of the Union Public Opinion Landscape -  State of the Union
Public Opinion Landscape - State of the Union
 
Public opinion landscape state of the union - jan 20
Public opinion landscape   state of the union - jan 20Public opinion landscape   state of the union - jan 20
Public opinion landscape state of the union - jan 20
 
The Public Opinion Landscape - Energy and the Environment
The Public Opinion Landscape - Energy and the EnvironmentThe Public Opinion Landscape - Energy and the Environment
The Public Opinion Landscape - Energy and the Environment
 
International Affairs Public Opinion Landscape
International Affairs Public Opinion Landscape     International Affairs Public Opinion Landscape
International Affairs Public Opinion Landscape
 
Public Opinion Landscape: Economy - 5.12.15
Public Opinion Landscape: Economy - 5.12.15Public Opinion Landscape: Economy - 5.12.15
Public Opinion Landscape: Economy - 5.12.15
 
Public Opinion Landscape - Health Care and the ACA
Public Opinion Landscape - Health Care and the ACAPublic Opinion Landscape - Health Care and the ACA
Public Opinion Landscape - Health Care and the ACA
 
Survey on Attitudes Towards the Economy
Survey on Attitudes Towards the EconomySurvey on Attitudes Towards the Economy
Survey on Attitudes Towards the Economy
 
National Israel-Hamas Conflict Poll- charts
National Israel-Hamas Conflict Poll- chartsNational Israel-Hamas Conflict Poll- charts
National Israel-Hamas Conflict Poll- charts
 
Retirement Derailers Research Report
Retirement Derailers Research ReportRetirement Derailers Research Report
Retirement Derailers Research Report
 
TIP National Voter Survey On Israel
TIP National Voter Survey On IsraelTIP National Voter Survey On Israel
TIP National Voter Survey On Israel
 
Fiscal survey presentation
Fiscal survey presentationFiscal survey presentation
Fiscal survey presentation
 
Indy politics informal survey for jan 2021
Indy politics informal survey for jan 2021Indy politics informal survey for jan 2021
Indy politics informal survey for jan 2021
 
The 2013 Atlantic/Aspen Institute Annual American Values Survey: One Nation, ...
The 2013 Atlantic/Aspen Institute Annual American Values Survey: One Nation, ...The 2013 Atlantic/Aspen Institute Annual American Values Survey: One Nation, ...
The 2013 Atlantic/Aspen Institute Annual American Values Survey: One Nation, ...
 
The Atlantic/Aspen Institute Survey 2015: The American Dream - Abbreviated
The Atlantic/Aspen Institute Survey 2015: The American Dream - Abbreviated The Atlantic/Aspen Institute Survey 2015: The American Dream - Abbreviated
The Atlantic/Aspen Institute Survey 2015: The American Dream - Abbreviated
 
Gpg 2012 Post Election
Gpg 2012 Post ElectionGpg 2012 Post Election
Gpg 2012 Post Election
 
Oct. 2014 civil beat poll full results
Oct. 2014 civil beat poll full resultsOct. 2014 civil beat poll full results
Oct. 2014 civil beat poll full results
 
Public Opinion Landscape - Foreign Policy - October 22
Public Opinion Landscape - Foreign Policy - October 22Public Opinion Landscape - Foreign Policy - October 22
Public Opinion Landscape - Foreign Policy - October 22
 
Enroll America's Uninsured Landscape Findings for 2015
Enroll America's Uninsured Landscape Findings for 2015Enroll America's Uninsured Landscape Findings for 2015
Enroll America's Uninsured Landscape Findings for 2015
 
Public Opinion Landscape Political - October 25, 2012
Public Opinion Landscape  Political - October 25, 2012Public Opinion Landscape  Political - October 25, 2012
Public Opinion Landscape Political - October 25, 2012
 
American Public Opinion Landscape – International Affairs
American Public Opinion Landscape – International AffairsAmerican Public Opinion Landscape – International Affairs
American Public Opinion Landscape – International Affairs
 

Ähnlich wie Time aspen ideas festival 2011 full report

Civility in America 2014 FINAL
Civility in America 2014 FINALCivility in America 2014 FINAL
Civility in America 2014 FINALBradley Honan
 
Voices of a New Generation - Insights on the Gen Z Mindset
Voices of a New Generation - Insights on the Gen Z MindsetVoices of a New Generation - Insights on the Gen Z Mindset
Voices of a New Generation - Insights on the Gen Z MindsetOlogie
 
Appendix for USHMM
Appendix for USHMMAppendix for USHMM
Appendix for USHMMproofic
 
A millennials guide to homeownership
A millennials guide to homeownershipA millennials guide to homeownership
A millennials guide to homeownershipBrockHarris7
 
A Millennial’s Guide to Homeownership | KM Realty Group Chicago, IL
A Millennial’s Guide to Homeownership | KM Realty Group Chicago, ILA Millennial’s Guide to Homeownership | KM Realty Group Chicago, IL
A Millennial’s Guide to Homeownership | KM Realty Group Chicago, ILTammy Jackson
 
A Millennial’s Guide to Homeownership
      A Millennial’s Guide to Homeownership      A Millennial’s Guide to Homeownership
A Millennial’s Guide to HomeownershipRoger Owens
 
Reuters/Ipsos Data: Core Political (04/03/2019)
Reuters/Ipsos Data: Core Political (04/03/2019)Reuters/Ipsos Data: Core Political (04/03/2019)
Reuters/Ipsos Data: Core Political (04/03/2019)Ipsos Public Affairs
 
Reuters/Ipsos Data: Core Political (02/20/2019)
Reuters/Ipsos Data: Core Political (02/20/2019)Reuters/Ipsos Data: Core Political (02/20/2019)
Reuters/Ipsos Data: Core Political (02/20/2019)Ipsos Public Affairs
 
Reuters/Ipsos Data: Core Political (01/30/2019)
Reuters/Ipsos Data: Core Political (01/30/2019)Reuters/Ipsos Data: Core Political (01/30/2019)
Reuters/Ipsos Data: Core Political (01/30/2019)Ipsos Public Affairs
 
Reuters/Ipsos Data: Core Political (03/06/2019)
Reuters/Ipsos Data: Core Political (03/06/2019)Reuters/Ipsos Data: Core Political (03/06/2019)
Reuters/Ipsos Data: Core Political (03/06/2019)Ipsos Public Affairs
 
Reuters/Ipsos Data: Core Political (03/20/2019)
Reuters/Ipsos Data: Core Political (03/20/2019)Reuters/Ipsos Data: Core Political (03/20/2019)
Reuters/Ipsos Data: Core Political (03/20/2019)Ipsos Public Affairs
 
Central_social info
Central_social infoCentral_social info
Central_social infoandy biggin
 
Reuters/Ipsos Data: Core Political (04/17/2019)
Reuters/Ipsos Data: Core Political (04/17/2019)Reuters/Ipsos Data: Core Political (04/17/2019)
Reuters/Ipsos Data: Core Political (04/17/2019)Ipsos Public Affairs
 
2013 Opportunity Index Briefing Book
2013 Opportunity Index Briefing Book2013 Opportunity Index Briefing Book
2013 Opportunity Index Briefing BookOpportunityNation
 
Reuters/Ipsos Data: Core Political (01/09/2018)
Reuters/Ipsos Data: Core Political (01/09/2018)Reuters/Ipsos Data: Core Political (01/09/2018)
Reuters/Ipsos Data: Core Political (01/09/2018)Ipsos Public Affairs
 
Reuters/Ipsos Core Political Survey: Presidential Approval Tracker (07/24/2019)
Reuters/Ipsos Core Political Survey: Presidential Approval Tracker (07/24/2019) Reuters/Ipsos Core Political Survey: Presidential Approval Tracker (07/24/2019)
Reuters/Ipsos Core Political Survey: Presidential Approval Tracker (07/24/2019) Ipsos Public Affairs
 
Reuters/Ipsos Data: Core Political (02/13/2019)
Reuters/Ipsos Data: Core Political (02/13/2019)Reuters/Ipsos Data: Core Political (02/13/2019)
Reuters/Ipsos Data: Core Political (02/13/2019)Ipsos Public Affairs
 

Ähnlich wie Time aspen ideas festival 2011 full report (20)

American Values Survey
American Values SurveyAmerican Values Survey
American Values Survey
 
Civility in America 2014 FINAL
Civility in America 2014 FINALCivility in America 2014 FINAL
Civility in America 2014 FINAL
 
Voices of a New Generation - Insights on the Gen Z Mindset
Voices of a New Generation - Insights on the Gen Z MindsetVoices of a New Generation - Insights on the Gen Z Mindset
Voices of a New Generation - Insights on the Gen Z Mindset
 
Young Australians
Young AustraliansYoung Australians
Young Australians
 
Millenniale guide
Millenniale guideMillenniale guide
Millenniale guide
 
Appendix for USHMM
Appendix for USHMMAppendix for USHMM
Appendix for USHMM
 
A millennials guide to homeownership
A millennials guide to homeownershipA millennials guide to homeownership
A millennials guide to homeownership
 
A Millennial’s Guide to Homeownership | KM Realty Group Chicago, IL
A Millennial’s Guide to Homeownership | KM Realty Group Chicago, ILA Millennial’s Guide to Homeownership | KM Realty Group Chicago, IL
A Millennial’s Guide to Homeownership | KM Realty Group Chicago, IL
 
A Millennial’s Guide to Homeownership
      A Millennial’s Guide to Homeownership      A Millennial’s Guide to Homeownership
A Millennial’s Guide to Homeownership
 
Reuters/Ipsos Data: Core Political (04/03/2019)
Reuters/Ipsos Data: Core Political (04/03/2019)Reuters/Ipsos Data: Core Political (04/03/2019)
Reuters/Ipsos Data: Core Political (04/03/2019)
 
Reuters/Ipsos Data: Core Political (02/20/2019)
Reuters/Ipsos Data: Core Political (02/20/2019)Reuters/Ipsos Data: Core Political (02/20/2019)
Reuters/Ipsos Data: Core Political (02/20/2019)
 
Reuters/Ipsos Data: Core Political (01/30/2019)
Reuters/Ipsos Data: Core Political (01/30/2019)Reuters/Ipsos Data: Core Political (01/30/2019)
Reuters/Ipsos Data: Core Political (01/30/2019)
 
Reuters/Ipsos Data: Core Political (03/06/2019)
Reuters/Ipsos Data: Core Political (03/06/2019)Reuters/Ipsos Data: Core Political (03/06/2019)
Reuters/Ipsos Data: Core Political (03/06/2019)
 
Reuters/Ipsos Data: Core Political (03/20/2019)
Reuters/Ipsos Data: Core Political (03/20/2019)Reuters/Ipsos Data: Core Political (03/20/2019)
Reuters/Ipsos Data: Core Political (03/20/2019)
 
Central_social info
Central_social infoCentral_social info
Central_social info
 
Reuters/Ipsos Data: Core Political (04/17/2019)
Reuters/Ipsos Data: Core Political (04/17/2019)Reuters/Ipsos Data: Core Political (04/17/2019)
Reuters/Ipsos Data: Core Political (04/17/2019)
 
2013 Opportunity Index Briefing Book
2013 Opportunity Index Briefing Book2013 Opportunity Index Briefing Book
2013 Opportunity Index Briefing Book
 
Reuters/Ipsos Data: Core Political (01/09/2018)
Reuters/Ipsos Data: Core Political (01/09/2018)Reuters/Ipsos Data: Core Political (01/09/2018)
Reuters/Ipsos Data: Core Political (01/09/2018)
 
Reuters/Ipsos Core Political Survey: Presidential Approval Tracker (07/24/2019)
Reuters/Ipsos Core Political Survey: Presidential Approval Tracker (07/24/2019) Reuters/Ipsos Core Political Survey: Presidential Approval Tracker (07/24/2019)
Reuters/Ipsos Core Political Survey: Presidential Approval Tracker (07/24/2019)
 
Reuters/Ipsos Data: Core Political (02/13/2019)
Reuters/Ipsos Data: Core Political (02/13/2019)Reuters/Ipsos Data: Core Political (02/13/2019)
Reuters/Ipsos Data: Core Political (02/13/2019)
 

Time aspen ideas festival 2011 full report

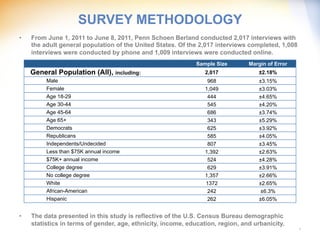
  • 1. SURVEY METHODOLOGY •  From June 1, 2011 to June 8, 2011, Penn Schoen Berland conducted 2,017 interviews with the adult general population of the United States. Of the 2,017 interviews completed, 1,008 interviews were conducted by phone and 1,009 interviews were conducted online. Sample Size Margin of Error General Population (All), including: 2,017 ±2.18% Male 968 ±3.15% Female 1,049 ±3.03% Age 18-29 444 ±4.65% Age 30-44 545 ±4.20% Age 45-64 686 ±3.74% Age 65+ 343 ±5.29% Democrats 625 ±3.92% Republicans 585 ±4.05% Independents/Undecided 807 ±3.45% Less than $75K annual income 1,392 ±2.63% $75K+ annual income 524 ±4.28% College degree 629 ±3.91% No college degree 1,357 ±2.66% White 1372 ±2.65% African-American 242 ±6.3% Hispanic 262 ±6.05% •  The data presented in this study is reflective of the U.S. Census Bureau demographic statistics in terms of gender, age, ethnicity, income, education, region, and urbanicity. 1
  • 2. KEY FINDINGS The Decade’s Defining Moment: September 11, 2001 •  41% of respondents cite September 11, 2001 as the single most important event of the past decade •  63% of Americans think that the events of 9/11 weakened the U.S. and only 6% believe that the country has completely recovered from the events of 9/11 •  71% are satisfied with the government’s response to September 11, 2001 (23% not satisfied) and 41% say the government could have taken additional actions to respond to the events (35% say no additional actions should have been taken) A Decade of Decline •  68% of respondents think the past decade has been one of decline for the United States as a country, while only 23% believe the U.S. has progressed as a country in the past 10 years •  71% of Americans believe that the U.S. is in a worse position today than it was a decade ago, while only 11% think the country is in a better position •  47% say the past decade was one of the worst decades in the past century, 32% say it was about the same as other decades in the past century, while only 13% believe it was one of the best Americans Blame their Political Leaders, not Terrorists, for the Decline •  Among the 71% of respondents who think the country is in a worse position, there is a clear consensus that their leaders are most to blame: 23% most blame the Bush Administration, 20% blame the Obama Administration, and 16% cite the U.S. Congress •  Only 7% of the American people who think the U.S. is now in a worse position than a decade ago believe that terrorist groups are most to blame for it 2 ©PENN, SCHOEN & BERLAND ASSOCIATES, LLC.
  • 3. KEY FINDINGS (CONTINUED) The Enemy is Within: Economic Issues are Paramount •  66% think the greatest threats to long-term stability in the United States come primarily from within the United States, not from outside (27%) •  75% say that economic concerns present a greater threat to the current stability of the U.S. than national security concerns – only 18% think the reverse is more accurate •  Only 10% of Americans think that these internal threats are being addressed very effectively (another 32% say somewhat effectively, but 53% say not effectively) •  62% of respondents think that the U.S. is too involved in international affairs (10% say that it is not involved enough) and 83% say the U.S. needs to focus on domestic, not international, issues in the next decade – only 12% say the focus should be international A Major Terrorist Attack is Likely in the Next Decade •  78% say it is likely that a major terrorist attack will take place in the U.S. in the next decade (35% say very likely and 43% say somewhat likely) •  49% of respondents are concerned that they will become a victim of terrorism in the next decade (versus 48% who say they are not concerned about the possibility) •  41% of Americans think that the killing of bin Laden has increased the threat of terrorism against the U.S. (19% say it has decreased the threat) and only 31% say the killing of bin Laden gives them a sense of closure (56% say the killing does not give them closure) Time to Leave Afghanistan; Democratic Elections in Middle East Perceived to Have Little Impact on U.S. National Interests •  2 in 5 Americans think that President Obama’s timeline to end U.S. combat operations in Afghanistan by 2014 is too slow, 38% think it is about right, while 10% perceive the timeline as too fast •  Fewer than 3 in 10 Americans expect that the new governments in Tunisia and Egypt will be friendlier towards the U.S. or will work to reduce terrorism, while the rest expect no change (1 in 3) or a turn for the worse (1 in 5) 3 ©PENN, SCHOEN & BERLAND ASSOCIATES, LLC.
  • 4. THE DECADE’S DEFINING MOMENT: SEPTEMBER 11, 2001 NEW YORK • WASHINGTON • DENVER • SEATTLE • LOS ANGELES • SAN FRANCISCO • AUSTIN• LONDON • HONG KONG • BEIJING • DUBAI 4 ©PENN, SCHOEN & BERLAND ASSOCIATES, LLC.
  • 5. THE DECADE’S DEFINING MOMENT: SEPTEMBER 11, 2001 What was the single most important EVENT in the past decade? OPEN-END September 11, 2001 41% Election of Barack Obama 9% Economic recession 7% Death of Osama bin Laden 5% War in Iraq 3% The war on terror 3% Housing market crash 2% Passage of the Healthcare bill 1% Reelection of George W. Bush 1% Other 15% Don’t know 13% Showing All 5 ©PENN, SCHOEN & BERLAND ASSOCIATES, LLC.
  • 6. 9/11 IS SEEN AS THE MOST IMPORTANT EVENT OF THE DECADE BY EVERY SUB-GROUP What was the College Political single most Gender Age Income Attainme Race Affiliation important EVENT nt in the past All decade? OPEN- M F 18-29 30-44 45-64 65+ D R I <$75k>$75k No Yes White AA Hisp END September 11, 2001 41 40 41 46 45 39 31 36 46 41 38 46 38 48 43 27 39 Election of Barack 9 9 9 7 8 11 8 15 4 8 9 9 9 8 7 24 9 Obama Economic recession 7 8 7 7 5 9 8 7 8 7 6 9 7 7 8 7 6 Death of Osama bin 5 4 6 6 6 4 5 5 4 6 6 4 5 4 5 5 8 Laden The war on terror 3 2 4 3 4 3 3 2 4 3 3 3 3 4 3 4 4 War in Iraq 3 2 3 3 3 2 3 3 2 2 3 3 3 2 3 3 2 Housing market crash 2 2 2 2 1 3 2 1 2 2 2 3 2 2 2 0 2 Reelection of George 1 0 1 0 0 1 0 1 0 0 0 1 1 0 0 0 1 W. Bush Passage of the 1 1 1 0 0 1 1 1 0 1 1 1 1 1 1 0 0 Healthcare bill Others 15 16 13 11 15 15 18 14 14 16 15 15 15 14 14 15 17 Don't Know 13 14 13 15 12 10 20 14 14 13 16 8 15 9 14 14 12 6 ©PENN, SCHOEN & BERLAND ASSOCIATES, LLC.
  • 7. 63% THINK THE EVENTS OF 9/11 AT LEAST SOMEWHAT WEAKENED THE UNITED STATES To what extent did the events of 9/11 weaken the U.S.? A great deal Somewhat Not very much Not at all 22% 41% 18% 12% Showing All College Gender Age Political Affiliation Income Race Attainment All M F 18-29 30-44 45-64 65+ D R I <$75k >$75k No Yes White AA Hisp WEAKEN (TOTAL) 63 57 67 63 62 62 64 65 61 62 65 59 63 62 61 63 69 A great deal 22 20 23 19 22 24 18 25 17 22 23 20 23 19 18 29 34 Somewhat 41 37 44 44 40 38 46 40 44 40 42 39 40 43 43 34 35 NOT WEAKEN 30 37 24 28 31 32 31 29 34 28 29 38 29 34 32 28 23 (TOTAL) Not very much 18 22 14 19 19 17 19 16 20 18 18 20 18 19 19 15 15 Not at all 12 15 10 9 12 15 12 13 14 10 11 18 11 15 13 13 8 Don’t know 7 5 9 10 7 7 4 6 5 10 7 4 8 4 6 8 9 7 ©PENN, SCHOEN & BERLAND ASSOCIATES, LLC.
  • 8. MAJORITY SAYS 9/11 HAS HAD A MOSTLY NEGATIVE LONG-TERM IMPACT •  However, 3 in 10 Americans believe that the long-term impact of 9/11 has been mostly positive on the United States Looking back on the events of 9/11, would you say that their long-term impact on the United States was… Mostly positive Mostly negative Don't Know 30% 56% 14% Showing All College Gender Age Political Affiliation Income Race Attainment All M F 18-29 30-44 45-64 65+ D R I <$75k >$75k No Yes White AA Hisp Mostly positive 30 33 27 28 29 31 32 30 34 27 30 29 30 29 31 35 21 Mostly negative 56 54 58 58 59 52 57 54 54 59 54 61 54 60 55 49 59 Don’t know 14 13 15 14 12 17 12 16 12 14 16 10 16 10 14 16 20 8 ©PENN, SCHOEN & BERLAND ASSOCIATES, LLC.
  • 9. ONLY 6% BELIEVE THE COUNTRY HAS RECOVERED FROM 9/11 COMPLETELY •  Republicans are more likely than Democrats or Independents to think that the U.S. has recovered from the events of 9/11 To what extent do you think that the United States has recovered from the events of 9/11? Completely Mostly A little Not at all 6% 51% 33% 5% Showing All College Gender Age Political Affiliation Income Race Attainment All M F 18-29 30-44 45-64 65+ D R I <$75k >$75k No Yes White AA Hisp RECOVERED 57 59 55 58 56 55 57 57 63 51 55 59 56 59 58 51 53 (TOTAL) Completely 6 7 5 8 4 6 4 6 5 6 5 7 6 6 5 10 6 Mostly 51 52 50 50 52 49 53 51 58 45 50 52 50 53 53 41 47 NOT RECOVERED 38 37 40 35 39 40 41 39 33 42 39 40 39 39 37 42 43 (TOTAL) A little 33 31 35 28 34 35 36 33 30 35 34 33 34 33 32 36 37 Not at all 5 6 5 7 5 5 5 6 3 7 5 7 5 6 5 6 6 Don’t know 5 5 6 7 6 5 2 3 4 8 5 2 5 2 5 8 4 9 ©PENN, SCHOEN & BERLAND ASSOCIATES, LLC.
  • 10. 7 IN 10 ARE AT LEAST SOMEWHAT SATISFIED WITH THE GOVERNMENT’S RESPONSE TO 9/11 •  Younger Americans (18-29) and Independents are least likely to be satisfied with the response Looking back, how satisfied are you with the government’s response to 9/11? Very satisfied Somewhat satisfied Not very satisfied Not at all satisfied 25% 46% 15% 8% Showing All College Gender Age Political Affiliation Income Race Attainment All M F 18-29 30-44 45-64 65+ D R I <$75k >$75k No Yes White AA Hisp SATISFIED 71 72 71 64 69 75 79 71 83 62 71 75 70 74 73 66 67 (TOTAL) Very satisfied 25 27 24 19 26 29 26 24 35 19 27 23 26 24 26 26 26 Somewhat satisfied 46 45 47 45 43 46 53 47 48 43 44 52 44 50 47 40 41 NOT SATISFIED 23 23 22 25 26 21 18 23 12 29 23 22 22 24 20 25 25 (TOTAL) Not very satisfied 15 15 15 16 17 13 13 15 9 18 16 12 15 14 13 16 16 Not at all satisfied 8 8 7 9 9 8 5 8 3 11 7 10 7 10 7 9 9 Don’t know 6 6 7 11 6 5 4 6 4 9 6 3 8 2 6 9 8 10 ©PENN, SCHOEN & BERLAND ASSOCIATES, LLC.
  • 11. 27% THINK THE U.S. HAS NOT SPENT ENOUGH MONEY TO PROTECT ITSELF FROM TERRORISM •  Independents are more likely than Democrats or Republicans to say the U.S. has spent too much money securing the country from terrorism Do you think the U.S. has spent too much money securing the country from terrorism, not enough, or just the right amount of money? Too much 38% money Not enough 27% 14% Just the right 21% amount Don't know Showing All College Gender Age Political Affiliation Income Race Attainment All M F 18-29 30-44 45-64 65+ D R I <$75k >$75k No Yes White AA Hisp Too much money 21 23 20 25 25 18 17 19 16 27 22 20 20 26 21 19 23 Not enough 27 28 26 16 24 33 30 23 35 23 27 28 28 24 28 29 24 Just the right amount 38 37 39 44 39 34 38 45 37 34 37 42 38 40 38 37 39 Don’t know 14 13 15 15 12 14 15 12 12 16 14 10 14 11 14 15 14 11 ©PENN, SCHOEN & BERLAND ASSOCIATES, LLC.
  • 12. MOST THINK THAT THE GOVERNMENT’S RESPONSE DOMESTICALLY WAS JUSTIFIED •  Independents, young Americans (18-29), and those with a college degree are less likely than other sub-groups to be satisfied with the domestic response Do you think the government’s response to 9/11 within the United States, including the Patriot Act, enhanced security at airports, and the creation of the Department of Homeland Security went too far and encroached on American civil liberties or was the response justified as a means of protecting American citizens? Went too far Justified Don't Know 26% 62% 12% Showing All College Gender Age Political Affiliation Income Race Attainment All M F 18-29 30-44 45-64 65+ D R I <$75k >$75k No Yes White AA Hisp Went too far 26 31 22 30 29 23 24 24 21 32 26 28 24 33 26 20 30 Justified 62 60 64 52 59 68 69 65 71 53 62 66 63 62 63 64 57 Don’t know 12 9 14 19 12 9 7 11 8 15 12 7 13 6 10 16 13 12 ©PENN, SCHOEN & BERLAND ASSOCIATES, LLC.
  • 13. PLURALITY SAYS THE GOVERNMENT SHOULD HAVE TAKEN ADDITIONAL ACTIONS AFTER 9/11 •  Men, Hispanics, and those with an annual income exceeding $75,000 are the three sub-groups most likely to say that the government should have taken additional actions Thinking about the government’s response to 9/11, were there additional actions that you think SHOULD HAVE been taken? Yes No Don't Know 41% 35% 24% Showing All Political College Gender Age Income Race Affiliation Attainment All M F 18-29 30-44 45-64 65+ D R I <$75k >$75k No Yes White AA Hisp Yes 41 46 37 38 45 42 37 41 37 44 40 46 41 43 39 45 46 No 35 34 36 39 35 33 34 34 40 32 35 37 34 37 36 32 32 Don’t know 24 20 27 23 19 25 29 25 22 24 25 17 25 20 24 23 22 13 ©PENN, SCHOEN & BERLAND ASSOCIATES, LLC.
  • 14. ADDITIONAL ACTIONS THAT SHOULD HAVE BEEN TAKEN AFTER 9/11 IF ADDITIONAL ACTIONS (N=831): What actions should have been taken? OPEN-END More aggressive/rapid response 19% Should have gone after the right people 12% Better transportation and border security 11% More intelligence 5% Taken warnings more seriously 5% Just did not like the way the govt. handled things 4% Should not have rushed to war so fast 3% More for families of the victims 3% Cut ties to countries that harbor terrorists 2% The government did a good job 2% More international diplomacy 2% Earlier/quicker investigation 2% The government should have told the truth 1% Less political correctness 1% Focused more on the U.S. 1% Other 16% Don't know 13% 14 ©PENN, SCHOEN & BERLAND ASSOCIATES, LLC.
  • 15. 1 IN 4 SAYS SOME OF THE U.S. ACTIONS AFTER 9/11 SHOULD NOT HAVE BEEN TAKEN •  Democrats, those with a higher level of income, and those respondents with a college degree are more likely than other sub-groups to say that some actions that were taken should not have been taken as a response to 9/11 Thinking about the government’s response to 9/11, did the government take actions that you think should NOT have been taken? Yes No Don't Know 26% 55% 19% Showing All College Gender Age Political Affiliation Income Race Attainment All M F 18-29 30-44 45-64 65+ D R I <$75k >$75k No Yes White AA Hisp Yes 26 29 23 26 30 27 18 31 17 29 24 34 22 34 25 30 25 No 55 54 56 51 54 55 63 48 69 51 56 54 57 53 57 50 53 Don’t know 19 16 21 23 16 18 20 21 14 20 20 12 21 13 18 20 23 15 ©PENN, SCHOEN & BERLAND ASSOCIATES, LLC.
  • 16. ACTIONS THAT SHOULD NOT HAVE BEEN TAKEN IN RESPONSE TO 9/11 •  Those who say the U.S. should not have taken certain actions following 9/11 primarily cite the invasion of Iraq IF ACTIONS SHOULD NOT HAVE BEEN TAKEN (N=526): What actions should not have been taken? OPEN-END * A word cloud is a visual representation of free-form text, with a larger font size indicating a greater number of respondents referenced the term in their response 16 ©PENN, SCHOEN & BERLAND ASSOCIATES, LLC.
  • 17. 2 IN 5 SAY THEIR DAILY LIVES ARE STILL AFFECTED BY THE EVENTS OF 9/11 •  Hispanics are most likely to say that the events of 9/11 still affect their daily lives, while those respondents age 18-29 are least likely to say they feel the effect of the events on a daily basis Did the events of 9/11 change your life in ways that still affect your day-to-day life? Yes No Don't Know 39% 55% 6% Showing All College Gender Age Political Affiliation Income Race Attainment All M F 18-29 30-44 45-64 65+ D R I <$75k >$75k No Yes White AA Hisp Yes 39 37 40 34 43 40 36 39 41 37 37 45 38 41 36 45 48 No 55 56 54 58 52 52 61 54 55 56 55 52 55 54 59 44 43 Don’t know 6 7 6 8 5 8 3 7 4 7 7 3 7 4 5 12 9 17 ©PENN, SCHOEN & BERLAND ASSOCIATES, LLC.
  • 18. WAYS 9/11 STILL AFFECTS PEOPLE’S DAILY LIVES TODAY •  Increased caution while traveling and dealing with enhanced airport security are the primary ways Americans say their life is still affected by 9/11 IF STILL AFFECTED (N=783): In what ways? OPEN-END * A word cloud is a visual representation of free-form text, with a larger font size indicating a greater number of respondents referenced the term in their response 18 ©PENN, SCHOEN & BERLAND ASSOCIATES, LLC.
  • 19. 4 IN 5 THINK THE COUNTRY FELT MORE VULNERABLE THAN EVER AFTER 9/11 After the events of 9/11 do you think the country went through an emotional change– do you think the U.S. felt more vulnerable than ever to a potential attack or did the events of 9/11 not really change the country emotionally? The U.S. felt more vulnerable than ever to a potential attack Did not really change the country emotionally Don't Know 81% 12% 7% Showing All College Gender Age Political Affiliation Income Race Attainment All M F 18-29 30-44 45-64 65+ D R I <$75k >$75k No Yes White AA Hisp The U.S. felt more vulnerable than ever 81 80 82 76 81 84 84 82 83 80 80 85 79 85 84 74 80 to a potential attack Did not really change the country 12 12 11 14 12 10 12 11 12 12 12 10 12 10 10 16 12 emotionally Don’t know 7 7 6 9 7 7 4 7 5 8 7 5 8 4 6 10 9 19 ©PENN, SCHOEN & BERLAND ASSOCIATES, LLC.
  • 20. THE EVENTS OF 9/11 MOSTLY UNITED AMERICANS •  Hispanics are more likely than white Americans or African-Americans to say that the impact of the 9/11 events has been mostly divisive on Americans Looking back on the events of 9/11, would you say that their impact has mostly divided Americans or mostly united them? Mostly united Mostly divided Don't Know 71% 19% 10% Showing All College Gender Age Political Affiliation Income Race Attainment All M F 18-29 30-44 45-64 65+ D R I <$75k >$75k No Yes White AA Hisp Mostly united 71 71 71 63 69 75 78 73 75 66 70 74 71 70 73 70 62 Mostly divided 19 20 18 25 21 16 15 19 16 22 18 21 17 24 18 18 25 Don’t know 10 9 11 13 10 9 7 8 9 12 12 5 12 6 9 13 13 20 ©PENN, SCHOEN & BERLAND ASSOCIATES, LLC.
  • 21. MOST THINK AMERICANS ARE WORKING TOGETHER MORE SINCE 9/11 •  Independents are less likely than Republicans and Democrats to say that Americans are working together more since 9/11 Since the events of 9/11, do you think Americans are working together more to achieve common objectives, or are they working against each other more? Working together Working against each other Don't Know 57% 27% 16% Showing All College Gender Age Political Affiliation Income Race Attainment All M F 18-29 30-44 45-64 65+ D R I <$75k >$75k No Yes White AA Hisp Working together 57 53 61 56 56 60 56 67 59 48 58 55 60 50 55 64 63 Working against 27 31 23 30 27 25 25 22 24 32 25 33 23 35 28 23 22 each other Don’t know 16 16 16 14 17 15 19 11 17 19 17 12 17 15 17 13 16 21 ©PENN, SCHOEN & BERLAND ASSOCIATES, LLC.
  • 22. A NECESSARY CONVERSATION ABOUT ALLEGIANCE OR MORE INTOLERANCE? •  Republicans, respondents age 65+, and men are more likely to say that 9/11 led to a necessary conversation, while young Americans (18-29), Democrats, and minorities are more likely to say it raised intolerance towards minorities Which is closer to your view? The events of 9/11 led to a necessary The events of 9/11 conversation senselessly about the raised intolerance allegiance to the 48% 37% toward minorities United States of living in the certain groups of United States. people. Showing All Political College Gender Age Income Race Affiliation Attainment All M F 18-29 30-44 45-64 65+ D R I <$75k >$75k No Yes White AA Hisp Necessary conversation about the allegiance to the 48 52 44 40 45 50 57 37 66 43 47 52 46 51 51 38 40 United States Senselessly raised intolerance toward 37 35 39 44 38 36 27 48 22 38 36 38 36 38 35 41 43 minorities Don’t Know 15 14 17 15 17 14 15 14 12 19 17 10 18 11 14 21 17 22 ©PENN, SCHOEN & BERLAND ASSOCIATES, LLC.
  • 23. 2 IN 5 SAY AMERICANS HAVE BECOME MORE TOLERANT OVER THE PAST DECADE Do you generally think that Americans are more tolerant today of other people, less tolerant, or are they about as tolerant of other people as they were a decade ago? More tolerant 29% Less tolerant 28% 39% About the same 4% Don't know Showing All College Gender Age Political Affiliation Income Race Attainment All M F 18-29 30-44 45-64 65+ D R I <$75k >$75k No Yes White AA Hisp More tolerant 39 39 39 36 42 40 35 39 42 36 37 42 38 40 38 41 41 Less tolerant 29 28 30 30 29 30 27 33 23 31 31 25 30 28 28 27 35 About the same 28 29 27 28 25 27 33 24 31 28 27 31 27 29 29 28 20 Don’t know 4 4 4 6 4 3 5 4 4 5 4 2 5 3 4 4 4 23 ©PENN, SCHOEN & BERLAND ASSOCIATES, LLC.
  • 24. SOME SAY AMERICANS HAVE BECOME LESS TOLERANT OF MUSLIMS IF LESS TOLERANT (N=589): Which specific group or groups of people do you think Americans are less tolerant of than they were a decade ago? OPEN-END Muslims 33% Immigrants 20% Hispanics 16% Gays and lesbians 8% Young adults 8% Upper class Americans 7% African-Americans 6% Seniors 6% Caucasians 5% Working class Americans 5% Middle class Americans 5% Jews 3% Don't Know / No Response 13% Showing All (N=589) Others 13% 24 ©PENN, SCHOEN & BERLAND ASSOCIATES, LLC.
  • 25. 9/11: A LASTING IMPACT ON HOW AMERICANS PERCEIVE MUSLIMS •  In each major sub-group approximately 3 in 4 say that the events of 9/11 have had a lasting impact on Americans’ tolerance of Muslims Do you think the events of 9/11 have had a lasting impact on Americans’ tolerance of Muslims? Yes No Don't Know 78% 14% 8% Showing All Political College Gender Age Income Race Affiliation Attainment All M F 18-29 30-44 45-64 65+ D R I <$75k >$75k No Yes White AA Hisp Yes 78 77 78 80 76 79 76 78 81 75 77 81 77 79 79 71 80 No 14 15 12 11 15 14 15 14 14 14 15 13 14 14 14 14 10 Don’t Know 8 8 9 9 10 7 9 9 5 11 9 6 9 7 7 15 10 25 ©PENN, SCHOEN & BERLAND ASSOCIATES, LLC.
  • 26. A DECADE OF DECLINE NEW YORK • WASHINGTON • DENVER • SEATTLE • LOS ANGELES • SAN FRANCISCO • AUSTIN• LONDON • HONG KONG • BEIJING • DUBAI 26 ©PENN, SCHOEN & BERLAND ASSOCIATES, LLC.
  • 27. A DECADE OF DECLINE •  Fewer than 1 in 4 of respondents think that it has been a decade of progress; African-Americans are the most likely sub-group to say that the pass decade has been one of progress (43% versus 23% of all respondents) Overall, do you think the past decade has been one of progress or decline for the United States as a country? Progress Decline Don't Know 23% 68% 9% Showing All College Gender Age Political Affiliation Income Race Attainment All M F 18-29 30-44 45-64 65+ D R I <$75k >$75k No Yes White AA Hisp Progress 23 24 22 27 24 20 20 32 14 22 23 23 24 21 18 43 29 Decline 68 69 67 60 67 72 72 56 79 69 67 70 66 71 74 46 58 Don’t Know 9 7 11 13 9 7 8 12 7 9 10 7 10 8 8 11 12 27 ©PENN, SCHOEN & BERLAND ASSOCIATES, LLC.
  • 28. 7 IN 10 THINK THE COUNTRY IS IN A WORSE POSITION THAN IT WAS A DECADE AGO •  Republicans, seniors (age 65 and older), and white Americans are most likely to say that the country is worse off than it was a decade ago Generally speaking, do you think the U.S. is in a better or worse position than it was a decade ago, or is it about the same? 71% Better Worse 16% About the same Don't know 2% 11% Showing All College Gender Age Political Affiliation Income Race Attainment All M F 18-29 30-44 45-64 65+ D R I <$75k >$75k No Yes White AA Hisp Better 11 12 10 12 12 10 7 18 4 10 11 11 11 11 8 22 10 Worse 71 70 72 66 68 74 78 60 84 71 71 71 71 72 77 43 70 About the same 16 16 16 20 18 13 13 20 10 17 16 16 16 16 13 31 16 Don’t know 2 2 2 2 2 2 2 2 1 2 2 2 2 2 1 4 4 28 ©PENN, SCHOEN & BERLAND ASSOCIATES, LLC.
  • 29. THE RISING NATIONAL DEBT – THE MOST IMPORTANT TREND OF THE DECADE Which of the following is the most important TREND of the past decade? OPEN-END The rising national debt 16% U.S. jobs being sent overseas 14% Increased use of technology 13% Increasing corporate greed 9% Spread of global terrorism 7% Increasing immigration 5% The decline of home prices 5% The rise of social media 5% Increasing role of women in the workplace and politics 3% The U.S. population becoming more ethnically diverse 3% The U.S. population getting older 2% The 24-7 news cycle 2% The rise of online search 2% The increasing number of independent voters 1% Arab Spring protests in the Middle East 1% The decline of print media 1% Other 4% Showing All Don’t know 6% 29 ©PENN, SCHOEN & BERLAND ASSOCIATES, LLC.
  • 30. WEAKER ECONOMY THE TOP REASON FOR THE U.S. BEING IN A WORSE POSITION IF U.S. IS IN WORSE POSITION (N=1,440) Why do you think the U.S. is in a worse position than it was a decade ago? OPEN-END Weaker economy 28% Rising national debt 17% Higher unemployment 16% Wars in Afghanistan and Iraq 12% High government spending 11% Loss of jobs to overseas 10% High fuel costs 8% Weaker U.S. dollar 8% Healthcare reform 5% Rise of other global powers like China, India 5% Weaker partnerships with allies 4% More government regulation 4% Fear of terrorism 4% More partisanship in Washington 4% Fewer personal liberties 3% Tax cuts 3% Less government regulation 2% Other 28% Don't Know / No Response 6% Showing All (N=1,440) 30 ©PENN, SCHOEN & BERLAND ASSOCIATES, LLC.
  • 31. AMERICANS WHO THINK THE U.S. IS IN A BETTER POSITION: THE TOP REASONS IF U.S. IS IN BETTER POSITION: Why do you think the U.S. is in a better position than it was a decade ago? OPEN-END Barack Obama elected president 22% Technological advances 16% Stronger economy 9% Improvements in national security and safety 6% More democracy in the Middle East 6% Stronger partnerships with allies 5% Healthcare reform 5% Progress in Iraq 5% Progress in Afghanistan 4% Death of Osama bin Laden 4% Death of Saddam Hussein 2% Less government regulation 1% More government regulation 1% Tax cuts 1% Other 34% Don't know 20% Showing All (N=214) 31 ©PENN, SCHOEN & BERLAND ASSOCIATES, LLC.
  • 32. 35% OF AMERICANS ARE WORSE OFF THAN THEY WERE A DECADE AGO •  Americans whose annual income is more than $75,000 are significantly more likely than those with a lower income to say their life has improved Are you personally in a better or worse position than you were a decade ago, or is it about the same? 35% Better 33% Worse About the same 32% Don't know 1% Showing All College Gender Age Political Affiliation Income Race Attainment All M F 18-29 30-44 45-64 65+ D R I <$75k >$75k No Yes White AA Hisp Better 32 33 30 36 43 24 21 34 28 32 26 46 28 40 30 39 31 Worse 35 34 35 26 31 41 38 36 36 33 40 21 37 28 35 30 32 About the same 33 32 33 35 25 34 40 29 34 34 32 32 33 32 33 29 35 Don’t know 1 1 1 3 1 1 0 1 2 1 2 1 2 1 1 2 1 32 ©PENN, SCHOEN & BERLAND ASSOCIATES, LLC.
  • 33. ONE OF THE WORST DECADES IN THE PAST CENTURY •  White Americans are significantly more likely than racial minorities to perceive it as one of the worst decades In your opinion, how does the past decade compare to the other decades in the past hundred years? Would you say this past decade has been one of the best in the past century, one of the worst, or has it been about the same? One of the best 32% One of the 47% worst About the same 8% 13% Don't know Showing All College Gender Age Political Affiliation Income Race Attainment All M F 18-29 30-44 45-64 65+ D R I <$75k >$75k No Yes White AA Hisp One of the best 13 15 11 15 14 12 10 17 11 11 13 12 15 9 9 21 23 One of the worst 47 47 47 40 47 50 51 42 51 48 47 47 45 51 52 34 34 About the same 32 32 33 36 31 31 32 32 30 34 31 35 31 34 31 37 35 Don’t know 8 6 9 9 8 7 7 9 8 7 8 7 9 6 8 8 8 33 ©PENN, SCHOEN & BERLAND ASSOCIATES, LLC.
  • 34. RESPONDENTS SAY THE OVERALL QUALITY OF LIFE HAS DECLINED FOR MANY AMERICANS Please indicate whether you think the overall quality of life has improved, declined, or stayed the same in the past decade for each of the following groups of people living in the United States. Declined Improved Stayed the same Upper class Gays and Americans Hispanics lesbians African- Immigrants Americans Jews 48% 15% 16% 33% 44% 55% 41% 14% 17% 23% 9% 10% 41% 37% 25% 32% 25% 31% 17% 20% 22% 22% 23% 19% 16% 19% 15% 11% 32% 24% 24% 38% 55% 54% 70% 64% Muslims Caucasians Seniors Young adults Middle class Working class Americans Showing All Americans 34 ©PENN, SCHOEN & BERLAND ASSOCIATES, LLC.
  • 35. DETERIORATED RELATIONSHIPS WITH MANY FOREIGN COUNTRIES In the past decade, has each of the following country’s relationship with the U.S. improved, deteriorated, or remained the same? Deteriorated Improved Remained the same United Kingdom India China Russia 26% Saudi Arabia Israel 19% 24% 33% 10% 12% 11% 4% 5% 7% 6% 22% 47% 5% 7% 38% 15% 42% 40% 29% 26% 31% 35% 33% 17% 19% 25% 17% 14% 14% 15% 13% 22% 24% 38% 34% 38% 35% 42% 51% 51% 58% 62% 62% 59% Yemen Egypt Syria North Iraq Libya Korea Iran Pakistan Afghanistan Showing All 35 ©PENN, SCHOEN & BERLAND ASSOCIATES, LLC.
  • 36. AMERICANS BLAME THEIR LEADERS, NOT TERRORISTS, FOR THE DECLINE NEW YORK • WASHINGTON • DENVER • SEATTLE • LOS ANGELES • SAN FRANCISCO • AUSTIN• LONDON • HONG KONG • BEIJING • DUBAI 36 ©PENN, SCHOEN & BERLAND ASSOCIATES, LLC.
  • 37. AMERICANS BLAME THEIR LEADERS IF U.S. IS IN A WORSE POSITION : Which of these, if any, is most to blame for the U.S. being in a worse position than it was a decade ago? The Bush administration 23% The Obama administration 20% The U.S. Congress 16% Corporate CEOs 8% Terrorist groups 7% Wall Street 6% Special interest groups 5% Immigrants 3% Ordinary American people 3% Rising powers like China and India 2% Labor unions 2% Other 3% Showing All Don’t know 2% (N=1,440) 37 ©PENN, SCHOEN & BERLAND ASSOCIATES, LLC.
  • 38. AMERICANS BLAME THEIR LEADERS FOR THE DECLINE IF U.S. in a worse College Gender Age Political Affiliation Income Race position: Which of Attainment those, if any, is most All to blame for the U.S. (N=1,440) being in a worse M F 18-29 30-44 45-64 65+ D R I <$75k >$75k No Yes White AA Hisp (N=683) (N=757) (N=295) (N=369) (N=508) (N=268) (N=376) (N=493) (N=571) (N=992) (N=373) (N=962) (N=455) (N=1062) (N=104) (N=183) position than it was a decade ago? The Bush administration 23 19 26 31 25 21 13 45 7 21 24 17 24 22 17 54 33 The Obama 20 20 20 15 14 21 32 6 36 16 19 23 20 21 24 1 13 administration The U.S. Congress 16 21 11 10 15 17 21 9 20 16 16 16 16 16 18 9 12 Wall Street 6 7 6 5 7 7 4 6 6 6 5 8 6 7 5 10 9 Corporate CEOs 8 7 9 7 10 8 6 10 5 9 8 8 7 10 8 4 3 Special interest groups 5 5 4 3 6 5 3 3 5 5 4 6 4 5 4 3 7 Labor unions 2 2 1 1 1 2 3 0 2 2 1 2 2 1 2 0 2 Terrorist groups 7 6 8 12 7 6 4 7 5 9 8 5 8 5 7 6 9 Ordinary American 3 4 2 7 5 1 1 3 2 5 3 4 3 4 3 2 7 people Rising powers like China 2 2 2 1 2 1 4 2 3 1 2 2 2 1 2 1 1 and India Immigrants 3 2 5 4 2 4 3 5 3 3 4 3 4 2 4 5 1 Other 3 3 3 1 4 3 3 2 3 3 3 3 3 3 3 2 1 None of these 0 0 0 0 1 0 0 0 0 0 0 1 0 1 0 0 0 Don’t know 2 2 2 3 1 2 2 1 2 3 2 1 2 1 2 3 1 38 ©PENN, SCHOEN & BERLAND ASSOCIATES, LLC.
  • 39. THE ENEMY IS WITHIN: ECONOMIC ISSUES ARE PARAMOUNT NEW YORK • WASHINGTON • DENVER • SEATTLE • LOS ANGELES • SAN FRANCISCO • AUSTIN• LONDON • HONG KONG • BEIJING • DUBAI 39 ©PENN, SCHOEN & BERLAND ASSOCIATES, LLC.
  • 40. 2 IN 3 SAY THE ENEMY IS WITHIN •  Those Americans with a college degree and those whose annual income exceeds $75,000 are more likely than those without a degree or those respondents with less than $75,000 to think that major threats originate within the U.S. Do the greatest threats to long-term stability in the United States come primarily from within the United States or do they come from outside the United States? Within the U.S. Outside the U.S. Don't Know 66% 27% 7% Showing All College Gender Age Political Affiliation Income Race Attainment All M F 18-29 30-44 45-64 65+ D R I <$75k >$75k No Yes White AA Hisp Within the U.S. 66 69 63 62 70 65 64 62 68 66 62 76 62 75 68 55 59 Outside the U.S. 27 26 28 28 23 29 29 30 26 25 30 18 30 20 25 34 32 Don’t Know 7 5 10 10 7 6 7 7 6 8 7 6 8 5 7 11 9 40 ©PENN, SCHOEN & BERLAND ASSOCIATES, LLC.
  • 41. ECONOMIC, NOT NATIONAL SECURITY, CONCERNS PRESENT A GREATER THREAT •  White Americans are more likely than African-Americans or Hispanics to view economic concerns as a greater threat to the current stability of the U.S. Which is closer to your view? Economic National security concerns present a concerns present a greater threat to 75% 18% greater threat to the current stability the current stability of the U.S. of the U.S. Showing All Political College Gender Age Income Race Affiliation Attainment All M F 18-29 30-44 45-64 65+ D R I <$75k >$75k No Yes White AA Hisp Economic concerns present a greater threat to 75 76 75 72 77 77 73 74 81 73 73 84 72 84 80 63 67 the current stability of the U.S. National security concerns present a greater threat to 18 18 17 20 16 16 20 19 14 19 19 11 20 12 14 26 25 the current stability of the U.S. Don’t Know 7 6 8 8 7 6 7 7 4 9 7 5 8 4 6 11 8 41 ©PENN, SCHOEN & BERLAND ASSOCIATES, LLC.
  • 42. INTERNAL THREATS VERSUS EXTERNAL THREATS Please indicate whether each of the following presents a major threat, minor threat, or no threat at all to long-term stability in the United States. Internal Threat External Threat Rising national debt 78% High government spending 77% The budget deficit 75% Rising healthcare costs 73% Weakening U.S. Dollar 72% America's education system falling behind 71% American jobs being sent overseas 71% Spread of nuclear weapons 67% America's dependence on foreign energy 66% Al Qaeda 58% Lack of high-paying jobs 56% Domestic terrorists 56% Decline of moral values 55% Taliban 53% Partisan politics 49% Rise of new powers like China and India 45% Illegal immigrants 44% Government of Iran 44% Government of North Korea 39% Showing % Major threat Hezbollah 27% Hamas 27% 42 ©PENN, SCHOEN & BERLAND ASSOCIATES, LLC.
  • 43. YOUNG AMERICANS LESS LIKELY TO VIEW AL QAEDA AND THE TALIBAN AS MAJOR THREATS Please indicate whether each of Political College the following presents a major Gender Age Income Race Affiliation Degree threat, minor threat, or no threat at all to long-term stability in the All United States. M F 18-29 30-44 45-64 65+ D R I <$75k >$75k No Yes White AA Hisp Showing % Major threat Rising national debt 78 77 78 71 75 81 83 68 89 77 77 80 77 79 84 60 66 High government spending 77 73 80 69 77 77 84 68 88 75 78 73 78 73 80 61 73 The budget deficit 75 75 75 66 76 78 80 69 84 73 75 77 75 75 79 59 69 Rising healthcare costs 73 69 76 64 75 75 76 78 71 70 73 71 71 76 74 68 67 Weakening U.S. dollar 72 70 75 60 72 78 74 70 77 71 73 70 74 70 75 65 66 American jobs being sent overseas 71 71 72 54 71 80 76 77 72 67 72 70 73 69 76 67 59 America’s education system falling 71 70 73 68 74 73 71 74 69 71 69 76 70 76 72 70 72 behind Spread of nuclear weapons 67 65 68 63 65 71 67 67 70 64 69 61 69 62 66 68 68 America’s dependence on foreign oil 66 65 67 56 68 72 65 66 72 62 65 69 64 72 70 55 55 Al Qaeda 58 53 63 43 56 64 70 61 68 50 60 57 58 59 61 51 57 Lack of high-paying jobs 56 54 59 50 58 61 51 61 54 55 59 50 59 50 57 56 56 Domestic terrorists in the United 56 49 63 49 57 60 57 56 63 52 59 48 59 51 57 60 54 States Decline in moral values 55 52 58 47 58 57 60 46 67 55 58 48 58 49 58 52 47 Taliban 53 47 59 39 52 59 60 54 62 45 55 49 55 47 54 54 52 Partisan politics and political gridlock 49 50 48 32 47 55 60 49 52 45 48 52 47 53 53 42 33 Rise of new global powers like China 45 40 49 36 45 50 44 40 52 42 45 44 45 43 45 45 42 and India Illegal immigrants 44 45 42 29 39 49 60 35 57 41 47 36 48 36 49 35 18 Government of Iran 44 44 45 28 43 51 55 41 53 41 46 41 45 42 47 38 45 Government of North Korea 39 40 38 27 37 47 41 38 51 31 40 39 40 37 39 37 39 Hezbollah 27 33 21 17 25 32 35 23 36 22 27 28 26 28 29 22 23 Hamas 27 29 26 15 25 33 37 22 37 25 28 26 27 29 30 20 23 43 ©PENN, SCHOEN & BERLAND ASSOCIATES, LLC.
  • 44. 60% SAY THE COUNTRY IS ADDRESSING EXTERNAL THREATS AT LEAST SOMEWHAT EFFECTIVELY How effectively are we, as a country, addressing the threats that are OUTSIDE our control? Very effectively Somewhat effectively Not very effectively Not at all effectively 13% 47% 21% 8% Showing All College Gender Age Political Affiliation Income Race Attainment All M F 18-29 30-44 45-64 65+ D R I <$75k >$75k No Yes White AA Hisp EFFECTIVELY 60 60 61 65 61 61 52 64 56 60 61 58 61 59 57 69 68 (TOTAL) Very effectively 13 15 11 16 14 13 8 16 8 14 14 10 15 9 9 24 21 Somewhat effectively 47 45 50 49 47 48 44 48 48 46 47 48 46 50 48 45 47 NOT EFFECTIVELY 29 33 27 23 28 30 40 26 36 28 29 33 27 34 33 18 23 (TOTAL) Not very effectively 21 23 20 17 19 21 31 19 25 20 20 25 19 26 24 12 17 Not at all effectively 8 10 7 6 9 9 9 7 11 8 9 8 8 8 9 6 6 Don’t know 10 8 12 12 11 10 7 10 8 11 10 8 12 7 10 13 9 44 ©PENN, SCHOEN & BERLAND ASSOCIATES, LLC.
  • 45. THE MAJOR THREATS ARE WITHIN OUR CONTROL AS A COUNTRY •  African-Americans and Hispanics are the two sub-groups most likely to say that the threats affecting the long-term stability are mostly outside the country’s control Which is closer to your view? The threats The threats affecting the long- affecting the long- term stability of the term stability of the 71% 20% U.S. are mostly U.S. are mostly WITHIN our control OUTSIDE our as a country. control as a Showing All country. Political College Gender Age Income Race Affiliation Attainment All M F 18-29 30-44 45-64 65+ D R I <$75k >$75k No Yes White AA Hisp The threats affecting the long-term stability of the 71 72 70 66 75 71 68 69 76 68 67 82 66 81 75 61 60 U.S. are mostly WITHIN our control as a country. The threats affecting the long-term stability of the 20 20 19 24 17 19 21 22 17 20 22 13 22 15 16 26 28 U.S. are mostly OUTSIDE our control as a country. Don’t Know 9 8 11 9 8 10 11 9 7 12 11 4 12 5 9 13 12 45 ©PENN, SCHOEN & BERLAND ASSOCIATES, LLC.
  • 46. ONLY 10% THINK THAT INTERNAL THREATS ARE BEING ADDRESSED VERY EFFECTIVELY •  53% of respondents think that the country is not effectively addressing the threats that are within its control How effectively are we, as a country, addressing the threats that are WITHIN our control? Very effectively Somewhat effectively Not very effectively Not at all effectively 10% 32% 36% 17% Showing All How effectively are we, as a Political College Gender Age Income Race country, addressing the threats Affiliation Attainment that are WITHIN our control? All M F 18-29 30-44 45-64 65+ D R I <$75k >$75k No Yes White AA Hisp EFFECTIVELY (TOTAL) 42 39 43 46 41 41 36 54 33 39 44 36 45 35 36 61 51 Very effectively 10 10 9 10 10 9 9 14 6 9 11 6 12 5 7 23 12 Somewhat effectively 32 29 34 36 31 32 27 40 27 30 33 30 33 30 29 38 39 NOT EFFECTIVELY (TOTAL) 53 56 49 45 54 53 60 40 64 53 50 62 48 63 59 30 39 Not very effectively 36 35 36 34 36 34 41 31 43 34 35 40 33 42 39 23 28 Not at all effectively 17 21 13 11 18 19 19 9 21 19 15 22 15 21 20 7 11 Don’t know 6 4 7 9 5 5 4 6 3 8 6 2 8 2 4 9 11 46 ©PENN, SCHOEN & BERLAND ASSOCIATES, LLC.
  • 47. INTERNAL THREATS THAT NEED TO BE ADDRESSED MORE EFFECTIVELY •  The economy, jobs, government spending, budget deficit, national debt, immigration, healthcare, and education are the primary threats within our control that Americans do not feel are being addressed effectively IF NOT EFFECTIVELY (N=1,040): What specific threats that are WITHIN our control, are not being addressed effectively? OPEN-END * A word cloud is a visual representation of free-form text, with a larger font size indicating a greater number of respondents referenced the term in their response 47 ©PENN, SCHOEN & BERLAND ASSOCIATES, LLC.
  • 48. MAJORITY THINKS THE COUNTRY IS GOING IN THE WRONG DIRECTION Generally speaking, would you say things in this country are heading in the right direction or in the wrong direction? Right direction Wrong direction Don't know 28% 62% 10% Showing All Political College Gender Age Income Race Affiliation Attainment All M F 18-29 30-44 45-64 65+ D R I <$75k >$75k No Yes White AA Hisp Right direction 28 28 29 34 32 25 21 48 10 26 28 30 28 29 21 55 36 Wrong direction 62 63 60 53 58 66 69 41 84 61 62 63 61 62 71 31 50 Don’t Know 10 9 11 12 10 9 10 11 6 13 10 7 11 9 9 13 15 48 ©PENN, SCHOEN & BERLAND ASSOCIATES, LLC.