1. WM Morrison Supermarket Plc Confidential
(1)
IGD UK Grocery: Market and Channel Forecasts 2014-2019 1
Investment Thesis
Wm Morrison Supermarket Plc (or “Morrison” or “the Company”) operates in the USD 175 billion UK grocery
space.(1)
It’s current market price of 154.8 is rich considering uncertainties around its internal operation
restructuring and the future UK grocery market. The Company is great dividend yield stock but its price has not
performed in the last five years. The future outlook does not look exciting due to low growth and shrinking
margins. Hence, I would recommend not investing into the stock.
Industry
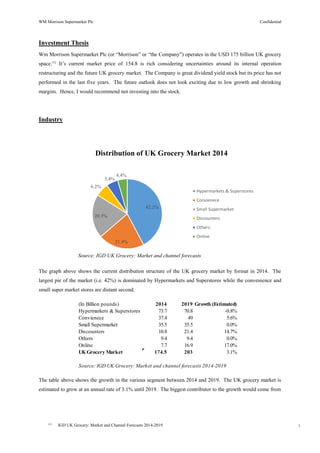
The graph above shows the current distribution structure of the UK grocery market by format in 2014. The
largest pie of the market (i.e. 42%) is dominated by Hypermarkets and Superstores while the convenience and
small super market stores are distant second.
The table above shows the growth in the various segment between 2014 and 2019. The UK grocery market is
estimated to grow at an annual rate of 3.1% until 2019. The biggest contributor to the growth would come from
42.2%
21.4%
20.3%
6.2%
5.4%
4.4%
Distribution of UK Grocery Market 2014
Hypermarkets & Superstores
Convienece
Small Supermarket
Discounters
Others
Online
Source: IGD UK Grocery: Market and channel forecasts
(In Billion pounds) 2014 2019 Growth (Estimated)
Hypermarkets & Superstores 73.7 70.8 -0.8%
Convienece 37.4 49 5.6%
Small Supermarket 35.5 35.5 0.0%
Discounters 10.8 21.4 14.7%
Others 9.4 9.4 0.0%
Online 7.7 16.9 17.0%
UKGrocery Market 174.5 203 3.1%
Source: IGD UK Grocery: Market and channel forecasts 2014-2019
2. WM Morrison Investment Note Confidential
2
(2)
"UK grocery growth at lowest level for 11 years". Kantar Worldpanel. 7 May 2014
(3)
Morrison Annual Report 2014
(4)
http://en.wikipedia.org/wiki/Morrisons#cite_note-45
the online segment, which currently accounts for the 4.4% of the segment while the “Discounters” are slated to
grow by double in the next five years.
The table above shows the market shares of various players in the Hypermarket and Superstores segment. The
Company’s market share as of May 2014 was 10.9%, making it the smallest of the "Big Four" supermarkets,
behind Tesco (28.7%), Sainsbury's (16.6%) and Asda (17.3%), but ahead of the fifth place The Co-operative
Food (6.1%).(2)
Company Overview
The Company was founded in 1899 by William Morrison and began as an egg and butter stall in Bradford. Over
the years the Company has expanded in North England but in 2004 it acquired Safeway, a Company with 479
stores, which increased its presence significantly in south of England and Scotland. The Company currently has
605 stores and 328 petrol filling stations. It operates in total retail square feet area of 14.2 billion. (3)
Until
2004, these superstores were largely concentrated in the English Midlands and the North of England, but had
expanded southwards, beginning with a store at Erith, Greater London, which opened in 1998.(4)
The Company’s mainly operates under the superstore format with core focus on groceries and home wares, with
fewer electronics items, clothing and furnishings than the company's main supermarket rivals. The Company is
vertically integrated, and owns its own farm, pie factory, bakery and abattoirs.
The Company operates in two formats: Superstores and Convenience stores.
a) Superstores: The traditional format of the Company’s superstores is called Market Street. The meat is
near or next to the butcher's counter, the delicatessen being traditionally named Provisions with cheese
fridge nearby and a rotisserie counter named Oven Fresh. There's a Pie Shop in every store and a bell
rings when a fresh batch comes out of the oven. The overall theme is based on an early 20th century
street setting in the north of England running around the edge of the store, with more conventional
aisles in the centre. Most superstores are typically between 28,500 sq ft and 36,000 sq ft, with an
increasing number above 36,000 sq ft, offering food, home wares, some essential clothing (i.e. socks,
underwear), cafés and petrol stations. They are freehold single storey brick buildings and have separate
surface ground car parking.
Company Market Share
Tesco 29.0%
Asda 17.1%
Sainsbury 16.5%
Morrison 10.9%
Other multiples Co-op 24.4%
Independent 2.1%
Source: Grocery Market Share as of May 2014 by Kantar World Panel
3. WM Morrison Supermarket Plc Confidential
(4)
http://en.wikipedia.org/wiki/Morrisons#cite_note-45
(5)
http://www.globalcstorefocus.com/cgi-bin/newsletter.pl?edition=201202&this_page=6
(6)
http://www.logisticsmanager.com/Articles/Article.aspx?liArticleID=19153 3
Under the current Chief Executive, Dalton Philips, Morrisons has introduced a more contemporary
store format, called the "Fresh Format". This format has seen the stores been taken upmarket. The
format has had mixed success, and an updated "Fresh Format" store was introduced in Croydon in
2013, which reverted to the traditional shop fronts theme. (4)
b) Convenience stores: The Company operates a number of smaller stores called "Morrisons M local" in
major places such as Birmingham, Manchester Cardiff and Bristol. These stores have a similar format
to small Tesco Express, Sainsbury's Local & Spar stores, but include a wider range of ready-to-eat hot
food such as pastries, coffee, rotisserie, porridge and also a salad bar, items are stocked from nearby
superstores and shoppers can also order foods in including fresh meat and fish.[5]
A distribution centre
in Feltham, West London was acquired to provide a distribution network to the stores
in London and the South East where there are few superstores.[6]
With its joint venture with Ocado in April 2014 the Company has finally moved into the online space. This
would help target a new segment of consumers. The Company did not offer a loyalty scheme – except in its
petrol stations, which is called the Morrisons Miles card. However, in October 2014 the Company unveiled its
new 'Match and More' scheme issuing points to customers based on instore deals, and price comparison against
Tesco, Sainsburys, Asda, Aldi, and Lidl. (4)
Management
Mr Dalton T
Philips
CEO Mr. Philips has been the Chief Executive Officer (“CEO”) of the Company
since March 29, 2010 and serves as its Member of the Management
Board. Mr. Philips served as Chief Operating Officer (“COO”) at Loblaw
Companies Limited (the largest food retailer in Canada) from January 10,
2007 to March 2010. From 1998 to 2005, he worked for Wal-Mart's
international division, holding a range of commercial positions, rising to
Chief Operating Officer in Germany.
Mr. Philips holds an MBA from Harvard University in 1998. He is educated
Size ('000's)of Square Feet 2010 2011 2012 2013 2014
0-5 3 12 102
5-15 42 45 65 64 76
15-25 141 137 135 135 123
25-40 199 213 228 239 252
40+ 43 44 44 48 52
Total 425 439 475 498 605
Source: WM Morrison Annual Report 2014
4. WM Morrison Investment Note Confidential
4
from University College Dublin.
Mr Tervor Strain CFO Mr. Trevor Strain serves as the Chief Financial Officer (“CFO”) at the
Company and serves as its Member of Management Board. Mr. Strain served
as Group Finance Director of the Company since April 10, 2013. Mr. Strain
joined Morrisons in June 2009 as Commercial and Operations Finance
Director and served as its Finance Director Corporate and took responsibility
for the productivity programmes since June 2011. Prior to joining the
Company, he worked for Tesco as UK Property Finance Director since 2006
and UK Planning and Reporting Finance Director. Mr. Strain began his career
with Arthur Andersen and is a member of the Institute of Chartered
Accountants in England and Wales.
Mr. Neal Austin Group
Logistics
Mr. Neal Austin serves as Group Logistics & Supply Chain Director and
Member of Management Board at the Company and served as its Logistics
Director. Mr. Austin served as an Interim Group Human Resource Director at
the Company. Mr. Austin joined the Company’s Management Board in
October 2010 and is responsible for logistics and supply chain. He also
oversees the Human Resources function on an interim basis. He joined the
Company in October 2006 from MFI, where, as Logistics Director, he was
involved in the sale of the retail business to private equity. Neal began his
career in 1989 with Tesco as a graduate trainee in the buying division, where
he undertook a number of buying and marketing roles, progressing to senior
wine buyer. He served as Supply Director of Asda.
Nick Collard Group
Marketing
&
Customer
Director
Mr. Nick Collard has been Group Marketing & Customer Director of the
Company since January 7, 2013 and serves as its Member of Management
Board. Mr. Collard served as Commercial Director since January 7, 2011.
Shareholder Information
Ownership Summary
Type Common Stock Equivalent Held % of Total Shares Outstanding Market Value (GBP in mm) 2
Institutions 1,771,533,880 75.93 2,742.3
Corporations (Public) 563,767 0.02 0.9
Corporations (Private) 24,473,275 1.05 37.9
Individuals/Insiders 465,141,402 19.94 720.0
ESOP 678,813 0.03 1.1
State Owned Shares 36,968,163 1.58 57.2
Public and Other 3 33,782,589 1.45 52.3
Total 2,333,141,889 100.00 ⁶ 3,611.7
5. WM Morrison Investment Note Confidential
5
Source: Capital IQ as on 31 October 2014
The shareholding of the Company is largely held by institutions. Of the institutional shareholding almost 90%
is held by traditional investment managers (such as Brandes Investment 7.5%, Blackrock 5.21% etc.).
Investment Thesis
USP: The Company tries differentiate itself from the rest of the competition by creating a USP of “fresh
produce” at Morrison.
Management: The Company has a strong management bench. It recognises that there are key business and
finance issues and has taken steps towards correcting them.
Property: The Company owns a substantial property portfolio. Over 90% of its stores are freehold. The market
value of these assets is much higher than its book value. The Company has over GBP 7 billion of freehold land
and building in its balance sheet while the market capitalisation of the Company is GBP 3.6 billion.
Yield: The Company provides a high dividend yield of 8.75%.
Consolidation: There would be a consolidation among industry players as the market matures and margins
shrink further. With the current issues at TESCO there might be a bid for its stores though none of the
companies have enough cash. The possibility might be limited due to anti-competitive restrictions.
Key Risks
Competition: The Company faces intense competition in its core business from i) the current hypermarket and
supermarket players who are always looking to grab market share from their competition. ii) Increase in online
shopping format has eaten the market share of hyper and super markets.
Low Margins: This industry is characterised by low gross margins and high volume. Hence, very little room
for the players to manage profitability.
High Debt: The Company’s has built a large pile of debt and there are concerns whether it would be able to
build a sustainable business model to pay off its long term debt.
6. WM Morrison Investment Note Confidential
6
Expansion: In an increasingly competitive market the Company has expanded quickly in the last four years
spending approximately 4 billion pounds on capital expenditure (1/3 of gross fixed asset). Expansion has come
with its own set of challenge as the Company hasn’t been able to provide the infrastructural support to manage
such a growth. It ended up with not its utilising assets completely
Turnaround: the turnaround process the Company is undergoing can be perceived to be risky given the
competitive environment its operating in.
Cash flows: The current dividend policy is in place to keep the current investors in check. As per my workings
the business will not be able to generate enough fee cash flows to meet its dividend commitments after a few
years.
Valuation
We have computed the share price of the Company through the following methods:
a) Comparable Comps Multiples: We have calculated forward multiple (namely EV/Revenue,
EV/EBITDA and P/E) of three comparable retail in UK. We have applied a median multiple (since the
averages were skewed due to Ocado) derived from this exercise to the forward numbers of the
Company. We arrived at a share price of GBP 1.26.
b) Discounted Cash Flow
We estimated the Free Cash Flow to Equity (FCFE) for the Company for the next three years. We
calculated the Terminal Value for the Company assuming a 1% growth and Cost of Equity of 9.7%.
On review of the annual report of the Company, industry reports and brokerage assumptions. We
Comparable Valuation
(In million pounds)
Company Name Market Cap Net Debt* Enterprise
Value
Gross
Margin
%*
EBITDA
Margin
%*
EBIT
Margin
%*
Net
Income
Margin
%*
EV/Revenue EV/EBITDA P/E
J. Sainsbury plc (LSE:SBRY) 4,757.3 1,257.0 6,016.3 5.8% 6.1% 3.8% 2.99% 0.25x 4.63x 9.34x
Tesco PLC (LSE:TSCO) 14,077.1 9,652.0 23,752.1 6.1% 5.5% 3.1% 0.26% 0.38x 6.83x 11.07x
Ocado Group PLC (LSE:OCDO) 1,430.2 44.6 1,474.8 32.2% 5.5% 1.2% (0.14%) 1.40x 18.08x 88.45x
Median 0.38x 6.83x 11.07x
Average 0.68x 9.85x 36.29x
* Based on last tweleve month numbers
** Market Capitalisation is based on latest Current Market Price
Note: Forward Multiples are based on the next 12 month numbers estimated by Capital IQ
Source: Estimtates have been derived from Capital IQ
Valuation as per Comps
Particulars Median FY 15 EV Debt Equity
Revenue 0.38x 17,708.7 6,729.3 2,919.0 3,810.3
EBITDA 6.83x 744.0 5,081.5 2,919.0 2,162.5
P/E 11.07x 259.7 2,875.0 - 2,875.0
Average 2,949.3
Number of Shares 2.3
Share Price 1.26
7. WM Morrison Investment Note Confidential
7
concluded that the industry will grow at an average growth rate of 2/3% for the next five years. This
will slowly taper to 1% by year 10 as the industry enters into a mature phase. Hence we have assumed
a 1% growth rate for terminal value. While calculating FCFE we did not assume Fixed Asset disposals
since this is a one off adjustment. We have come with a share price of GBP 1.68
c) Gordon’s Growth Model:
At current price the stocks seems to be trading at its intrinsic value and hence there is no significant upside from
owning this stock.
DiscountedCash Flows Calculation
(In million pounds) 2015 (P) 2016 (P) 2017 (P)
FCFE=NI+Dep-FC-WC+Borrow 346.7 381.9 354.6
Discounted Cash Flows 316.0 317.1 268.4
Terminal Value 3,034.7
Value as per DCF (in billion) 3.9
Number of Shares in the Company 2.3
Share Price of the Company 1.68
Assunmptions:
Particulars Rate Source
Growth 1% Refer Note
Cost of Equity 9.7%
Risk Free Rate 2.2% Bloomberg (UK 10 Year)
Equity Beta 0.96 Bloomberg Estimate
Risk Premium 7.8% Bloomberg
Dividend in FY15 (In million) 297.2
Growth 1.0%
Cost of Equity 9.7%
Equity Value 3,437.3
No of Shares (in billion) 2.3
Share Price (GBP) 1.47
8. WM Morrison Investment Note Confidential
8
Annexure
Income Statement
FY3/31 2010 (A) 2011 (A) 2012(A) 2013(A) 2014(A) 2015 (P) 2016 (P) 2017 (P)
Revenue 15,410.0 16,479.0 17,663.0 18,116.0 17,680.0 17,708.7 17,997.9 18,287.0
Growth 6.9% 7.2% 2.6% -2.4% 0.2% 1.6% 1.6%
Gross Profit 1,062.0 1,148.0 1,217.0 1,206.0 1,074.0 708.3 719.9 731.5
Gross Porfit % 6.9% 7.0% 6.9% 6.7% 6.1% 4.0% 4.0% 4.0%
Administration 319.0 317.0 316.0 341.0 348.0 354.2 360.0 365.7
% of Sale 2.1% 1.9% 1.8% 1.9% 2.0% 2.0% 2.0% 2.0%
Total Expenses 319.0 317.0 316.0 341.0 348.0 354.2 360.0 365.7
EBITDA 743.0 831.0 901.0 865.0 726.0 354.2 360.0 365.7
EBITDA Margin 4.8% 5.0% 5.1% 4.8% 4.1% 2.0% 2.0% 2.0%
Less Depreciation - - - - -
Less Interest -41 -32 -33 -62 -78 -74.5 -74.5 -62.4
Add: Other Income 69.0 79.0 85.0 80.0 81.0 81.0 81.0 81.0
Add: Other Non op Income/(Exp) -4.0 -4.0 -6.0 -4.0 -3.0
PBT 767.0 874.0 947.0 879.0 726.0 360.7 366.5 384.3
Add: Gain on sale of asset
Add/(Less) Unusual Items 91.0 0.0 0.0 0.0 0.0
Less: Asset Write Down -535.0
Less tax -260.0 -242.0 -257.0 -232.0 -62.0 -101.0 -102.6 -107.6
Net Income 598.0 632.0 690.0 647.0 129.0 259.7 263.9 276.7
Number of Shares 2,623.3 2,640.5 2,586.6 2,428.0 2,380.0 2,380.0 2,380.0 2,380.0
EPS 0.23 0.24 0.27 0.27 0.05 0.11 0.11 0.12
Cash Flow
Net Income 598.0 632.0 690.0 647.0 129.0 259.7 263.9 276.7
Add Depreciation, Amort, Write Down 306.0 319.0 340.0 368.0 940.0 390.0 400.0 400.0
Add Change in Working Capital -97.0 -84.0 -73.0 113.0 189.0 197.0 118.0 77.9
Add Interest -57.0 30.0 -31.0 -22.0 -160.0 74.5 74.5 62.4
Add: Tax
Less gain or Loss fromSales of asset -5.0 1.0 2.0 1.0 -9.0 0.0 0.0 0.0
Cash Flow fromOperations 745.0 898.0 928.0 1,107.0 1,089.0 921.2 856.3 817.0
Less Capex -909.0 -587.0 -866.0 -1,011.0 -986.0 -500.0 -400.0 -400.0
Add: Sale of Assets 0.0 0.0 0.0 0.0 0.0 400.0 750.0 750.0
Less Investment in Joint Venture - -31.0 0.0 -66.0 0.0 0.0 0.0
Add Others 8.0 5.0 6.0 - - 0.0 0.0 0.0
Cash Flow fromInvestments -901.0 -582.0 -891.0 -1,011.0 -1,052.0 -100.0 350.0 350.0
Add : Long TermDebt 200.0 25.0 1,102.0 843.0 790.0 0.0 0.0
Add: Short TermLoan
Add: Common Stock Issued 34.0 16.0 - 42.0 28.0
Less: Stock Repurchased - - -368.0 -579.0 -53.0
Less Interest -74.5 -74.5 -62.4
Less: Debt Repaid -1.0 -154.0 -486.0 -81.0 -157.0 -209.0 -201.0
Less Dividend -159.0 -220.0 -301.0 -270.0 -283.0 -297.2 -312.0 -327.6
Cash Flow fromFinancing 74.0 -333.0 -53.0 -45.0 325.0 -580.6 -386.5 -591.0
Cash Flow -82.0 -17.0 -16.0 51.0 362.0 240.6 819.9 576.0
Source: Company Annual Report 2014. Inputs for future projections have been considered from Company's annual report
9. WM Morrison Investment Note Confidential
9
Performance
Share Price Gross Margins
The graph above shows the return on retail stocks for the past five years. Other than Ocado (which also is in a
downward trend) the industry has not made capital gains for its shareholders.
The graph above shows the gross margin trend in the industry for the past 10 years. The industry has entered in
a stable growth environment and no further margin expansion can be expected for the players within the the
industry.
Return on equity for the industry during the last five years show a negative trend. Even the annual growth rate
for the industry is tapering downwards highlighting the industry shift towards a mature stage.
Revenues
(In million pounds) 2011 (A) 2012(A) 2013(A) 2014(A) 2015 (P) 2016 (P) 2017 (P)
Revenue 16,479.0 17,663.0 18,116.0 17,680.0 17,708.7 17,997.9 18,287.0
Growth 7.2% 2.6% -2.4% 0.2% 1.6% 1.6%
Sales Per Square Foot Per Week 25.8 26.3 26.0 23.9 23.17 23 23
1.8% -1.4% -8.0% -3.0% 0.0% 0.0%
Square Feet (in billion) 12.3 12.9 13.4 14.2 14.7 14.9 15.2
5.2% 4.0% 6.1% 3.3% 1.6% 1.6%
Space Addition:
New Core 264 240 240
Convience 200
Growth in Sales per sq foot -3.0% 0.0% 0.0%
Source: All the inputs for revenue have been taken from the Company's annual report 2014.
-80.00%
-30.00%
20.00%
70.00%
120.00%
170.00%
220.00%
270.00%
Wm. Morrison Supermarkets plc (LSE:MRW) - Share Pricing Tesco PLC (LSE:TSCO) - Share Pricing
J. Sainsbury plc (LSE:SBRY) - Share Pricing Ocado Group PLC (LSE:OCDO) - Share Pricing
Source: Capital IQ 5 year prices
-15.00%
-10.00%
-5.00%
0.00%
5.00%
10.00%
15.00%
20.00%
25.00%
30.00%
WM Morrison J Sainsbury TESCOSource: Capital IQ
-10.00%
-5.00%
0.00%
5.00%
10.00%
15.00%
20.00%
25.00%
WM Morrison Tesco Sainsbury
Return on Equity
-10.00%
-8.00%
-6.00%
-4.00%
-2.00%
0.00%
2.00%
4.00%
6.00%
8.00%
10.00%
WM Morrison TESCO Sainsbury
Annual Growth in the last five years