Empfohlen

Empfohlen
Weitere ähnliche Inhalte
Empfohlen
Empfohlen (20)
Page 11 - Quick Process Mapping and Visual Analysis Sheet, VSM
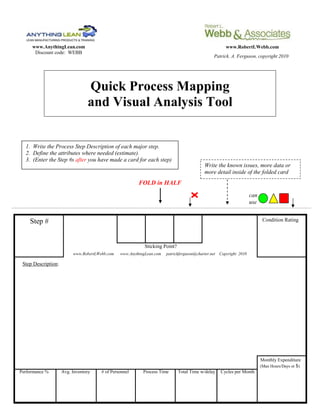
- 1. www.AnythingLean.com 'www.RobertLWebb.com Discount code: WEBB Patrick. A. Ferguson, copyright 2010 Quick Process Mapping and Visual Analysis Tool 1. Write the Process Step Description of each major step. 2. Define the attributes where needed (estimate). 3. (Enter the Step #s after you have made a card for each step) Write the known issues, more data or more detail inside of the folded card FOLD in HALF can use Step # Condition Rating Sticking Point? www.RobertLWebb.com www.AnythingLean.com patrickferguson@charter.net Copyright 2010 Step Description: Monthly Expenditure (Man Hours/Days or $) Performance % Avg. Inventory # of Personnel Process Time Total Time w/delay Cycles per Month