
Recommended
Recommended
More Related Content
What's hot
What's hot (18)
Similar to Prediction of the in vitro permeability determined in Caco-2 cells by using artificial neural networks
Similar to Prediction of the in vitro permeability determined in Caco-2 cells by using artificial neural networks (20)
Recently uploaded
Recently uploaded (20)
Prediction of the in vitro permeability determined in Caco-2 cells by using artificial neural networks
- 1. European Journal of Pharmaceutical Sciences 41 (2010) 107–117 Contents lists available at ScienceDirect European Journal of Pharmaceutical Sciences journal homepage: www.elsevier.com/locate/ejps Prediction of the in vitro permeability determined in Caco-2 cells by using artificial neural networks Paulo Paixão a,b , Luís F. Gouveia a , José A.G. Morais a,∗ a iMed.UL, Faculdade de Farmácia, Universidade de Lisboa, A. Prof. Gama Pinto, 1649-003 Lisboa, Portugal b Faculdade de Ciências e Tecnologias da Saúde, Universidade Lusófona de Humanidades e Tecnologias, Lisboa, Portugal a r t i c l e i n f o a b s t r a c t Article history: Caco-2 cells are currently the most used in vitro tool for prediction of the potential oral absorption of Received 10 January 2010 new drugs. The existence of computational models based on this data may potentiate the early selection Received in revised form 12 May 2010 process of new drugs, but the current models are based on a limited number of cases or on a reduced Accepted 30 May 2010 molecular space. We present an artificial neural network based only on calculated molecular descriptors Available online 8 June 2010 for modelling 296 in vitro Caco-2 apparent permeability (Papp ) drug values collected in the literature using also a pruning procedure for reducing the descriptors space. Log Papp values were divided into a training Keywords: group of 192 drugs for network optimization and a testing group of another 59 drugs for early stop and In vitro Caco-2 apparent permeability Molecular descriptors internal validation resulting in correlations of 0.843 and 0.702 and RMSE of 0.546 and 0.791 for the training In silico prediction and testing group, respectively. External validation was made with an additional group of 45 drugs with a Artificial neural network correlation of 0.774 and RMSE of 0.601. The selected molecular descriptors encode information related to Pruning of inputs the lipophilicity, electronegativity, size, shape and flexibility characteristics of the molecules, which are related to drug absorption. This model may be a valuable tool for prediction and simulation in the drug development process, as it allows the in silico estimation of the in vitro Caco-2 apparent permeability. © 2010 Published by Elsevier B.V. 1. Introduction quantitatively predict oral absorption. These were based on the search to correlate some molecular descriptors to measures of Oral administration of drugs, due to its ease and patient com- bioavailability by means of multivariate regression tools. Models pliance, is the preferred route and a major goal in the development were developed based on the in vivo Human Intestinal Absorp- of new drug entities. It is also traditionally one of the reasons tion (Abraham et al., 2002; Butina, 2004; Klopman et al., 2002; for either discontinuation or prolongation of the development Norinder and Osterberg, 2001; Zhao et al., 2001), in vivo absorption time of compounds. These problems lead to a new paradigm, a rate constants (Linnankoski et al., 2006), in vivo jejunal effective multivariate approach, in compound selection and optimization permeability (Winiwarter et al., 2003; Winiwarter et al., 1998), (Venkatesh and Lipper, 2000). In this context, and as a conse- in vitro apparent permeability in artificial membranes (Fujikawa quence of combinatorial chemistry, initial screening of compounds et al., 2005; Fujikawa et al., 2007; Nakao et al., 2009; Verma et in a number of thousands is done typically by using in silico al., 2007) and in vitro apparent permeability (Papp ) in Caco-2 cells approaches. In vitro tests are responsible to reduce the number of (Castillo-Garit et al., 2008; Degim, 2005; Di Fenza et al., 2007; compounds from hundreds to dozens and in vivo animal models Fujiwara et al., 2002; Hou et al., 2004; Nordqvist et al., 2004; Ponce to 1–5 finally potential drugs that are included in clinical tri- et al., 2004; Santos-Filho and Hopfinger, 2008; Yamashita et al., als. 2002a). Various in silico models already exist to predict drug absorp- In vivo based data, although obviously the target for the tion potential. One of the most known is the “Lipinski rule of 5” lead drug, presents some drawbacks. In vivo global bioavail- (Lipinski et al., 2001), based on the analysis of successful drugs, in ability results from different physical−chemical and biological which indications for poor absorbed compounds are based on the processes that are difficult to isolate. To be absorbed, a drug number of H-bond donors and acceptors, molecular weight and needs first to be in its soluble form. Passive diffusion may ClogP. After that initial effort, various models were proposed to be the principal driving force for drug absorption, but either active transport or efflux mechanisms may condition the final bioavailability. Instability in the gastro-intestinal fluids and metab- ∗ Corresponding author. Tel.: +351 21 794 64 44/00/72; fax: +351 21 794 64 70. olization may also reduce the amount of drug that effectively E-mail address: jagmorais@ff.ul.pt (J.A.G. Morais). reaches the systemic circulation. For these reasons, calculation of 0928-0987/$ – see front matter © 2010 Published by Elsevier B.V. doi:10.1016/j.ejps.2010.05.014
- 2. 108 P. Paixão et al. / European Journal of Pharmaceutical Sciences 41 (2010) 107–117 the absorption rate constants, which uses pharmacokinetic data 2. Materials and methods after intravenous and oral administration, may underestimate the absorption. Collection of data on Human Intestinal Absorption 2.1. Data collection is also experimentally demanding. It requires the evaluation of the fraction of dose, either as parent or metabolites, eliminated In vitro Log Papp values (Table 1 ) for 296 different drugs were by the faeces and urine which may easily result in underesti- obtained from published studies of drug absorption in Caco-2 cells. mation of the actual fraction of dose absorbed. Finally, data on Examples of drugs absorbed by passive diffusion using either the jejunal effective permeability, which isolates the absorption pro- paracellular or transcellular route, and cases of active transport by cess but is experimentally complex, is limited to only a small different transporters were included. Examples of drugs suffering number of drugs. Another drawback in these three approaches efflux mechanisms were also included. In all cases when non-linear is that prediction confirmation is only possible when the drug relations between Papp and apical concentrations were described, is administered to humans in the end stages of drug discov- Papp values were collected in the saturation zone. Experimental ery, leaving no room for “fine-tuning” during the development values were obtained in pH values ranging from 6.8 to 7.4, with phase. low to median passage numbers (28–46) and typically at a cell age In vitro tests, on the contrary, are routinely performed by close to 21 days. Due to a large interlaboratory variability it is fre- pharmaceutical companies in an early stage of drug develop- quent to test various “model” drugs in order to validate the results ment. For this reason, a large number of Papp values for different obtained. In our case, we used the study with the larger number molecules are being produced and are/will be available to build of drugs tested as a “reference” (Yazdanian et al., 1998), and the databases with a large span of values from high to low bioavail- other studies were normalized using the common drugs with the abilities. Parallel artificial membrane permeation assays (PAMPA) “reference”. Using this procedure the overall interlaboratory vari- are a very promising tool to predict absorption, but there are ability, judged by the experimental RMSE, was reduced from 0.427 various experimental variables to be considered and in prac- to 0.367. After normalization, median values were determined for tice it appears to produce the same outcome that a simple each drug across laboratories. Finally, drugs were randomly divided Log D7.4 assay in predicting high and low absorption (Galinis- between a training group (n = 192) used to train the ANN and a Luciani et al., 2007). Caco-2 cells, on the contrary, are a widely testing group (n = 59) used also in the training process but for the preformed in vitro test with interesting properties when extrap- “early stop” process and as an internal validation dataset. A vali- olating results to bioavailability. It is a cell system, characterized dation group (n = 45) used to externally validate the in silico model by easy handling and at the same time resemble morphological and to establish the model ability to predict the in vitro Papp values and biochemical characteristics of the intestinal cells (Vogel, 2006), was also created. that shows a sigmoid relationship between the fraction absorbed in humans and the Papp across the cells (Artursson and Karlsson, 2.2. In silico calculation of the molecular descriptors 1991). A number of statistical multivariate methods for developing in The following methodology was used for the in sil- silico models are currently used. Artificial neural networks (ANN), ico descriptors: SMILES notation of each molecule was however, have shown superior performance to the linear multi- obtained using the on-line PubChem Compound database variate class of methods in various QSAR models (Fujiwara et al., (http://www.ncbi.nlm.nih.gov). Ionization descriptors (pKa (acid); 2002; Paixao et al., 2009; Sutherland et al., 2004; Votano et al., pKa (base), and lipophilicity (Log P)) were obtained using the 2004). To the best of our knowledge, only three studies were pre- on-line ALOGPS 2.1 program (Tetko and Bruneau, 2004). For drugs viously reported to predict in vitro apparent permeability (Papp ) without an acid ionisable group, a value of 15 was attributed to in Caco-2 cells using ANN and molecular descriptors. Of these, pKa (acid). For drugs without a basic ionisable group, a value of −1 two studies (Degim, 2005; Fujiwara et al., 2002) were based on was attributed to pKa (base). The remaining descriptors, related a small number of drugs, did not make any particulate approach to to size, compactness, lipophilicity and others, were obtained avoid overfitting, nor made a convenient search of optimal molec- from the on-line E-Dragon 1.0 software using CORINA to convert ular descriptors to predict the in vitro Caco-2 permeability. The the SMILES notation to the 3D representation of the molecule other study (Di Fenza et al., 2007) resolved some of these prob- (Tetko et al., 2005). A total of 246 molecular descriptors were lems, but was based on proprietary analogue drugs. Since the calculated, consisting of 8 molecular properties, 48 constitutional proposed model was built with the use of molecules contained in descriptors, 73 topological descriptors, 26 geometrical descriptors, a very similar chemical space, it was proved to be less competent 47 information indices and 44 WHIM descriptors. in predicting Log Papp values in a more chemical diverse external dataset. 2.3. ANN model building With the purpose to overcome these limitations, we present a backpropagation ANN model using early stop to predict in The Artificial Neural Network (ANN) non-linear regression was vitro Caco-2 Log Papp based on 296 structurally different drugs performed using the backpropagation neural modelling system and drug-like molecules collected in the literature. This large Qnet for Windows v.2000 build 751 (Vesta Services inc., USA) dataset would provide a broad molecular space, ideal to enlarge and an in-house developed Microsoft Excel® VBA routine for pro- the applicability of the proposed model. Various molecular cess automation. Papp values were log transformed and randomly descriptors, encoding different molecular characteristics were divided between a training (TR group with 65% of the total data), initially used. Reduction of the number of possible molecular a testing (TE group with 20% of the total data) and an external val- descriptors was made by a simple pruning procedure, allow- idation group (VAL group with 15% of the total data). In order to ing to point out some possible factors influencing the drugs allow the calculation of the relative relevance of the used molecu- absorption process. Use of early stop during the whole mod- lar descriptors, all networks were built using normalized variables elling procedure also ensured that optimal prediction capabilities both in the input and output, and a sigmoid transfer function were maintained in the final model. This model, and proposed was used in all connections. Early stopping of training is one of methodology, may be a valuable tool in early drug develop- the methods that aim to prevent overfitting in ANN (Cataltepe et ment. al., 1999). In early stopping, it is assumed that the generalization
- 3. P. Paixão et al. / European Journal of Pharmaceutical Sciences 41 (2010) 107–117 109 Table 1 Table 1 (Continued. ) In vitro Log Papp (cm/s) Caco-2 values collected in the literature. Dataset Drug Observed Predicted Residue Dataset Drug Observed Predicted Residue Tr Glycine-Valine acyclovir −5.28 −5.66 0.38 Tr (2E)-N-I-E-D −3.59 −4.18 0.59 Tr Gly-Pro −5.12 −5.59 0.47 Tr (2E)-N-M-E-D −4.02 −4.13 0.12 Tr GlySar −5.62 −5.72 0.09 Tr (2E,4E)-N-I-D −5.24 −4.18 −1.07 Tr Griseofulvin −4.36 −4.51 0.15 Tr (2E,4E,8Z)-N-I-T −4.46 −4.11 −0.35 Tr Guanoxan −4.87 −5.60 0.73 Tr (2E,4Z)-N-I-D-D −3.32 −4.05 0.73 Tr H216/44 −6.88 −6.91 0.03 Tr (2E,4Z)-N-m-D-D −3.92 −4.02 0.10 Tr H244/45 −5.77 −5.54 −0.23 Tr (2E,4Z,8Z)-N-I-T-Y −3.80 −4.00 0.20 Tr H95/71 −6.00 −5.58 −0.42 Tr (2E,4Z,8Z,10Z)-N-I-T −3.67 −4.06 0.40 Tr Harmaline −6.07 −6.18 0.11 Tr (2E,7Z)-N-I-D-D −4.84 −4.18 −0.66 Tr Harmane −6.13 −6.43 0.29 Tr (2E,9Z)-N-I-D-D −4.96 −4.32 −0.64 Tr Harmine −6.13 −6.15 0.02 Tr (2E,9Z)-N-M-D-D −4.21 −4.29 0.08 Tr Harmol −6.37 −5.80 −0.56 Tr 5-Aminolevulinic acid −5.34 −5.36 0.02 Tr Hydralazine −5.17 −4.55 −0.63 Tr Acetaminophen −4.44 −4.83 0.39 Tr Hydrochlorothiazide −6.06 −5.79 −0.27 Tr Alanine −5.63 −5.39 −0.24 Tr Ibuprofen −4.58 −5.15 0.57 Tr Alfa-Methyldopa −6.63 −6.42 −0.22 Tr Imipramine −5.17 −5.21 0.04 Tr Alfentanil −4.26 −4.55 0.29 Tr Indomethacin −4.89 −4.41 −0.48 Tr Amoxicillin −6.31 −6.25 −0.06 Tr Inuline −6.25 −5.92 −0.33 Tr Ampicillin −5.70 −6.06 0.36 Tr Ketoconazole −4.93 −4.59 −0.33 Tr Antipyrine −4.47 −4.77 0.30 Tr Ketoprofen −4.48 −5.24 0.76 Tr Artemisinin −4.52 −4.19 −0.33 Tr Labetalol −4.82 −6.12 1.30 Tr Artesunate −5.40 −5.71 0.31 Tr Lactic acid −6.19 −5.18 −1.01 Tr Atenolol −6.34 −5.80 −0.54 Tr lactulose −6.81 −6.70 −0.11 Tr Azithromycin −6.37 −6.46 0.09 Tr Lamotrigine −4.39 −4.82 0.43 Tr Benzoic acid −4.15 −3.72 −0.43 Tr Lef553 −7.76 −6.96 −0.80 Tr Betaxolol ester −4.58 −5.47 0.89 Tr Lisinopril −7.39 −7.11 −0.27 Tr Bosentan −6.19 −6.21 0.02 Tr l-phenylalanine −5.00 −5.04 0.03 Tr Bremazocine −4.82 −4.78 −0.03 Tr LY122772 −3.87 −4.16 0.30 Tr Bromocriptine −5.91 −5.72 −0.18 Tr LY341904 −4.33 −4.51 0.18 Tr Budesonide −4.89 −4.79 −0.10 Tr LY341908 −4.14 −4.50 0.37 Tr Camptothecin −4.11 −4.52 0.41 Tr LY353462 −4.17 −4.66 0.48 Tr Carbamazepine −4.37 −4.70 0.32 Tr LY354030 −4.06 −4.60 0.54 Tr Catechin −6.82 −5.98 −0.84 Tr LY354400 −4.46 −4.56 0.10 Tr Ceftriaxone −6.65 −6.72 0.07 Tr LY357822 −4.21 −4.41 0.20 Tr Cefuroxime −6.79 −6.96 0.17 Tr LY362546 −4.19 −4.45 0.25 Tr Cephalexin −6.42 −6.33 −0.09 Tr LY366347 −4.14 −4.42 0.28 Tr Cephradine −5.69 −6.39 0.70 Tr LY366349 −4.48 −4.59 0.11 Tr Chlorpromazine −4.70 −4.38 −0.32 Tr LY366659 −4.20 −4.53 0.33 Tr Cimetidine −5.90 −5.43 −0.46 Tr LY366799 −4.54 −4.55 0.02 Tr Ciprofloxacin −5.90 −5.24 −0.66 Tr LY366856 −4.33 −4.55 0.22 Tr Clozapine −4.51 −4.59 0.08 Tr LY368177 −5.15 −4.41 −0.74 Tr Coumarin −4.25 −4.14 −0.11 Tr Mannitol −6.48 −6.90 0.41 Tr Cromolina −6.89 −6.88 0.00 Tr Metformin −6.20 −5.60 −0.60 Tr Cymarin −5.70 −5.74 0.04 Tr Methanol −4.40 −4.55 0.14 Tr Desipramine −4.97 −5.25 0.28 Tr Methotrexate −6.10 −6.65 0.56 Tr Dexamethasone −4.91 −5.24 0.33 Tr Methylprednisolone −4.93 −4.61 −0.32 Tr d-glucose −4.67 −5.82 1.15 Tr Methylscopolamine −6.23 −5.44 −0.79 Tr Diazepam −4.45 −4.75 0.30 Tr Metoprolol −4.60 −5.35 0.75 Tr Diclofenac −4.75 −5.81 1.06 Tr Mibefradil −5.04 −4.62 −0.42 Tr Diltiazem −4.53 −4.76 0.23 Tr Naloxone −4.67 −4.91 0.24 Tr DMP 581 −5.48 −5.70 0.22 Tr Naringenin −4.41 −5.34 0.92 Tr DMP 811 −7.82 −6.03 −1.79 Tr Naringin −6.82 −6.22 −0.60 Tr DMXAA-G −6.52 −6.23 −0.29 Tr N-desmethylclozapine −4.68 −4.72 0.04 Tr Dopamine −5.03 −5.15 0.12 Tr Netivudine −6.84 −6.18 −0.66 Tr DuP 167 −5.11 −5.53 0.42 Tr Nevirapine −4.52 −4.67 0.15 Tr DuP 532 −8.20 −6.74 −1.46 Tr Nicotine −4.71 −4.61 −0.10 Tr DuP 996 −4.62 −4.34 −0.28 Tr Nitrendipine −4.93 −4.90 −0.04 Tr Elarofiban −6.21 −6.08 −0.13 Tr Nordazepan −4.20 −4.57 0.38 Tr Enalapril −6.21 −6.60 0.39 Tr Norfloxacin −6.70 −5.24 −1.46 Tr Enalaprilat −6.59 −6.60 0.01 Tr Octyl gallate −6.82 −5.90 −0.92 Tr Ephedrine −4.97 −4.69 −0.28 Tr Olsalazine −7.80 −6.80 −1.00 Tr Epicatechin −6.82 −6.15 −0.67 Tr ondansetron −4.34 −5.00 0.66 Tr Epicatechin-3-Gallate −6.84 −6.60 −0.24 Tr Ouabain −7.23 −7.92 0.69 Tr Epinephrine −6.23 −5.51 −0.71 Tr Oxacillin −5.58 −5.87 0.30 Tr Erythritol −6.16 −6.15 0.00 Tr Oxprenolol −4.76 −5.20 0.44 Tr Erythromycin −5.78 −6.59 0.80 Tr Oxprenolol ester −4.57 −5.14 0.57 Tr Estradiol −4.69 −4.27 −0.42 Tr PEG 282 −5.84 −6.14 0.30 Tr Etoposide −5.81 −6.24 0.43 Tr PEG 326 −6.35 −6.24 −0.11 Tr EXP3174 −6.74 −6.70 −0.05 Tr PEG 370 −6.68 −6.35 −0.33 Tr Felodipine −4.64 −4.77 0.13 Tr PEG900 −6.26 −6.38 0.12 Tr Flavone −3.33 −4.37 1.03 Tr Penicillin V −7.51 −6.23 −1.28 Tr Formoterol −5.63 −5.80 0.17 Tr pindolol −4.71 −5.47 0.76 Tr foscarnet −7.47 −6.72 −0.75 Tr Piroxicam −4.33 −5.36 1.03 Tr Furosemide −6.62 −6.78 0.16 Tr Pnu200603 −6.47 −5.54 −0.93 Tr Glycine −4.36 −5.32 0.95 Tr Pravastatin −5.84 −6.63 0.79 Tr Prazosin −5.26 −4.95 −0.31
- 4. 110 P. Paixão et al. / European Journal of Pharmaceutical Sciences 41 (2010) 107–117 Table 1 (Continued. ) Table 1 (Continued. ) Dataset Drug Observed Predicted Residue Dataset Drug Observed Predicted Residue Tr Prednisolone −4.72 −4.71 −0.01 Te LY357132 −4.20 −4.35 0.15 Tr Progesterone −4.64 −4.19 −0.45 Te LY362683 −4.43 −4.55 0.12 Tr Propofol −4.77 −4.37 −0.40 Te LY366572 −4.24 −4.51 0.27 Tr Propranolol ester −4.54 −4.97 0.43 Te LY366853 −5.30 −4.72 −0.58 Tr Propylthiouracil −4.46 −4.55 0.09 Te LY368766 −4.07 −4.29 0.23 Tr Proscillaridin −6.41 −5.83 −0.58 Te Metaprotenol −6.42 −5.45 −0.97 Tr Quercetin −6.82 −6.35 −0.47 Te Morphine −5.45 −4.74 −0.71 Tr Quinidine −4.94 −4.44 −0.49 Te Naproxen −4.66 −4.74 0.08 Tr Rapamycin −4.96 −4.62 −0.34 Te Paclitaxel −7.30 −7.18 −0.12 Tr Roxithromycin −6.91 −6.87 −0.05 Te Phenytoin −4.49 −5.15 0.66 Tr Saquinavir −6.48 −6.36 −0.12 Te Pirenzepine −6.36 −4.94 −1.42 Tr SB209670 −5.23 −4.19 −1.04 Te Pivampicillin −4.49 −5.36 0.86 Tr Scopolamine −4.93 −5.03 0.10 Te Propranolol −4.63 −5.09 0.46 Tr SDZ-RAD −4.63 −4.99 0.36 Te Raffinose −7.62 −7.61 0.00 Tr Serotonin −4.86 −5.17 0.30 Te Ranitidine −6.31 −5.58 −0.73 Tr Sulfadiazine −4.75 −5.50 0.74 Te Remikiren −6.34 −5.97 −0.38 Tr Sulfamethoxazole −4.88 −5.78 0.90 Te SB217242 −4.46 −4.24 −0.21 Tr Sulfanilamide −5.26 −5.23 −0.02 Te Sildenafil −4.51 −4.12 −0.39 Tr Sulpiride −6.65 −5.69 −0.96 Te Sotalol −5.76 −5.35 −0.41 Tr Sumatriptan −5.80 −4.91 −0.89 Te Sucrose −5.77 −7.29 1.52 Tr Talinolol −6.11 −5.46 −0.65 Te Sulfasalazine −6.89 −6.91 0.03 Tr TAPP −7.73 −6.51 −1.22 Te Tenidap −4.57 −4.20 −0.37 Tr TArPP −6.12 −7.34 1.22 Te Testosterone −4.43 −4.28 −0.15 Tr Tartaric acid −6.65 −6.75 0.10 Te Tiacrilast −5.07 −4.93 −0.14 Tr Taurocholic acid −4.75 −5.28 0.53 Te Timolol ester −4.67 −4.71 0.04 Tr Telithromycin −6.65 −6.38 −0.27 Te Trovafloxacin −4.81 −5.27 0.45 Tr Telmisartan −4.82 −5.05 0.23 Te Uracil −5.37 −4.58 −0.79 Tr Terbutaline −6.16 −5.38 −0.79 Te Verapamil −4.81 −4.70 −0.11 Tr Tetracycline −5.70 −6.62 0.92 Te Warfarin −4.63 −5.50 0.87 Tr Timolol −4.92 −4.94 0.02 Tr Tiotidine −5.88 −5.95 0.07 Va Acebutolol −6.10 −5.71 −0.38 Tr Topiramate −4.54 −3.94 −0.59 Va Acebutolol ester −4.68 −5.46 0.77 Tr Tranexamic acid −6.28 −5.55 −0.72 Va Acetylsalicylic Acid −5.62 −4.81 −0.81 Tr Trimethoprim −4.50 −4.70 0.19 Va Acrivastine −6.35 −6.03 −0.32 Tr Urea −5.34 −5.71 0.37 Va Aminopyrine −4.44 −5.00 0.56 Tr Valacyclovir −5.20 −5.18 −0.01 Va Benzyl penicillin −6.08 −6.04 −0.04 Tr Valproic acid −4.60 −4.61 0.01 Va Bupropion −4.24 −4.54 0.30 Tr Vinblastine −5.48 −5.64 0.16 Va Chloramphenicol −4.96 −5.35 0.39 Tr XM970 −5.30 −5.92 0.62 Va Clonidine −4.58 −4.82 0.24 Tr Zidovudine −5.06 −5.35 0.29 Va Cortisona −4.69 −4.29 −0.40 Tr Ziprasidone −5.23 −5.08 −0.15 Va Danazol −4.84 −4.39 −0.45 Tr Zomepirac −5.61 −5.66 0.05 Va Dexamethasone- -d-glucoronide −6.38 −5.84 −0.54 Va Dexamethasone-b-d-glucoside −6.83 −7.76 0.93 Te (2E,4Z)-N-I-D-D −3.57 −4.00 0.43 Va DMP 728 −6.58 −6.84 0.26 Te Acyclovir −6.07 −5.51 −0.57 Va Doxorubicin −6.48 −6.25 −0.24 Te Alprenolol −4.57 −5.01 0.44 Va Doxycycline −4.95 −6.60 1.65 Te Alprenolol ester −4.52 −4.98 0.45 Va E3174 −7.30 −6.61 −0.69 Te Amiloride −6.46 −6.52 0.06 Va Fexofenadine −6.51 −6.25 −0.26 Te Amisulpride −5.66 −5.62 −0.03 Va Fluparoxan −4.10 −4.90 0.80 Te Betaxolol −4.91 −5.38 0.46 Va Ganciclovir −6.37 −5.70 −0.68 Te Caffeine −4.48 −4.52 0.04 Va Glipizide −5.97 −5.68 −0.28 Te Caftaric acid −5.41 −7.60 2.19 Va Guanabenz −4.97 −4.89 −0.08 Te Cefazolin −6.23 −6.66 0.43 Va Hydrocortisone −4.82 −4.63 −0.19 Te Cefcapene −6.94 −6.89 −0.04 Va l-DOPA −6.05 −6.25 0.20 Te Cefcapene Pivoxil −5.11 −5.65 0.54 Va Loracarbef −7.34 −6.34 −1.00 Te Cephalexin acetylated −6.63 −6.28 −0.36 Va Losartan −6.05 −6.11 0.06 Te Chlorothiazide −6.72 −5.37 −1.35 Va LY366092 −4.03 −4.42 0.39 Te Cichoric acid −5.13 −7.66 2.54 Va LY366094 −5.22 −4.64 −0.58 Te Cinnamic acid −3.64 −3.80 0.16 Va LY368227 −4.36 −4.51 0.15 Te Corticosterone −4.50 −4.43 −0.07 Va LY368228 −4.37 −4.56 0.20 Te Creatinine −5.95 −4.75 −1.20 Va Meloxicam −4.71 −5.59 0.88 Te Digoxin −5.58 −7.63 2.05 Va Methyl gallate −5.39 −5.61 0.21 Te DMXAA −4.60 −5.06 0.46 Va Metolazone −5.21 −5.30 0.09 Te Echinacoside −6.65 −6.60 −0.05 Va Nadolol −6.14 −5.89 −0.25 Te Famotidine −6.16 −6.68 0.52 Va Oxazepam −4.22 −4.74 0.52 Te fleroxacin −4.98 −5.17 0.19 Va PEG 194 −5.28 −6.02 0.74 Te Fluconazole −4.82 −4.93 0.10 Va PEG 400 −6.98 −6.43 −0.54 Te Gabapentin −8.16 −5.90 −2.25 Va Phencyclidine −4.61 −5.04 0.43 Te Harmalol −6.37 −5.80 −0.56 Va Practolol −6.02 −5.56 −0.45 Te Isoxicam −5.61 −5.71 0.10 Va Propyl gallate −6.82 −5.78 −1.04 Te lidocaine −4.36 −4.53 0.17 Va Salicylic acid −4.82 −4.18 −0.64 Te LY153186 −4.36 −4.50 0.14 Va Sulfapyridine −5.00 −5.35 0.35 Te LY355081 −4.26 −4.41 0.15
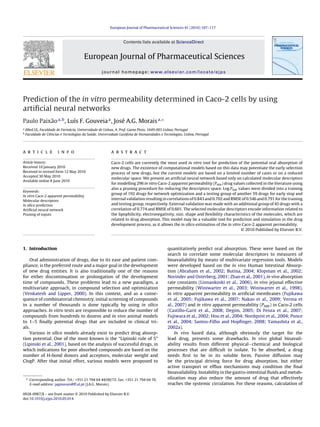
- 5. P. Paixão et al. / European Journal of Pharmaceutical Sciences 41 (2010) 107–117 111 Table 1 (Continued. ) descriptor presenting the worst percent contribution value in this Dataset Drug Observed Predicted Residue group was removed and a new network with n-1 descriptors was build. This procedure was repeated until a significant degradation Va Sulfisoxazole −4.92 −5.84 0.92 Va Theophylline −4.61 −4.20 −0.41 of the RMS with a descriptor removal was observed. Va Tolbutamide −4.28 −5.47 1.19 The second step consisted of the optimization of the network Drugs were randomly divided between a training (TR), testing (TE) and external architecture for the most relevant molecular descriptors. Several validation (VA) group. Mean values after normalization with common drugs with the networks were built varying the number of hidden layers (1–3) work from Yazdanian et al. (1998) are presented in the observed column. Predicted and the number of hidden neurons (1–10) but maintaining the values and the residuals between observed and predicted values, using the 12-6- ratio between the number of patterns to the number of connections 3-3-1 network are also presented. Data values were obtained from references (Alt above 1. et al., 2004; Anand et al., 2003; Artursson et al., 1993; Behrens and Kissel, 2003; Bhardwaj et al., 2005; Caldwell et al., 1998; Cavet et al., 1997; Crowe, 2002; Crowe External validation was made by comparing the ANN predicted and Lemaire, 1998; Da Violante et al., 2004; Ekins et al., 2001; Ertl et al., 2000; values to the observed in vitro values with the drugs in the vali- Fujiwara et al., 2002; Fukada et al., 2002; Furfine et al., 2004; Hartter et al., 2003; dation group, not previously used in the training and optimization He et al., 2004; Hilgendorf et al., 2000; Hu and Borchardt, 1990; Hunter et al., 1993; process. Irvine et al., 1999; Karlsson et al., 1999; Kerns et al., 2004; Khan et al., 2004; Lalloo et al., 2004; Lee et al., 2005; Marino et al., 2005; Markowska et al., 2001; Martel et al., 2003; Masungi et al., 2004; Matthias et al., 2004; Neuhoff et al., 2003; Nishimura 2.4. Statistical analysis et al., 2004; Nordqvist et al., 2004; Oka et al., 2002; Pachot et al., 2003; Pade and Stavchansky, 1998; Polli and Ginski, 1998; Saitoh et al., 2004; Soldner et al., 2000; Correlation between the predicted and observed values was Stenberg et al., 2001; Sun et al., 2003; Tammela et al., 2004; Tannergren, 2004; determined by means of the Pearson correlation coefficient (r) for Tronde, 2002; Vaidyanathan and Walle, 2003; Watson et al., 2001; Wong et al., 2002; Yang and Wang, 2003; Zhou et al., 2004; Camenisch et al., 1998; Gan et al., the training, testing and validation groups for the Log(Papp ) data. 1993; Hou et al., 2004; Laitinen et al., 2003; Miret et al., 2004; Raoof et al., 1996; In order to assess the precision and bias of the network, root mean Ribadeneira et al., 1996; Yazdanian et al., 1998). squared error (RMSE) and mean error (ME) were also estimated. Percentage of correct values within a 10-fold error (difference of log predicted to log observed values outside the interval −1 to 1) error decreases in an early period of training, reaches a minimum was also determined in order to assess the qualitative ability of the and then increases as training goes on, while the training error network. monotonically decreases. Therefore, it is considered better to stop training at an adequate time (Amari et al., 1997), However, the real 3. Results situation is a lot more complex with generalization curves almost always having more than one local minimum (Prechelt, 1998). Optimization of the ANN model was made as described under Due to this fact, each network was run for an excessive number methods. Regarding the reduction of the molecular descriptors of iterations, being kept the iteration that resulted in the lowest space, the removal of correlated and non-discriminatory descrip- normalized data mean square error (RMS) of the testing group. tors reduced the number of descriptors to 79. The next two Additionally, each network was started 15 times with random ini- procedures were performed using an ANN with an architecture of tial values to avoid training convergence to local minima. n-3-2-1, n being the number of molecular descriptors. This ANN Network optimization was performed in a two-step pro- structure was chosen as a compromise between simplicity, in order cess. The first step consisted in the reduction of the molecular to avoid memorisation, and complexity to allow an adequate learn- descriptors space. This was initially done by removing highly cor- ing ability of the network. To escape local minima each network related (r > 0.90) descriptors, allowing the removal of molecular was run multiple times with random initial values. To avoid mem- descriptors with information contained within another descriptor, orisation of data and loss of predictive ability, the learning process and repetitive descriptors (90% or more equal values) removing was early stopped based on the degradation of test RMS error. In the descriptors with non-discriminatory characteristics. In order to end of each descriptor set optimization step, the network with the remove molecular descriptors that were uncorrelated with the lower average test RMS error was kept, and the relative contribu- output variable, the remaining descriptors were tested against a tion of each input on the Log(Papp ) prediction was established using random input variable, considered as a negative control. To accom- the “input node interrogator” option in QNet. In this option, indi- plish this, the inputs were randomly divided in four groups of vidual input contribution is determined by cycling each input for data in order to have sufficient discrimination between the rel- all training patterns and computing the effect on the network’s out- evant and non-relevant descriptors and at the same time a high put response. By comparison with a random input descriptor it was probability of interdependent inputs being present in the same concluded that out of the 79 descriptors randomly distributed in group. These groups of inputs were then tested in an ANN with four groups, 22 were considered non-relevant and were removed, a network architecture of two hidden layers with three hidden since their input contribution was equal or inferior to the random neurons in the first layer and two hidden neurons in the second input. Finally, by the pruning procedure described under methods, layer (n-3-2-1 network). These ANN were optimized for each of the it was observed that the first quartile with 14 descriptors pre- molecular descriptor groups, and the relevance of each descriptor sented the lower training and testing RMS error. The subsequent within each group of inputs was tested against the percent contri- individual input removal resulted that 12 molecular descriptors bution for the final output of the random input variable, the only were needed to characterize the output response, as a degradation inputs being kept were the ones with relevance above this nega- of either the training and testing RMS error was observed when tive control. Next, a pruning procedure was undertaken, using the further removals were undertaken (Fig. 1). The final model was same network architecture and including all the remaining relevant constructed with the 12 molecular descriptors presented in Table 2. molecular descriptors. After optimization of this ANN, the percent Based on these descriptors, a network architecture optimization contribution for the final output was calculated to all descrip- was pursued using a brute force approach. In order to maintain tors and these were organised by quartiles of relative importance. a practical computational time, the network architectural space Three new networks were built and optimized, with the descrip- was swept between 1 and 3 hidden layers. The number of hidden tors grouped based on the quartiles of relevance (Q1, Q2 and Q3), neurons by layer was variable taking into consideration the ratio the quartile group with the lowest test RMS being kept. Finally, the between the number of patterns to the number of connections.
- 6. 112 P. Paixão et al. / European Journal of Pharmaceutical Sciences 41 (2010) 107–117 Table 2 Summary of the 12 molecular descriptors used in the ANN model. Molecular descriptor Description Molecular descriptor Description Log P Octanol:water partition coefficient Te T total size index weighted by atomic Sanderson electronegativities nR09 Number of nine-membered rings Jhetv Balaban-type index from van der Waals weighted distance matrix Hy Hydrophilic Index FDI Folding Degree Index MAXDP Maximal electrotopological positive variation SPH Spherosity TPSA(tot) Topological Polar Surface Area for O, N and S RBF Rotable Bond Fraction nO Number of oxygen atoms in the molecule pKa (acid) pKa of the strongest acidic group Detailed information of the presented molecular descriptors may be obtained in Todeschini and Consonni (2000). This ratio was maintained above 1 in order to reduce the ability of the network to memorise the data and avoid overfitting (So and Richards, 1992; Turner et al., 2004). At the end of the optimization process the networks with the best statistical characteristics in terms of the train correlation, test correlation and test 1 − Log value tolerance were kept and their performance is presented in Table 3. The three networks show iden- tical performances, with similar values for precision and bias in the predicted values for the TR and TE groups of data. The network 12- 6-4-1 presented the best behaviour in terms of the TR group of data but is the less competent in terms of the TE group of data. This is an indication on the dangers of using the training statistics for net- work selection, even when early stopping is made. On the contrary, network 12-6-3-3-1, although the most complex of the three archi- tectures considered, presented the lowest difference between the statistics of the TR and TE groups of data, indicating that overfit- ting was not significant and that probably this network has better prediction characteristics. The ability of the selected networks to predict the Log Papp of new drugs was tested in the 45 drugs presented in the validation Fig. 1. Plot of the performance of the pruning procedure in reducing the molec- group and not previously used in the training process. As can be ular descriptors number both in the training (TR) and in the testing (TE) groups seen (Table 3 and Fig. 2) the network 12-6-3-3-1 presented the best normalized mean square error (RMS). predictions with 91% of drugs well predicted within the ±1−Log tolerance value. It also presented the lower RMSE of the three net- works considered and an insignificant bias in the three groups of data, confirming the better prediction abilities of the 12-6-3-3-1 network. 4. Discussion 4.1. Model data Drug absorption in the GIT is a complex process. Various phys- ical, chemical and biological processes are known to be involved in the overall oral bioavailability of drugs that may condition the movement of compounds from the intestinal lumen to the blood circulation. Permeation in the epithelium lining is, however, one of the major factors governing the drug bioavailability, and the in vitro Caco-2 cell system has been shown to be a suitable model for studies on intestinal drug absorption (Artursson and Karlsson, 1991; Rubas et al., 1993; Yee, 1997). Fig. 2. Plot of the in vitro observed vs. in silico predicted Log Papp (cm/s) values for We collected a large database of drug and drug-like Papp Caco-2 the 12-6-3-3-1 ANN model. Solid line represents the line of unity and the dashed values described in the literature. Examples of drugs absorbed by lines the ±1 Log tolerance value. Closed circles are indicative of drugs in the training all mechanisms of membrane movement were included. However, group and open circles represent drugs in the testing group. Grey marks are relative when concentration-dependent Papp values were described, data to the external validation group. was collected in the saturation zone in order to primarily consider the passive diffusion process of drug absorption. Various studies Caco-2 cells by Neuhoff et al. (Neuhoff et al., 2003). It is also demon- have enlightened the fact that variability within and between lab- strated that ideal passage numbers would be inside the interval oratories may condition the creation of large databases of Papp of 28–65 with significant differences in TEER in higher passages values from Caco-2 cells (Sun et al., 2002; Volpe, 2007). Reasons (Briske-Anderson et al., 1997). Cell culture time also influences for this variability may be related to differences in the experimen- the morphology, formation of tight junctions and membrane pro- tal conditions and with heterogeneity of the cell lines. The effect of teins expression, and the complete differentiation of Caco-2 cells is pH in the permeability of drugs, as expected by the Brodie the- described to be achieved only after 21 days in culture (Behrens and ory (Jollow and Brodie, 1972), was experimentally described in Kissel, 2003). Some authors have previously dealt with the issue
- 7. P. Paixão et al. / European Journal of Pharmaceutical Sciences 41 (2010) 107–117 113 Table 3 Statistical evaluation of the performance of the best three ANN to predict Log Papp values based on the molecular descriptors for the training, testing and external validation datasets. Network TR TE VAL Corr Tol RMSE ME Corr Tol RMSE ME Corr Tol RMSE ME 12-3-3-1 0.893 95.8 0.458 0.000 0.709 81.4 0.766 −0.064 0.717 88.9 0.679 0.060 12-6-4-1 0.919 97.9 0.400 0.003 0.675 78.0 0.809 −0.042 0.763 88.9 0.636 −0.068 12-6-3-3-1 0.843 92.2 0.546 0.001 0.702 86.4 0.791 −0.058 0.774 91.1 0.601 −0.043 Corr, correlation coefficient; Tol, % of correct values within ±1 Log value; RMSE, root mean squared error; ME, mean error. of variability between different laboratories in their QSAR works. was used in order to reduce the effective size of each parameter. Yamashita et al (Yamashita et al., 2002a) proposed the “latent mem- Early stop has shown to be an effective procedure to decrease the brane permeability” concept, assuming that all Caco-2 permeability generalization error when the number of training cases is not much datasets share a hidden, common relationship between their mem- bigger than the number of modified parameters (Amari et al., 1997). brane permeability and physicochemical properties. In practice, The results obtained seem to confirm that overfitting did not occur, the authors made an iterative normalization between the origi- as the statistics of the training and testing group of data for the three nal data sources in order to reduce variability and concluded for best ANN architectures are not different (Table 3). We also tried to their applicability in QSAR analysis. Fujiwara et al. (Fujiwara et al., minimise overfitting by reducing the number of dimensions of the 2002) made an analysis of variance for the residual sum of squares parameter space, using a sensitivity-based pruning procedure. As between before and after taking each sub-dataset in their QSAR can be seen in Fig. 1 and as described by others (Tetko et al., 1996), model, and concluded that none of the sub-dataset was signifi- reducing the number of descriptors resulted in a better prediction cantly different from the rest of the entire dataset. The authors did ability of the ANN as judged by the RMS of the testing group of data. not indicate any particular rationale in their data collection. In our However, by removing more than 12 descriptors, an evident loss of case, by including drugs from studies with similar experimental both training and prediction ability was observed. protocols, as described under methods, part of the described vari- Although the data in the testing group was not used to train the ability is expected to be reduced. Additionally, normalization by network, if used to test the predictive performance of the method, common drugs of the different sources of data from the data source like a “leave-one-out” approach, a weak form of validation would with the largest number of molecules, the experimental RMSE was be obtained and ideally an external group of data should be used reduced from 0.427 to 0.367. (Ekins, 2003). Evaluation of the external validation group statistics for the ANN 12-6-3-3-1 (Table 3) clearly shows that this model contains good prediction properties with a RMSE value less than the 4.2. Model building and validation double of the experimental error (0.367 vs. 0.601), an acceptable performance for a QSAR method (Dearden and Worth, 2007). We used a multilayer feedforward backpropagation neural modelling system in order to build a QSAR model to relate molec- ular descriptors to Papp values as this type of modelling approach 4.3. Comparison with other approaches has shown its superiority over other multivariate methods in QSAR when non-linear relations exist (Sutherland et al., 2004; Winkler, Since the initial efforts of Palm et al. (Palm et al., 1996), various 2004). However, like other regression methods, neural networks authors have proposed in silico models to predict the in vitro Caco-2 are prone to overfitting and validation problems. To overcome this, permeability of drugs (Table 4). Yamashita et al. (Yamashita et al., a training group of data with 192 drugs was used to provide infor- 2002b) used a genetic-algorithm-based partial least squares (GA- mation to the network, and a testing group with 59 drugs to indicate PLS) based on Log Papp values of 73 drugs resulting in a model with where overfitting begins, finalising the training process. In order to r = 0.886 and standard deviation (SE) = 0.389. Validation was made validate the model, we used an external validation dataset with 45 by a “leave-some-out” procedure with an r = 0.825 and SE = 0.474. drugs. As a primary approach to overcome overfitting, early stop Hou et al. (Hou et al., 2004) used multiple linear regression (MLR) Table 4 Summary of several previously published in silico methods to predict Caco-2 Log Papp . Reference Method Group n Correlation (r) Precision (SE) Yamashita et al. GA-PLS TR 73 0.89 0.39 VA LOO 0.83 0.47 Hou et al. MLR TR 77 0.85 0.41 VA 23 0.78 0.49 Guangli and Yiyu SVM TR 77 0.88 0.36a VA 23 0.85 0.52a Castillo-Garit et al. MLR TR 75 0.85 0.43 VA 19 0.71 0.51 Fujiwara et al. ANN TR 87 0.79 0.44a VA LOO NR 0.51a Degim ANN TR 50 0.98 0.19 VA 7 0.86 0.46 Di Fenza et al. GA-ANN TR 1 106 0.72 NR VA 50 0.40 NR TR 2 101 0.75 NR VA 50 0.61 NR LOO, leave-one-out; NR, not reported. a RMSE.
- 8. 114 P. Paixão et al. / European Journal of Pharmaceutical Sciences 41 (2010) 107–117 Fig. 3. ANN interaction trends between the (A) Log P and Hy, (B) FDI and SPH, (C) TPSA(tot) and nO and (D) Te and pKa (acid), in the Log Papp prediction, maintaining all other descriptors constant as median values. with 100 diverse drugs resulting in an r = 0.85 and SE = 0.41 in the experimental error are indicative of a possible situation of over- training group of 77 drugs and r = 0.78 and SE = 0.49 in the val- fitting in the model. Finally, Di Fenza et al. (Di Fenza et al., 2007) idation group of 23 drugs. Guangli and Yiyu (Guangli and Yiyu, used an ANN coupled with a genetic algorithm (GA-ANN) search 2006) with the same dataset but using a support vector machine to optimize and correlate Volsurf descriptors to Papp values in two (SVM) method obtained an r = 0.88 and RMSE = 0.361 for the train- proprietary set of 106 NK-2 receptors antagonists (TR 1) and 101 ing and r = 0.85 and RMSE = 0.518 for the validation group of data. compounds with anti-tumour activity (TR 2). Authors reported an Close inspection of the data revealed, however, that the validation r = 0.75 in a “leave-14%-out” test for their best model, but due to data was overpredicted with a mean error of 0.11, especially at a strong structure similarity in the training data, the model only the lower end of permeability values. Again with the same dataset provided an r = 0.61 in an external dataset. but using atom-based stochastic and non-stochastic linear indices Direct comparison between our proposed approach with these as molecular descriptors, Castillo-Garit et al. (Castillo-Garit et al., previous models is difficult as an independent external validation 2008) used MLR resulting in an r = 0.85 and SE = 0.43 in the training group of data would be required. However, our model presents group of data, after the removal of two outliers. Validation group, similar statistical performance to the formers with a significantly with only 19 drugs, presented an r = 0.71 and SE = 0.51. Fujiwara et larger dataset of drugs. Moreover, the fact that an external valida- al. (Fujiwara et al., 2002) used an ANN to correlate five molecular tion was made in our ANN model is an additional indication that it descriptors to Log Papp values in 87 drugs. They reported a correla- bears good predictive abilities. tion coefficient of 0.79 for the whole dataset and a RMSE of 0.435 and 0.507 for the entire dataset and for the leave-one-out cross- 4.4. Model interpretation validation. The authors also concluded for superior results with their ANN model when comparing with a multiple linear regres- When considering the relevant molecular descriptors (Table 2), sion analysis in the same dataset. In another study, Degim (Degim, they can be grouped in terms of lipophilicity, electronegativity, 2005) also used an ANN to correlate four molecular descriptors to size, shape and flexibility characteristics of the molecules, and are Log Papp values in 50 drugs. The author reported an r = 0.976 and in agreement with the expected physical forces involved in drug a SE = 0.188 in the training group. ANN performance in a valida- absorption (Stenberg et al., 2002). Log P is a measure of lipophilic- tion group of seven drugs was not so effective with an r = 0.856 and ity and has been used in various studies regarding drug absorption a SE = 0.457, that together with the training SE below the typical (Egan et al., 2000; Lipinski et al., 2001; Winiwarter et al., 1998).
- 9. P. Paixão et al. / European Journal of Pharmaceutical Sciences 41 (2010) 107–117 115 nR09 is the number of cyclic structures containing nine carbon 5. Conclusions atoms in a molecule, and besides its simple structural character- ization, it may also be a measure of either size or lipophilicity. In conclusion, we presented an ANN methodology based on a Hy is a simple empirical index related to hydrophilicity of com- pruning procedure to reduce the descriptors space, and using an pounds based on count descriptors (Todeschini and Consonni, early stop approach that produced a robust and logical model with 2000). MAXDP, which represents the maximum positive intrin- good predictive abilities. Comparison of our model with the previ- sic state difference and can be related to the electrophilicity of ously reported ANN models also stresses its characteristics. It was the molecule (Gramatica et al., 2000), is directly related with the build with more drugs than the method of Fujiwara et al. (Fujiwara electronegativity and water solubility of the molecule. TPSA(tot) is et al., 2002), with an external validation with similar statistics of the defined as the part of the surface area of the molecule associated authors own “leave-one-out” cross-validation. Additionally, it was with O, N, S and the H bonded to any of these atoms, and is related to not overfitted as the model of Degim (Degim, 2005) appears to be the hydrogen bonding ability of the molecule. nO is a count descrip- and it provides a larger chemical space than the model developed tor that indicates the number of O atoms in a molecule. Solubility by Di Fenza et al. (Di Fenza et al., 2007). The presented methodology (Martini et al., 1999), PSA and simple atom counts related to the also provides some advantages over these same reports. Early stop H-bonding capacity were extensively used to predict drug absorp- provided an efficient training procedure to reduce the overfitting tion in various studies (Hou et al., 2004; Kelder et al., 1999; Palm problem of the ANN. Pruning of the molecular inputs, in order to et al., 1997; Winiwarter et al., 2003; Winiwarter et al., 1998). Te is reduce the molecular space, resulted in a low computational inten- a WHIM descriptor and Jhetv is a Balaban type index both related sive approach still capable to select molecular descriptors that are with the molecular size. FDI and SPH are both shape descriptors known to be related with the drug absorption process. Overall, this indicating, respectively, if a molecule is folded or linear and flat approach may be a useful prediction tool in the initial screening of or spherical. RBF indicates the number of bonds which allow free compounds. rotation around themselves weighted by the total number of bonds, and is a measure of molecular flexibility (Todeschini and Consonni, Acknowledgment 2000). Both size and flexibility have also been correlated with drug absorption previously (Hou et al., 2004; Lipinski et al., 2001). This work was partially supported by project number pKa (acid) is the pKa of the strongest acid group in the molecule. SFRH/BD/28545/2006 from Fundacão para a Ciência e a Tecnologia. ¸ Interpretation of the individual descriptors in an ANN, due to the “black-box” nature of this approach, is frequently described as difficult. One possible approach to overcome this issue is to find Appendix A. Supplementary data how input trends interact with output predictions. This was done by varying some selected inputs at a time, considering all the others Supplementary data associated with this article can be found, constant with the median value. Fig. 3A) presents the relation- in the online version, at doi:10.1016/j.ejps.2010.05.014. ship between Log P and Hy. Log P relates positively with Log Papp as various authors have shown (Egan et al., 2000; Hou et al., 2004; References Norinder and Osterberg, 2001), but at values for Log P > 5 the effect reaches a plateau, which is in accordance with the “Lipinsky’s rule Abraham, M.H., Ibrahim, A., Zissimos, A.M., Zhao, Y.H., Comer, J., Reynolds, D.P., 2002. of five” (Lipinski et al., 2001). Hy relates negatively with Log Papp , Application of hydrogen bonding calculations in property based drug design. Drug Discov. Today 7, 1056–1063. as the more hydrophilic the molecule, the lower the permeabil- Alt, A., Potthast, H., Moessinger, J., Sickmuller, B., Oeser, H., 2004. Biopharmaceutical ity value. Fig. 3B shows the relationship between the FDI and SPH characterization of sotalol-containing oral immediate release drug products. descriptors and may be an indication of the molecular behaviour in Eur. J. Pharm. Biopharm. 58, 145–150. Amari, S., Murata, N., Muller, K.R., Finke, M., Yang, H.H., 1997. Asymptotic statisti- the paracellular route of absorption. As seen, when neither folded cal theory of overtraining and cross-validation. IEEE Trans. Neural Network 8, (FDI close to 1) nor spherical (SPH close to 0), the molecule presents 985–996. a lower Log Papp value. Fig. 3C presents the relationship between Anand, B.S., Patel, J., Mitra, A.K., 2003. Interactions of the dipeptide ester prodrugs of acyclovir with the intestinal oligopeptide transporter: competitive inhibition TPSA(tot) and nO and, as visible, Log Papp values decrease with both of glycylsarcosine transport in human intestinal cell line-Caco-2. J. Pharmacol. the increase in TPSA(tot) and nO. It has been suggested that PSA in Exp. Ther. 304, 781–791. some way describes the desolvation of a compound as it moves Artursson, P., Karlsson, J., 1991. Correlation between oral drug absorption in humans from an aqueous to a lipid environment (van de Waterbeemd et and apparent drug permeability coefficients in human intestinal epithelial (Caco-2) cells. Biochem. Biophys. Res. Commun. 175, 880–885. al., 1998) and it has been described that drugs with less than 10% Artursson, P., Ungell, A.L., Lofroth, J.E., 1993. Selective paracellular permeability in absorption had PSA values above 140 Å (Palm et al., 1997). nO is a two models of intestinal absorption: cultured monolayers of human intestinal simple descriptor that may also be related to the H-bonding ability epithelial cells and rat intestinal segments. Pharm. Res. 10, 1123–1129. Behrens, I., Kissel, T., 2003. Do cell culture conditions influence the carrier-mediated of the molecule, and its increased size, like the increase of the sum transport of peptides in Caco-2 cell monolayers? Eur. J. Pharm. Sci. 19, 433–442. of H-bond donors and acceptors, relates negatively with Log Papp Bhardwaj, R.K., Herrera-Ruiz, D., Sinko, P.J., Gudmundsson, O.S., Knipp, G., 2005. (Winiwarter et al., 1998). Fig. 3D shows the relationship between Delineation of human peptide transporter 1 (hPepT1)-mediated uptake and transport of substrates with varying transporter affinities utilizing stably the Te and pKa (acid) descriptors. Te is a molecular descriptor closely transfected hPepT1/Madin–Darby canine kidney clones and Caco-2 cells. J. Phar- related to the molecular weight and its increase, as reported early macol. Exp. Ther. 314, 1093–1100. (Fagerholm et al., 1999; Lipinski et al., 2001), resulted in a lower Briske-Anderson, M.J., Finley, J.W., Newman, S.M., 1997. The influence of culture time and passage number on the morphological and physiological development Log Papp value. pKa (acid) indicates that acids with pKa values below of Caco-2 cells. Proc. Soc. Exp. Biol. Med. 214, 248–257. 7 are generally badly absorbed. This may not be completely related Butina, D., 2004. Performance of Kier-hall E-state descriptors in quantitative with the “pH’s partitioning hypotheses” as the pKa (basic) did not structure activity relationship (QSAR) studies of multifunctional molecules. Molecules 9, 1004–1009. seem to be an important descriptor for Log Papp . Martin (Martin, Caldwell, G.W., Easlick, S.M., Gunnet, J., Masucci, J.A., Demarest, K., 1998. In vitro 2005) also reported a difference in absorption between anions permeability of eight beta-blockers through Caco-2 monolayers utilizing liquid and the remaining classes of molecules that resulted in different chromatography/electrospray ionization mass spectrometry. J. Mass Spectrom. absorption rules. One possible explanation for this effect may be 33, 607–614. Camenisch, G., Alsenz, J., van de Waterbeemd, H., Folkers, G., 1998. Estimation of per- related to the electrostatic repulsion between a negatively charged meability by passive diffusion through Caco-2 cell monolayers using the drugs’ molecule and the also negatively charge enterocyte. lipophilicity and molecular weight. Eur. J. Pharm. Sci. 6, 317–324.
- 10. 116 P. Paixão et al. / European Journal of Pharmaceutical Sciences 41 (2010) 107–117 Castillo-Garit, J.A., Marrero-Ponce, Y., Torrens, F., Garcia-Domenech, R., 2008. Hunter, J., Jepson, M.A., Tsuruo, T., Simmons, N.L., Hirst, B.H., 1993. Functional Estimation of ADME properties in drug discovery: predicting Caco-2 cell perme- expression of P-glycoprotein in apical membranes of human intestinal Caco- ability using atom-based stochastic and non-stochastic linear indices. J. Pharm. 2 cells. Kinetics of vinblastine secretion and interaction with modulators. J. Biol. Sci. 97, 1946–1976. Chem. 268, 14991–14997. Cataltepe, Z., Abu-Mostafa, Y.S., Magdon-Ismail, M., 1999. No free lunch for early Irvine, J.D., Takahashi, L., Lockhart, K., Cheong, J., Tolan, J.W., Selick, H.E., Grove, J.R., stopping. Neural Comput. 11, 995–1009. 1999. MDCK (Madin–Darby canine kidney) cells: a tool for membrane perme- Cavet, M.E., West, M., Simmons, N.L., 1997. Transepithelial transport of the fluoro- ability screening. J. Pharm. Sci. 88, 28–33. quinolone ciprofloxacin by human airway epithelial Calu-3 cells. Antimicrob. Jollow, D.J., Brodie, B.B., 1972. Mechanisms of drug absorption and of drug solution. Agents Chemother. 41, 2693–2698. Pharmacology 8, 21–32. Crowe, A., 2002. The influence of P-glycoprotein on morphine transport in Caco-2 Karlsson, J., Ungell, A., Grasjo, J., Artursson, P., 1999. Paracellular drug transport cells. Comparison with paclitaxel. Eur. J. Pharmacol. 440, 7–16. across intestinal epithelia: influence of charge and induced water flux. Eur. J. Crowe, A., Lemaire, M., 1998. In vitro and in situ absorption of SDZ-RAD using a Pharm. Sci. 9, 47–56. human intestinal cell line (Caco-2) and a single pass perfusion model in rats: Kelder, J., Grootenhuis, P.D.J., Bayada, D.M., Delbressine, L.P.C., Ploemen, J.P., 1999. comparison with rapamycin. Pharm. Res. 15, 1666–1672. Polar molecular surface as a dominating determinant for oral absorption and Da Violante, G., Zerrouk, N., Richard, I., Frendo, J.L., Zhiri, A., Li-Khuan, R., Tricottet, brain penetration of drugs. Pharm. Res. 16, 1514–1519. V., Provot, G., Chaumeil, J.C., Arnaud, P., 2004. Short term Caco-2/TC7 cell cul- Kerns, E.H., Di, L., Petusky, S., Farris, M., Ley, R., Jupp, P., 2004. Combined applica- ture: comparison between conventional 21-d and a commercially available 3-d tion of parallel artificial membrane permeability assay and Caco-2 permeability system. Biol. Pharm. Bull. 27, 1986–1992. assays in drug discovery. J. Pharm. Sci. 93, 1440–1453. Dearden, J., Worth, A., 2007. In Silico Prediction of Physicochemical Properties. JRC Khan, S.I., Abourashed, E.A., Khan, I.A., Walker, L.A., 2004. Transport of harman alka- Scientific and Technical Reports. European Commission, Luxembourg. loids across Caco-2 cell monolayers. Chem. Pharm. Bull. (Tokyo) 52, 394–397. Degim, Z., 2005. Prediction of permeability coefficients of compounds through Caco- Klopman, G., Stefan, L.R., Saiakhov, R.D., 2002. ADME evaluation. 2. A computer 2 cell monolayer using artificial neural network analysis. Drug Dev. Ind. Pharm. model for the prediction of intestinal absorption in humans. Eur. J. Pharm. Sci. 31, 935–942. 17, 253–263. Di Fenza, A., Alagona, G., Ghio, C., Leonardi, R., Giolitti, A., Madami, A., 2007. Caco- Laitinen, L., Kangas, H., Kaukonen, A.M., Hakala, K., Kotiaho, T., Kostiainen, R., Hirvo- 2 cell permeability modelling: a neural network coupled genetic algorithm nen, J., 2003. N-in-one permeability studies of heterogeneous sets of compounds approach. J. Comput. Aided Mol. Des. 21, 207–221. across Caco-2 cell monolayers. Pharm. Res. 20, 187–197. Egan, W.J., Merz, K.M., Baldwin, J.J., 2000. Prediction of drug absorption using mul- Lalloo, A.K., Luo, F.R., Guo, A., Paranjpe, P.V., Lee, S.H., Vyas, V., Rubin, E., Sinko, tivariate statistics. J. Med. Chem. 43, 3867–3877. P.J., 2004. Membrane transport of camptothecin: facilitation by human P- Ekins, S., 2003. In silico approaches to predicting drug metabolism, toxicology and glycoprotein (ABCB1) and multidrug resistance protein 2 (ABCC2). BMC Med. beyond. Biochem. Soc. Trans. 31, 611–614. 2, 16. Ekins, S., Durst, G.L., Stratford, R.E., Thorner, D.A., Lewis, R., Loncharich, R.J., Wikel, Lee, K.J., Johnson, N., Castelo, J., Sinko, P.J., Grass, G., Holme, K., Lee, Y.H., 2005. Effect J.H., 2001. Three-dimensional quantitative structure-permeability relationship of experimental pH on the in vitro permeability in intact rabbit intestines and analysis for a series of inhibitors of rhinovirus replication. J. Chem. Inf. Comput. Caco-2 monolayer. Eur. J. Pharm. Sci. 25, 193–200. Sci. 41, 1578–1586. Linnankoski, J., Makela, J.M., Ranta, V.P., Urtti, A., Yliperttula, M., 2006. Computa- Ertl, P., Rohde, B., Selzer, P., 2000. Fast calculation of molecular polar surface area as tional prediction of oral drug absorption based on absorption rate constants in a sum of fragment-based contributions and its application to the prediction of humans. J. Med. Chem. 49, 3674–3681. drug transport properties. J. Med. Chem. 43, 3714–3717. Lipinski, C.A., Lombardo, F., Dominy, B.W., Feeney, P.J., 2001. Experimental and com- Fagerholm, U., Nilsson, D., Knutson, L., Lennernas, H., 1999. Jejunal permeability in putational approaches to estimate solubility and permeability in drug discovery humans in vivo and rats in situ: investigation of molecular size selectivity and and development settings. Adv. Drug Deliv. Rev. 46, 3–26. solvent drag. Acta Physiol. Scand. 165, 315–324. Marino, A.M., Yarde, M., Patel, H., Chong, S., Balimane, P.V., 2005. Validation of the Fujikawa, M., Ano, R., Nakao, K., Shimizu, R., Akamatsu, M., 2005. Relationships 96 well Caco-2 cell culture model for high throughput permeability assessment between structure and high-throughput screening permeability of diverse drugs of discovery compounds. Int. J. Pharm. 297, 235–241. with artificial membranes: application to prediction of Caco-2 cell permeability. Markowska, M., Oberle, R., Juzwin, S., Hsu, C.P., Gryszkiewicz, M., Streeter, A.J., 2001. Bioorg. Med. Chem. 13, 4721–4732. Optimizing Caco-2 cell monolayers to increase throughput in drug intestinal Fujikawa, M., Nakao, K., Shimizu, R., Akamatsu, M., 2007. QSAR study on permeability absorption analysis. J. Pharmacol. Toxicol. Methods 46, 51–55. of hydrophobic compounds with artificial membranes. Bioorg. Med. Chem. 15, Martel, F., Monteiro, R., Lemos, C., 2003. Uptake of serotonin at the apical and baso- 3756–3767. lateral membranes of human intestinal epithelial (Caco-2) cells occurs through Fujiwara, S., Yamashita, F., Hashida, M., 2002. Prediction of Caco-2 cell permeability the neuronal serotonin transporter (SERT). J. Pharmacol. Exp. Ther. 306, 355– using a combination of MO-calculation and neural network. Int. J. Pharm. 237, 362. 95–105. Martin, Y.C., 2005. A bioavailability score. J. Med. Chem. 48, 3164–3170. Fukada, A., Saito, H., Inui, K., 2002. Transport mechanisms of nicotine across Martini, L.G., Avontuur, P., George, A., Willson, R.J., Crowley, P.J., 1999. Solubility the human intestinal epithelial cell line Caco-2. J. Pharmacol. Exp. Ther. 302, parameter and oral absorption. Eur. J. Pharm. Biopharm. 48, 259–263. 532–538. Masungi, C., Borremans, C., Willems, B., Mensch, J., Van Dijck, A., Augustijns, P., Brew- Furfine, E.S., Baker, C.T., Hale, M.R., Reynolds, D.J., Salisbury, J.A., Searle, A.D., Studen- ster, M.E., Noppe, M., 2004. Usefulness of a novel Caco-2 cell perfusion system. I. berg, S.D., Todd, D., Tung, R.D., Spaltenstein, A., 2004. Preclinical pharmacology In vitro prediction of the absorption potential of passively diffused compounds. and pharmacokinetics of GW433908, a water-soluble prodrug of the human J. Pharm. Sci. 93, 2507–2521. immunodeficiency virus protease inhibitor amprenavir. Antimicrob. Agents Matthias, A., Blanchfield, J.T., Penman, K.G., Toth, I., Lang, C.S., De Voss, J.J., Lehmann, Chemother. 48, 791–798. R.P., 2004. Permeability studies of alkylamides and caffeic acid conjugates from Galinis-Luciani, D., Nguyen, L., Yazdanian, M., 2007. Is PAMPA a useful tool for dis- echinacea using a Caco-2 cell monolayer model. J. Clin. Pharm. Ther. 29, 7–13. covery? J. Pharm. Sci. 96, 2886–2892. Miret, S., Abrahamse, L., de Groene, E.M., 2004. Comparison of in vitro models for Gan, L.S., Hsyu, P.H., Pritchard, J.F., Thakker, D., 1993. Mechanism of intestinal the prediction of compound absorption across the human intestinal mucosa. J. absorption of ranitidine and ondansetron: transport across Caco-2 cell mono- Biomol.Screen 9, 598–606. layers. Pharm. Res. 10, 1722–1725. Nakao, K., Fujikawa, M., Shimizu, R., Akamatsu, M., 2009. QSAR application for the Gramatica, P., Corradi, M., Consonni, V., 2000. Modelling and prediction of soil prediction of compound permeability with in silico descriptors in practical use. sorption coefficients of non-ionic organic pesticides by molecular descriptors. J. Comput. Aided Mol. Des. 23, 309–319. Chemosphere 41, 763–777. Neuhoff, S., Ungell, A.L., Zamora, I., Artursson, P., 2003. pH-dependent bidirectional Guangli, M., Yiyu, C., 2006. Predicting Caco-2 permeability using support vector transport of weakly basic drugs across Caco-2 monolayers: implications for machine and chemistry development kit. J. Pharm. Pharm. Sci. 9, 210–221. drug-drug interactions. Pharm. Res. 20, 1141–1148. Hartter, S., Huwel, S., Lohmann, T., Abou El Ela, A., Langguth, P., Hiemke, C., Galla, Nishimura, N., Naora, K., Uemura, T., Hirano, H., Iwamoto, K., 2004. Transepithelial H.J., 2003. How does the benzamide antipsychotic amisulpride get into the permeation of tolbutamide across the human intestinal cell line, Caco-2. Drug brain?—an in vitro approach comparing amisulpride with clozapine. Neuropsy- Metab. Pharmacokinet. 19, 48–54. chopharmacology 28, 1916–1922. Nordqvist, A., Nilsson, J., Lindmark, T., Eriksson, A., Garberg, P., Kihlen, M., 2004. A He, X., Sugawara, M., Takekuma, Y., Miyazaki, K., 2004. Absorption of ester pro- general model for prediction of Caco-2 cell permeability. Qsar Comb. Sci. 23, drugs in Caco-2 and rat intestine models. Antimicrob. Agents Chemother. 48, 303–310. 2604–2609. Norinder, U., Osterberg, T., 2001. Theoretical calculation and prediction of drug Hilgendorf, C., Spahn-Langguth, H., Regardh, C.G., Lipka, E., Amidon, G.L., Langguth, transport processes using simple parameters and partial least squares projec- P., 2000. Caco-2 versus Caco-2/HT29-MTX co-cultured cell lines: permeabilities tions to latent structures (PLS) statistics. The use of electrotopological state via diffusion, inside- and outside-directed carrier-mediated transport. J. Pharm. indices. J. Pharm. Sci. 90, 1076–1085. Sci. 89, 63–75. Oka, A., Oda, M., Saitoh, H., Nakayama, A., Takada, M., Aungst, B.J., 2002. Secretory Hou, T.J., Zhang, W., Xia, K., Qiao, X.B., Xu, X.J., 2004. ADME evaluation in drug dis- transport of methylprednisolone possibly mediated by P-glycoprotein in Caco-2 covery. 5. Correlation of Caco-2 permeation with simple molecular properties. cells. Biol. Pharm. Bull. 25, 393–396. J. Chem. Inf. Comput. Sci. 44, 1585–1600. Pachot, J.I., Botham, R.P., Haegele, K.D., Hwang, K., 2003. Experimental estimation of Hu, M., Borchardt, R.T., 1990. Mechanism of L-alpha-methyldopa transport through the role of P-Glycoprotein in the pharmacokinetic behaviour of telithromycin, a monolayer of polarized human intestinal epithelial cells (Caco-2). Pharm. Res. a novel ketolide, in comparison with roxithromycin and other macrolides using 7, 1313–1319. the Caco-2 cell model. J. Pharm. Pharm. Sci. 6, 1–12.