1. Monthly Inventory AnalysisData from the The Oklahoma Association of REALTORS®
Area Delimited by Entire OK State MLS -
Single-Family Property Type
June 2013
Report Produced on: Jul 29, 2013
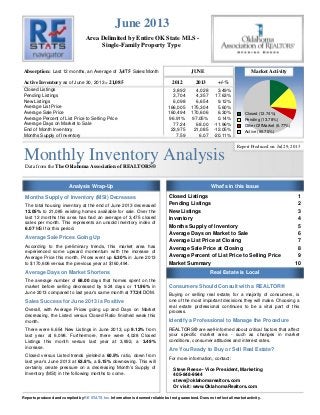
Absorption:
Active Inventory
3,475
21,085
JUNE Market Activity
2012 2013 +/-%
Last 12 months, an Average of Sales/Month
as of June 30, 2013 =
Closed Listings
Pending Listings
New Listings
Average List Price
Average Sale Price
Average Percent of List Price to Selling Price
Average Days on Market to Sale
End of Month Inventory
Months Supply of Inventory
Closed Listings 1
Pending Listings 2
New Listings 3
Inventory 4
Months Supply of Inventory 5
Average Days on Market to Sale 6
Average List Price at Closing 7
Average Sale Price at Closing 8
Average Percent of List Price to Selling Price 9
Market Summary 10
3,892 4,028 3.49%
3,704 4,357 17.63%
6,098 6,654 9.12%
166,005 175,304 5.60%
160,494 170,606 6.30%
96.91% 97.05% 0.14%
77.24 68.00 -11.96%
23,975 21,085 -12.05%
7.59 6.07 -20.11%
Analysis Wrap-Up What's in this Issue
Real Estate is Local
Closed (12.74%)
Pending (13.78%)
Other OffMarket (6.77%)
Active (66.70%)
Months Supply of Inventory (MSI) Decreases
The total housing inventory at the end of June 2013 decreased
12.05% to 21,085 existing homes available for sale. Over the
last 12 months this area has had an average of 3,475 closed
sales per month. This represents an unsold inventory index of
6.07 MSI for this period.
Average Sale Prices Going Up
According to the preliminary trends, this market area has
experienced some upward momentum with the increase of
Average Price this month. Prices went up 6.30% in June 2013
to $170,606 versus the previous year at $160,494.
Average Days on Market Shortens
The average number of 68.00 days that homes spent on the
market before selling decreased by 9.24 days or 11.96% in
June 2013 compared to last year’s same month at 77.24 DOM.
Sales Success for June 2013 is Positive
Overall, with Average Prices going up and Days on Market
decreasing, the Listed versus Closed Ratio finished weak this
month.
There were 6,654 New Listings in June 2013, up 9.12% from
last year at 6,098. Furthermore, there were 4,028 Closed
Listings this month versus last year at 3,892, a 3.49%
increase.
Closed versus Listed trends yielded a 60.5% ratio, down from
last year’s June 2013 at 63.8%, a 5.15% downswing. This will
certainly create pressure on a decreasing Month’s Supply of
Inventory (MSI) in the following months to come.
Consumers Should Consult with a REALTOR®
Buying or selling real estate, for a majority of consumers, is
one of the most important decisions they will make. Choosing a
real estate professional continues to be a vital part of this
process.
Identify a Professional to Manage the Procedure
REALTORS® are well-informed about critical factors that affect
your specific market area - such as changes in market
conditions, consumer attitudes and interest rates.
Are You Ready to Buy or Sell Real Estate?
For more information, contact:
Steve Reese - Vice President, Marketing
405-848-9944
steve@oklahomarealtors.com
Or visit: www.OklahomaRealtors.com
Reports produced and compiled by Information is deemed reliable but not guaranteed. Does not reflect all market activity.RE STATS Inc.
2. Monthly Inventory Analysis
The Oklahoma Association of
REALTORS®
June 2013
ClosedListings
Closed Listings
ReadytoBuyorSellRealEstate?
ContactanexperiencedREALTOR
Data from the
Area Delimited by Entire OK State MLS - Single-Family Property Type
Closed Sales as of Jul 24, 2013
Report Produced on: Jul 29, 2013
JUNE YEAR TO DATE (YTD)
5 YEAR MARKET ACTIVITY TRENDS 5yr JUN AVG = 3,818 3 MONTHS
CLOSED LISTINGS & BEDROOMS DISTRIBUTION BY PRICE
High
Low
May 2013 = 4,128
Jan 2010 = 1,697
Closed Listingsthis
month at
above the 5 yr JUN
average of
4,028,
3,818
A
P
R
M
A
Y
J
U
N
Distribution of Closed Listings by Price Range % AVDOM 2 Beds 3 Beds 4 Beds 5 Beds+
2009
3,897
2010
3,798
2011
3,477
2012
3,892
2013
4,028
1 Year
2 Year
+3.49%
+15.85%
2009
17,453
2010
18,680
2011
16,730
2012
19,699
2013
20,914
1 Year
2 Year
+6.17%
+25.01%
3,913
4,128
5.49%
4,028
-2.42%
373 9.26% 72.4 169 179 24 1
$50,000
and less
297 7.37% 72.5 97 172 26 2
$50,001
$75,000
405 10.05% 74.9 102 266 37 0
$75,001
$100,000
1,066 26.46% 61.5 202 747 112 5
$100,001
$150,000
822 20.41% 66.0 113 492 209 8
$150,001
$200,000
582 14.45% 71.1 67 229 267 19
$200,001
$275,000
483 11.99% 70.1 32 115 256 80
$275,001
and up
5,000
4,000
3,000
2,000
1,000
0
Jun 2009 Dec 2009 Jun 2010 Dec 2010 Jun 2011 Dec 2011 Jun 2012 Dec 2012
Total Closed Units:
Total Closed Volume:
Average Closed Price:
4,028
687,202,792
$170,606
68.0 782
93.30M
$119,310
2200
320.07M
$145,484
931
228.95M
$245,921
115
44.88M
$390,297
pp. 1Reports produced and compiled by Information is deemed reliable but not guaranteed. Does not reflect all market activity.RE STATS Inc.
Steve Reese 405-848-9944 steve@oklahomarealtors.com
3. Monthly Inventory Analysis
The Oklahoma Association of
REALTORS®
June 2013
PendingListings
Pending Listings
ReadytoBuyorSellRealEstate?
ContactanexperiencedREALTOR
Data from the
Area Delimited by Entire OK State MLS - Single-Family Property Type
Pending Listings as of Jul 24, 2013
Report Produced on: Jul 29, 2013
JUNE YEAR TO DATE (YTD)
5 YEAR MARKET ACTIVITY TRENDS 5yr JUN AVG = 3,581 3 MONTHS
PENDING LISTINGS & BEDROOMS DISTRIBUTION BY PRICE
High
Low
Apr 2010 = 4,892
Dec 2009 = 1,989
Pending Listingsthis
month at
above the 5 yr JUN
average of
4,357,
3,581
A
P
R
M
A
Y
J
U
N
Distribution of Pending Listings by Price Range % AVDOM 2 Beds 3 Beds 4 Beds 5 Beds+
2009
3,757
2010
2,699
2011
3,388
2012
3,704
2013
4,357
1 Year
2 Year
+17.63%
+28.60%
2009
19,667
2010
19,409
2011
18,257
2012
21,896
2013
23,998
1 Year
2 Year
+9.60%
+31.45%
4,349
4,205
-3.31%
4,357
3.61%
372 8.54% 65.3 147 196 28 1
$50,000
and less
319 7.32% 72.0 117 182 17 3
$50,001
$75,000
925 21.23% 65.7 200 652 68 5
$75,001
$125,000
1,129 25.91% 59.8 172 753 195 9
$125,001
$175,000
440 10.10% 61.3 74 235 128 3
$175,001
$200,000
640 14.69% 61.1 74 274 274 18
$200,001
$275,000
532 12.21% 77.0 50 125 303 54
$275,001
and up
5,000
4,000
3,000
2,000
1,000
0
Jun 2009 Dec 2009 Jun 2010 Dec 2010 Jun 2011 Dec 2011 Jun 2012 Dec 2012
Total Pending Units:
Total Pending Volume:
Average Listing Price:
4,357
755,878,864
$172,886
68.6 834
108.37M
$129,941
2417
356.23M
$147,387
1013
253.32M
$250,072
93
37.95M
$408,073
pp. 2Reports produced and compiled by Information is deemed reliable but not guaranteed. Does not reflect all market activity.RE STATS Inc.
Steve Reese 405-848-9944 steve@oklahomarealtors.com
4. Monthly Inventory Analysis
The Oklahoma Association of
REALTORS®
June 2013
NewListings
New Listings
ReadytoBuyorSellRealEstate?
ContactanexperiencedREALTOR
Data from the
Area Delimited by Entire OK State MLS - Single-Family Property Type
New Listings as of Jul 24, 2013
Report Produced on: Jul 29, 2013
JUNE YEAR TO DATE (YTD)
5 YEAR MARKET ACTIVITY TRENDS 5yr JUN AVG = 6,326 3 MONTHS
NEW LISTINGS & BEDROOMS DISTRIBUTION BY PRICE
High
Low
Apr 2010 = 7,745
Dec 2012 = 3,648
New Listings this
month at
above the 5 yr JUN
average of
6,654,
6,326
A
P
R
M
A
Y
J
U
N
Distribution of New Listings by Price Range % 2 Beds 3 Beds 4 Beds 5 Beds+
2009
6,260
2010
6,086
2011
6,534
2012
6,098
2013
6,654
1 Year
2 Year
+9.12%
+1.84%
2009
34,244
2010
36,885
2011
35,915
2012
38,012
2013
38,204
1 Year
2 Year
+0.51%
+6.37%
6,998
6,640
-5.12%
6,654
0.21%
547 8.22% 255 254 33 5
$50,000
and less
545 8.19% 200 309 32 4
$50,001
$75,000
1,432 21.52% 312 984 125 11
$75,001
$125,000
1,565 23.52% 242 1,030 266 27
$125,001
$175,000
945 14.20% 144 488 298 15
$175,001
$225,000
895 13.45% 110 317 426 42
$225,001
$325,000
725 10.90% 73 147 364 141
$325,001
and up
8,000
7,000
6,000
5,000
4,000
3,000
2,000
1,000
0
Jun 2009 Dec 2009 Jun 2010 Dec 2010 Jun 2011 Dec 2011 Jun 2012 Dec 2012
Total New Listed Units:
Total New Listed Volume:
Average New Listed Listing Price:
6,654
1,247,851,920
$203,553
1336
189.90M
$142,142
3529
534.54M
$151,472
1544
410.86M
$266,104
245
112.54M
$459,356
pp. 3Reports produced and compiled by Information is deemed reliable but not guaranteed. Does not reflect all market activity.RE STATS Inc.
Steve Reese 405-848-9944 steve@oklahomarealtors.com
5. Monthly Inventory Analysis
The Oklahoma Association of
REALTORS®
June 2013
ActiveInventory
Active Inventory
ReadytoBuyorSellRealEstate?
ContactanexperiencedREALTOR
Data from the
Area Delimited by Entire OK State MLS - Single-Family Property Type
Active Inventory as of Jul 24, 2013
Report Produced on: Jul 29, 2013
END OF JUNE ACTIVE DURING JUNE
5 YEAR MARKET ACTIVITY TRENDS 5yr JUN AVG = 23,380 3 MONTHS
INVENTORY & BEDROOMS DISTRIBUTION BY PRICE
High
Low
Jul 2011 = 26,299
Dec 2009 = 19,630
Inventory this
month at
below the 5 yr JUN
average of
21,085,
23,380
A
P
R
M
A
Y
J
U
N
Distribution of Inventory by Price Range % AVDOM 2 Beds 3 Beds 4 Beds 5 Beds+
2009
21,861
2010
24,122
2011
25,875
2012
23,958
2013
21,085
1 Year
2 Year
-11.99%
-18.51%
2009
27,665
2010
28,878
2011
31,643
2012
29,680
2013
27,581
1 Year
2 Year
-7.07%
-12.84%
20,670
20,935
1.28%
21,085
0.72%
1,864 8.84% 115.2 1,005 759 88 12
$50,000
and less
2,230 10.58% 121.0 844 1,209 157 20
$50,001
$75,000
2,547 12.08% 103.9 692 1,596 236 23
$75,001
$100,000
6,228 29.54% 94.4 1,209 3,945 989 85
$100,001
$175,000
2,628 12.46% 94.3 410 1,318 830 70
$175,001
$225,000
3,469 16.45% 101.4 552 1,109 1,538 270
$225,001
$375,000
2,119 10.05% 114.8 190 408 1,010 511
$375,001
and up
30,000
20,000
10,000
0
Jun 2009 Dec 2009 Jun 2010 Dec 2010 Jun 2011 Dec 2011 Jun 2012 Dec 2012
Total Active Inventory by Units:
Total Active Inventory by Volume:
Average Active Inventory Listing Price:
21,085
4,267,008,837
$202,372
103.4 4,902
694.63M
$141,703
10,344
1.62B
$156,312
4,848
1.41B
$290,693
991
546.21M
$551,171
pp. 4Reports produced and compiled by Information is deemed reliable but not guaranteed. Does not reflect all market activity.RE STATS Inc.
Steve Reese 405-848-9944 steve@oklahomarealtors.com
6. Monthly Inventory Analysis
The Oklahoma Association of
REALTORS®
June 2013
MonthsSupply
Months Supply of Inventory
ReadytoBuyorSellRealEstate?
ContactanexperiencedREALTOR
Data from the
Area Delimited by Entire OK State MLS - Single-Family Property Type
Active Inventory as of Jul 24, 2013
Report Produced on: Jul 29, 2013
MSI FOR JUNE INDICATORS FOR JUNE 2013
5 YEAR MARKET ACTIVITY TRENDS 5yr JUN AVG = 7.6 3 MONTHS
MONTHS SUPPLY & BEDROOMS DISTRIBUTION BY PRICE
High
Low
Jun 2011 = 9.6
Feb 2013 = 5.9
Months Supply this
month at
below the 5 yr JUN
average of
6.1,
7.6
A
P
R
M
A
Y
J
U
N
Distribution of Active Inventory by Price Range and MSI % MSI 2 Beds 3 Beds 4 Beds 5 Beds+
2009
7.1
2010
7.4
2011
9.6
2012
7.6
2013
6.1
1 Year
2 Year
-20.05%
-36.95%
Inventory
21,085
End of
Month
Active
Inventory
Closed
41,704
Closed
Last
12
Months
Absorption
3,475
Average
Closed per
Month over
12 Months
MSI
6.1
Months
Supply
of
Inventory
MSI %
16.482%
Percent
Months
Supply of
Inventory
6.0
6.0
0.90%
6.1
0.39%
1,864 8.84% 4.5 5.6 3.7 3.4 3.6
$50,000
and less
2,772 13.15% 7.1 8.6 6.5 6.2 7.3
$50,001
$80,000
2,711 12.86% 6.1 6.8 5.8 7.2 10.7
$80,001
$110,000
5,171 24.52% 4.9 5.7 4.6 5.0 9.9
$110,001
$170,000
3,614 17.14% 5.9 7.4 5.9 5.4 7.3
$170,001
$240,000
2,762 13.10% 7.0 9.8 7.2 6.1 8.6
$240,001
$370,000
2,191 10.39% 13.0 17.8 13.3 11.3 16.0
$370,001
and up
10
9
8
7
6
5
4
3
2
1
0
Jun 2009 Dec 2009 Jun 2010 Dec 2010 Jun 2011 Dec 2011 Jun 2012 Dec 2012
MSI:
Total Active Inventory: 21,085
6.1 7.0
4,902
5.4
10,344
6.2
4,848
11.0
991
pp. 5Reports produced and compiled by Information is deemed reliable but not guaranteed. Does not reflect all market activity.RE STATS Inc.
Steve Reese 405-848-9944 steve@oklahomarealtors.com
7. Monthly Inventory Analysis
The Oklahoma Association of
REALTORS®
June 2013
AverageDaysonMarket
Average Days on Market to Sale
ReadytoBuyorSellRealEstate?
ContactanexperiencedREALTOR
Data from the
Area Delimited by Entire OK State MLS - Single-Family Property Type
Closed Sales as of Jul 24, 2013
Report Produced on: Jul 29, 2013
JUNE YEAR TO DATE (YTD)
5 YEAR MARKET ACTIVITY TRENDS 5yr JUN AVG = 78 3 MONTHS
AVERAGE DOM OF CLOSED SALES & BEDROOMS DISTRIBUTION BY PRICE
High
Low
Mar 2011 = 97
Jun 2013 = 68
Average DOM this
month at
below the 5 yr JUN
average of
68,
78
A
P
R
M
A
Y
J
U
N
Distribution of Average Days on Market to Sale by Price Range % AVDOM 2 Beds 3 Beds 4 Beds 5 Beds+
2009
82
2010
77
2011
83
2012
77
2013
68
1 Year
2 Year
-11.96%
-18.52%
2009
87
2010
77
2011
91
2012
85
2013
77
1 Year
2 Year
-9.78%
-15.38%
79
71
-10.40%
68
-3.59%
373 9.26% 72.4 76.7 69.8 62.1 52.0
$50,000
and less
297 7.37% 72.5 88.6 64.8 67.8 8.5
$50,001
$75,000
405 10.05% 74.9 79.5 71.8 84.4 0.0
$75,001
$100,000
1,066 26.46% 61.5 75.5 56.7 64.6 138.4
$100,001
$150,000
822 20.41% 66.0 86.1 62.9 61.1 103.6
$150,001
$200,000
582 14.45% 71.1 80.4 70.3 68.9 78.4
$200,001
$275,000
483 11.99% 70.1 80.6 77.5 59.2 89.9
$275,001
and up
100
90
80
70
60
50
40
30
20
10
0
Jun 2009 Dec 2009 Jun 2010 Dec 2010 Jun 2011 Dec 2011 Jun 2012 Dec 2012
Average Closed DOM:
Total Closed Units:
Total Closed Volume:
68.0
4,028
687,202,792
80.0
782
93.30M
64.1
2200
320.07M
64.4
931
228.95M
89.3
115
44.88M
pp. 6Reports produced and compiled by Information is deemed reliable but not guaranteed. Does not reflect all market activity.RE STATS Inc.
Steve Reese 405-848-9944 steve@oklahomarealtors.com
8. Monthly Inventory Analysis
The Oklahoma Association of
REALTORS®
June 2013
AverageListPrice
Average List Price at Closing
ReadytoBuyorSellRealEstate?
ContactanexperiencedREALTOR
Data from the
Area Delimited by Entire OK State MLS - Single-Family Property Type
Closed Sales as of Jul 24, 2013
Report Produced on: Jul 29, 2013
JUNE YEAR TO DATE (YTD)
5 YEAR MARKET ACTIVITY TRENDS 5yr JUN AVG = 165K 3 MONTHS
AVERAGE LIST PRICE OF CLOSED SALES & BEDROOMS DISTRIBUTION BY PRICE
High
Low
May 2012 = 214,841
Jan 2010 = 139,528
Average LPrice this
month at
above the 5 yr JUN
average of
175,304,
164,527
A
P
R
M
A
Y
J
U
N
Distribution of Average List Price at Closing by Price Range % AVL$ 2 Beds 3 Beds 4 Beds 5 Beds+
2009
159,269
2010
160,357
2011
161,700
2012
166,005
2013
175,304
1 Year
2 Year
+5.60%
+8.41%
2009
148,752
2010
149,482
2011
154,094
2012
167,205
2013
167,193
1 Year
2 Year
-0.01%
+8.50%
165,278
173,126
4.75%
175,304
1.26%
348 8.64% 33,808 35,268 36,622 34,688 34,900
$50,000
and less
280 6.95% 64,221 66,893 67,064 66,503 61,500
$50,001
$75,000
425 10.55% 89,408 92,587 90,937 91,570 0
$75,001
$100,000
1,042 25.87% 128,398 129,464 129,728 132,677 131,760
$100,001
$150,000
842 20.90% 174,385 177,201 175,505 178,783 181,725
$150,001
$200,000
579 14.37% 236,987 246,682 236,931 242,522 249,640
$200,001
$275,000
512 12.71% 430,746 391,266 420,861 436,510 489,108
$275,001
and up
300,000
200,000
100,000
0
Jun 2009 Dec 2009Jun 2010 Dec 2010Jun 2011 Dec 2011Jun 2012 Dec 2012
Average List Price:
Total Closed Units:
Total List Volume:
$175,304
4,028
706,125,088
$124,190
782
97.12M
$149,178
2200
328.19M
$252,068
931
234.68M
$401,237
115
46.14M
pp. 7Reports produced and compiled by Information is deemed reliable but not guaranteed. Does not reflect all market activity.RE STATS Inc.
Steve Reese 405-848-9944 steve@oklahomarealtors.com
9. Monthly Inventory Analysis
The Oklahoma Association of
REALTORS®
June 2013
AverageSoldPrice
Average Sold Price at Closing
ReadytoBuyorSellRealEstate?
ContactanexperiencedREALTOR
Data from the
Area Delimited by Entire OK State MLS - Single-Family Property Type
Closed Sales as of Jul 24, 2013
Report Produced on: Jul 29, 2013
JUNE YEAR TO DATE (YTD)
5 YEAR MARKET ACTIVITY TRENDS 5yr JUN AVG = 159K 3 MONTHS
AVERAGE SOLD PRICE OF CLOSED SALES & BEDROOMS DISTRIBUTION BY PRICE
High
Low
May 2012 = 209,572
Jan 2010 = 133,903
Average SPrice this
month at
above the 5 yr JUN
average of
170,606,
159,119
A
P
R
M
A
Y
J
U
N
Distribution of Average Sold Price at Closing by Price Range % AVS$ 2 Beds 3 Beds 4 Beds 5 Beds+
2009
153,908
2010
154,823
2011
155,764
2012
160,494
2013
170,606
1 Year
2 Year
+6.30%
+9.53%
2009
143,492
2010
144,258
2011
147,953
2012
161,645
2013
161,937
1 Year
2 Year
+0.18%
+9.45%
159,992
167,585
4.75%
170,606
1.80%
373 9.26% 32,365 31,118 33,882 29,977 29,000
$50,000
and less
297 7.37% 63,384 63,169 63,487 63,750 60,126
$50,001
$75,000
405 10.05% 88,395 89,040 88,171 88,227 0
$75,001
$100,000
1,066 26.46% 126,826 125,978 126,588 129,961 126,400
$100,001
$150,000
822 20.41% 172,969 171,579 172,254 174,984 183,938
$150,001
$200,000
582 14.45% 235,910 234,432 233,060 238,139 244,147
$200,001
$275,000
483 11.99% 426,147 384,045 408,230 424,221 474,907
$275,001
and up
300,000
200,000
100,000
0
Jun 2009 Dec 2009Jun 2010 Dec 2010Jun 2011 Dec 2011Jun 2012 Dec 2012
Average Closed Price:
Total Closed Units:
Total Closed Volume:
$170,606
4,028
687,202,792
$119,310
782
93.30M
$145,484
2200
320.07M
$245,921
931
228.95M
$390,297
115
44.88M
pp. 8Reports produced and compiled by Information is deemed reliable but not guaranteed. Does not reflect all market activity.RE STATS Inc.
Steve Reese 405-848-9944 steve@oklahomarealtors.com
10. Monthly Inventory Analysis
The Oklahoma Association of
REALTORS®
June 2013
AverageList/SellPrice
Average Percent of List Price to Selling Price
ReadytoBuyorSellRealEstate?
ContactanexperiencedREALTOR
Data from the
Area Delimited by Entire OK State MLS - Single-Family Property Type
Closed Sales as of Jul 24, 2013
Report Produced on: Jul 29, 2013
JUNE YEAR TO DATE (YTD)
5 YEAR MARKET ACTIVITY TRENDS 5yr JUN AVG=96.72% 3 MONTHS
AVERAGE L/S% OF CLOSED SALES & BEDROOMS DISTRIBUTION BY PRICE
High
Low
Mar 2013 = 97.26%
Jan 2011 = 95.26%
Average List/Sell this
month at
above the 5 yr JUN
average of
97.05%,
96.72%
A
P
R
M
A
Y
J
U
N
Distribution of $avgmed L/S % by Price Range % AVL/S% 2 Beds 3 Beds 4 Beds 5 Beds+
2009
96.83%
2010
96.61%
2011
96.18%
2012
96.91%
2013
97.05%
1 Year
2 Year
+0.14%
+0.90%
2009
96.15%
2010
96.50%
2011
95.82%
2012
96.21%
2013
96.81%
1 Year
2 Year
+0.62%
+1.03%
96.68%
97.08%
0.41%
97.05%
-0.03%
373 9.26% 91.83% 89.55% 94.00% 92.06% 83.09%
$50,000
and less
297 7.37% 95.51% 95.02% 95.42% 97.70% 98.88%
$50,001
$75,000
405 10.05% 96.97% 96.40% 97.24% 96.59% 0.00%
$75,001
$100,000
1,066 26.46% 97.72% 97.46% 97.70% 98.39% 96.55%
$100,001
$150,000
822 20.41% 98.02% 97.06% 98.22% 97.96%101.33%
$150,001
$200,000
582 14.45% 98.16% 96.37% 98.56% 98.29% 97.86%
$200,001
$275,000
483 11.99% 97.61% 98.51% 97.60% 97.57% 97.40%
$275,001
and up
98
97
96
95
Jun 2009 Dec 2009 Jun 2010 Dec 2010 Jun 2011 Dec 2011 Jun 2012 Dec 2012
Average List/Sell Ratio:
Total Closed Units:
Total Closed Volume:
97.10%
4,028
687,202,792
95.20%
782
93.30M
97.37%
2200
320.07M
97.79%
931
228.95M
97.61%
115
44.88M
pp. 9Reports produced and compiled by Information is deemed reliable but not guaranteed. Does not reflect all market activity.RE STATS Inc.
Steve Reese 405-848-9944 steve@oklahomarealtors.com
11. Monthly Inventory Analysis
The Oklahoma Association of
REALTORS®
June 2013
Market Summary
Data from the
Area Delimited by Entire OK State MLS - Single-Family Property Type
Inventory as of Jul 24, 2013
Report Produced on: Jul 29, 2013
Inventory Inventory Market Activity Market Activity
New Listings Closed Sales
Pending Sales
Other Off Market
Active Inventory
Start Inventory
Total Inventory
Units
Volume
6,654 = 24.12%
20,938
27,592
$5,446,549,491
4,028 = 12.74%
4,357 = 13.78%
2,141 = 6.77%
21,085 = 66.70%
Absorption:
Active Inventory
3,475
21,085
JUNE Year To Date
2012 2013 +/-% 2012 2013 +/-%
Last 12 months, an Average of Sales/Month
as of June 30, 2013 =
Closed Sales
Pending Sales
New Listings
Average List Price
Average Sale Price
Average Percent of List Price to Selling Price
Average Days on Market to Sale
Monthly Inventory
Months Supply of Inventory
3,892 4,028 3.49%
3,704 4,357 17.63%
6,098 6,654 9.12%
166,005 175,304 5.60%
160,494 170,606 6.30%
96.91% 97.05% 0.14%
77.24 68.00 -11.96%
23,975 21,085 -12.05%
7.59 6.07 -20.11%
19,699 20,914 6.17%
21,896 23,998 9.60%
38,012 38,204 0.51%
167,205 167,193 -0.01%
161,645 161,937 0.18%
96.21% 96.81% 0.62%
84.98 76.67 -9.78%
23,975 21,085 -12.05%
7.59 6.07 -20.11%
New Listings Pending Listings List Price Sale Price
Active Inventory Monthly Supply of Inventory % of List to Sale Price Days on Market to Sale
2012
2013
2012
2013
2012
2013
2012
2013
JUNE MARKET AVERAGE PRICES
INVENTORY AVERAGE L/S% & DOM
6,098
3,704
6,654
+9.12%
4,357
+17.63%
166,005
160,494
175,304
+5.60%
170,606
+6.30%
23,975 7.59
21,085
-12.05%
6.07
-20.11%
96.91%
77.2497.05%
+0.14%
68.00
-11.96%
pp. 10Reports produced and compiled by Information is deemed reliable but not guaranteed. Does not reflect all market activity.RE STATS Inc.
Steve Reese 405-848-9944 steve@oklahomarealtors.com