83770-87607 ۞Call Girls In Near The Park Hotel (Cp) Delhi
January 2014 Housing Sales Statistics
1. January 2014
Area Delimited by Entire OK State MLS Single-Family Property Type
JANUARY
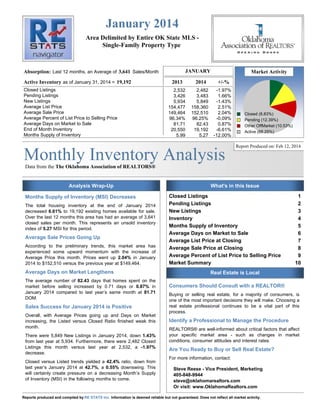
Absorption: Last 12 months, an Average of 3,641 Sales/Month
Active Inventory as of January 31, 2014 = 19,192
Closed Listings
Pending Listings
New Listings
Average List Price
Average Sale Price
Average Percent of List Price to Selling Price
Average Days on Market to Sale
End of Month Inventory
Months Supply of Inventory
Market Activity
2013
2014
+/-%
2,532
3,426
5,934
154,477
149,464
96.34%
81.71
20,550
5.99
2,482
3,483
5,849
158,360
152,510
96.25%
82.43
19,192
5.27
-1.97%
1.66%
-1.43%
2.51%
2.04%
-0.09%
0.87%
-6.61%
-12.00%
Monthly Inventory Analysis
Closed (8.83%)
Pending (12.39%)
Other OffMarket (10.53%)
Active (68.25%)
Report Produced on: Feb 12, 2014
Data from the The Oklahoma Association of REALTORS®
Analysis Wrap-Up
Months Supply of Inventory (MSI) Decreases
The total housing inventory at the end of January 2014
decreased 6.61% to 19,192 existing homes available for sale.
Over the last 12 months this area has had an average of 3,641
closed sales per month. This represents an unsold inventory
index of 5.27 MSI for this period.
Average Sale Prices Going Up
According to the preliminary trends, this market area has
experienced some upward momentum with the increase of
Average Price this month. Prices went up 2.04% in January
2014 to $152,510 versus the previous year at $149,464.
Average Days on Market Lengthens
The average number of 82.43 days that homes spent on the
market before selling increased by 0.71 days or 0.87% in
January 2014 compared to last year’s same month at 81.71
DOM.
Sales Success for January 2014 is Positive
Overall, with Average Prices going up and Days on Market
increasing, the Listed versus Closed Ratio finished weak this
month.
There were 5,849 New Listings in January 2014, down 1.43%
from last year at 5,934. Furthermore, there were 2,482 Closed
Listings this month versus last year at 2,532, a -1.97%
decrease.
Closed versus Listed trends yielded a 42.4% ratio, down from
last year’s January 2014 at 42.7%, a 0.55% downswing. This
will certainly create pressure on a decreasing Month’s Supply
of Inventory (MSI) in the following months to come.
What's in this Issue
Closed Listings
Pending Listings
New Listings
Inventory
Months Supply of Inventory
Average Days on Market to Sale
Average List Price at Closing
Average Sale Price at Closing
Average Percent of List Price to Selling Price
Market Summary
1
2
3
4
5
6
7
8
9
10
Real Estate is Local
Consumers Should Consult with a REALTOR®
Buying or selling real estate, for a majority of consumers, is
one of the most important decisions they will make. Choosing a
real estate professional continues to be a vital part of this
process.
Identify a Professional to Manage the Procedure
REALTORS® are well-informed about critical factors that affect
your specific market area - such as changes in market
conditions, consumer attitudes and interest rates.
Are You Ready to Buy or Sell Real Estate?
For more information, contact:
Steve Reese - Vice President, Marketing
405-848-9944
steve@oklahomarealtors.com
Or visit: www.OklahomaRealtors.com
Reports produced and compiled by RE STATS Inc. Information is deemed reliable but not guaranteed. Does not reflect all market activity.
2. Monthly Inventory Analysis
Data from the The Oklahoma Association of
REALTORS®
January 2014
Closed Sales as of Feb 12, 2014
Closed Listings
Report Produced on: Feb 12, 2014
Area Delimited by Entire OK State MLS - Single-Family Property Type
JANUARY
2010
1,719
2011
1,982
2012
2,307
YEAR TO DATE (YTD)
2013
2014
2,532
2010
2,482
1,719
2011
2012
2013
2,532
2,307
1,982
2014
2,482
1 Year
-1.97%
2 Year
+7.59%
1 Year
-1.97%
2 Year
+7.59%
5 YEAR MARKET ACTIVITY TRENDS
5yr JAN AVG = 2,204
High
Jul 2013 = 4,628
Low
Jan 2010 = 1,719
5,000
4,000
3,000
Closed Listings
2,000
1,000
0
Jun 2010 Dec 2010 Jun 2011 Dec 2011 Jun 2012 Dec 2012 Jun 2013 Dec 2013
3 MONTHS
N 3,114
O
V
D 3,153
E
C 1.25%
Closed Listings
this
month at 2,482,
above the 5 yr JAN J 2,482
A
average of 2,204
N -21.28%
CLOSED LISTINGS & BEDROOMS DISTRIBUTION BY PRICE
Distribution of Closed Listings by Price Range
%
AVDOM
2 Beds
3 Beds
4 Beds
5 Beds+
125
5.04%
83.5
57
62
4
2
$25,001
$50,000
243
9.79%
79.6
87
127
23
6
$50,001
$100,000
Ready to Buy or Sell Real Estate?
Contact an experienced REALTOR
$25,000
and less
569
22.93%
83.3
160
354
54
1
$100,001
$150,000
580
23.37%
78.9
81
402
87
10
$150,001
$200,000
376
15.15%
76.9
54
218
95
9
$200,001
$275,000
315
12.69%
86.6
41
136
129
9
$275,001
and up
274
11.04%
92.9
20
59
155
40
Total Closed Units:
Total Closed Volume:
Average Closed Price:
2,482
378,530,713
$152,510
82.4
500
1358
547
77
52.04M 175.14M 125.56M
25.80M
$104,075 $128,966 $229,542 $335,035
Reports produced and compiled by RE STATS Inc. Information is deemed reliable but not guaranteed. Does not reflect all market activity.
Steve Reese
405-848-9944
steve@oklahomarealtors.com
pp. 1
3. Monthly Inventory Analysis
Data from the The Oklahoma Association of
REALTORS®
January 2014
Pending Listings as of Feb 12, 2014
Pending Listings
Report Produced on: Feb 12, 2014
Area Delimited by Entire OK State MLS - Single-Family Property Type
JANUARY
2010
2011
2012
3,124
2,411
YEAR TO DATE (YTD)
2013
2014
3,426
3,483
2,574
2010
2011
2012
2013
3,426
3,124
2,411
2014
3,483
2,574
1 Year
+1.66%
2 Year
+11.49%
1 Year
+1.66%
2 Year
+11.49%
5 YEAR MARKET ACTIVITY TRENDS
5yr JAN AVG = 3,004
High
Apr 2010 = 4,937
Low
Dec 2010 = 2,050
5,000
4,000
3,000
Pending Listings
2,000
1,000
0
Jun 2010 Dec 2010 Jun 2011 Dec 2011 Jun 2012 Dec 2012 Jun 2013 Dec 2013
3 MONTHS
N 2,968
O
V
D 2,374
E
C -20.01%
Pending Listings
this
month at 3,483,
above the 5 yr JAN J 3,483
A
average of 3,004
N 46.71%
PENDING LISTINGS & BEDROOMS DISTRIBUTION BY PRICE
Distribution of Pending Listings by Price Range
%
AVDOM
2 Beds
3 Beds
4 Beds
5 Beds+
336
9.65%
72.9
149
163
21
3
$40,001
$70,000
365
10.48%
83.4
124
212
26
3
$70,001
$110,000
Ready to Buy or Sell Real Estate?
Contact an experienced REALTOR
$40,000
and less
608
17.46%
79.1
135
406
60
7
$110,001
$160,000
874
25.09%
76.4
119
617
129
9
$160,001
$200,000
463
13.29%
77.9
59
269
128
7
$200,001
$290,000
487
13.98%
83.8
53
200
212
22
$290,001
and up
350
10.05%
98.5
21
103
181
45
Total Pending Units:
Total Pending Volume:
Average Listing Price:
3,483
553,736,349
$143,886
88.3
660
1970
757
96
70.11M 276.14M 175.92M
31.56M
$106,232 $140,172 $232,391 $328,785
Reports produced and compiled by RE STATS Inc. Information is deemed reliable but not guaranteed. Does not reflect all market activity.
Steve Reese
405-848-9944
steve@oklahomarealtors.com
pp. 2
4. Monthly Inventory Analysis
Data from the The Oklahoma Association of
REALTORS®
January 2014
New Listings as of Feb 12, 2014
New Listings
Report Produced on: Feb 12, 2014
Area Delimited by Entire OK State MLS - Single-Family Property Type
JANUARY
2010
2012
2013
2014
6,112
5,108
2011
YEAR TO DATE (YTD)
5,934
5,849
5,464
2010
2012
2013
2014
6,112
5,108
2011
5,934
5,849
5,464
1 Year
-1.43%
2 Year
-4.30%
1 Year
-1.43%
2 Year
-4.30%
5 YEAR MARKET ACTIVITY TRENDS
5yr JAN AVG = 5,693
High
Apr 2010 = 7,793
Low
Dec 2013 = 3,468
8,000
7,000
6,000
5,000
New Listings
4,000
3,000
2,000
1,000
0
Jun 2010 Dec 2010 Jun 2011 Dec 2011 Jun 2012 Dec 2012 Jun 2013 Dec 2013
3 MONTHS
N 4,405
O
V
D 3,468
E
C -21.27%
New Listings this
month at 5,849,
above the 5 yr JAN J 5,849
A
average of 5,693
N 68.66%
NEW LISTINGS & BEDROOMS DISTRIBUTION BY PRICE
Distribution of New Listings by Price Range
%
2 Beds
3 Beds
4 Beds
5 Beds+
584
9.98%
251
292
39
2
$50,001
$80,000
658
11.25%
227
381
46
4
$80,001
$110,000
Ready to Buy or Sell Real Estate?
Contact an experienced REALTOR
$50,000
and less
769
13.15%
168
510
85
6
$110,001
$170,000
1,538
26.30%
250
1,051
217
20
$170,001
$230,000
917
15.68%
122
475
305
15
$230,001
$350,000
809
13.83%
82
314
360
53
$350,001
and up
574
9.81%
46
124
303
101
Total New Listed Units:
Total New Listed Volume:
Average New Listed Listing Price:
5,849
1,109,158,137
$144,216
1146
3147
1355
201
149.91M 488.73M 369.61M 100.91M
$130,813 $155,301 $272,772 $502,031
Reports produced and compiled by RE STATS Inc. Information is deemed reliable but not guaranteed. Does not reflect all market activity.
Steve Reese
405-848-9944
steve@oklahomarealtors.com
pp. 3
5. Monthly Inventory Analysis
Data from the The Oklahoma Association of
REALTORS®
January 2014
Active Inventory as of Feb 12, 2014
Active Inventory
Report Produced on: Feb 12, 2014
Area Delimited by Entire OK State MLS - Single-Family Property Type
END OF JANUARY
2010
2011
2012
23,956
ACTIVE DURING JANUARY
2013
22,955
19,934
2010
19,192
2011
2012
2013
2014
29,483
20,534
2014
29,123
26,694
25,636
5,083
1 Year
-6.54%
2 Year
-16.39%
1 Year
-3.96%
2 Year
-11.97%
5 YEAR MARKET ACTIVITY TRENDS
5yr JAN AVG = 21,314
Active Inventory
High
Jul 2011 = 26,728
Low
Jan 2014 = 19,192
30,000
20,000
10,000
0
Jun 2010 Dec 2010 Jun 2011 Dec 2011 Jun 2012 Dec 2012 Jun 2013 Dec 2013
Inventory this
month at 19,192,
below the 5 yr JAN
average of 21,314
3 MONTHS
N 21,368
O
V
D 19,797
E
C -7.35%
J 19,192
A
N -3.06%
INVENTORY & BEDROOMS DISTRIBUTION BY PRICE
Distribution of Inventory by Price Range
%
AVDOM
2 Beds
3 Beds
4 Beds
5 Beds+
1,970
10.26%
127.6
980
870
111
9
$50,001
$75,000
2,027
10.56%
133.9
793
1,081
137
16
$75,001
$100,000
Ready to Buy or Sell Real Estate?
Contact an experienced REALTOR
$50,000
and less
2,315
12.06%
118.7
639
1,438
218
20
$100,001
$175,000
5,373
28.00%
110.5
973
3,457
859
84
$175,001
$225,000
2,450
12.77%
111.4
389
1,256
751
54
$225,001
$375,000
3,153
16.43%
119.7
442
1,074
1,401
236
$375,001
and up
1,904
9.92%
127.5
206
388
910
400
Total Active Inventory by Units:
Total Active Inventory by Volume:
Average Active Inventory Listing Price:
19,192
3,841,508,192
$200,162
119.0
4,422
9,564
4,387
819
621.23M
1.50B
1.29B 430.29M
$140,485 $157,348 $292,937 $525,388
Reports produced and compiled by RE STATS Inc. Information is deemed reliable but not guaranteed. Does not reflect all market activity.
Steve Reese
405-848-9944
steve@oklahomarealtors.com
pp. 4
6. Monthly Inventory Analysis
Data from the The Oklahoma Association of
REALTORS®
January 2014
Active Inventory as of Feb 12, 2014
Months Supply of Inventory
Report Produced on: Feb 12, 2014
Area Delimited by Entire OK State MLS - Single-Family Property Type
MSI FOR JANUARY
2010
2011
2012
8.2
INDICATORS FOR JANUARY 2014
Inventory
7.7
6.3
2013
2014
Closed
Absorption
MSI
MSI %
5.3
18.972%
Months
Supply
of
Inventory
Percent
Months
Supply of
Inventory
43,693
6.0
5.3
19,192
1 Year
-11.93%
2 Year
-31.79%
End of
Month
Active
Inventory
Closed
Last
12
Months
5 YEAR MARKET ACTIVITY TRENDS
3,641
Average
Closed per
Month over
12 Months
5yr JAN AVG = 6.7
High
Jun 2011 = 9.7
Low
Jan 2014 = 5.3
Months Supply
10
9
8
7
6
5
4
3
2
1
0
Jun 2010
Dec 2010 Jun 2011
Dec 2011 Jun 2012
Dec 2012 Jun 2013
Dec 2013
Months Supply this
month at 5.3,
below the 5 yr JAN
average of 6.7
3 MONTHS
N 5.9
O
V
D 5.4
E
C -7.44%
J 5.3
A
N -2.95%
MONTHS SUPPLY & BEDROOMS DISTRIBUTION BY PRICE
Distribution of Active Inventory by Price Range and MSI
%
MSI
2 Beds
3 Beds
4 Beds
5 Beds+
1,970
10.26%
4.7
5.3
4.2
4.1
2.2
$50,001
$70,000
1,643
8.56%
6.5
8.2
5.8
5.3
4.9
$70,001
$110,000
Ready to Buy or Sell Real Estate?
Contact an experienced REALTOR
$50,000
and less
3,300
17.19%
5.4
6.3
5.0
6.1
8.0
$110,001
$170,000
4,458
23.23%
4.1
4.6
3.9
4.1
7.4
$170,001
$240,000
3,267
17.02%
4.9
5.7
4.9
4.5
5.4
$240,001
$370,000
2,576
13.42%
6.2
8.5
6.6
5.4
7.2
$370,001
and up
1,978
10.31%
11.0
16.5
11.6
9.8
11.7
6.1
4,422
4.8
9,564
5.4
4,387
8.3
819
MSI:
Total Active Inventory:
5.3
19,192
Reports produced and compiled by RE STATS Inc. Information is deemed reliable but not guaranteed. Does not reflect all market activity.
Steve Reese
405-848-9944
steve@oklahomarealtors.com
pp. 5
7. Monthly Inventory Analysis
Data from the The Oklahoma Association of
REALTORS®
January 2014
Closed Sales as of Feb 12, 2014
Average Days on Market to Sale
Report Produced on: Feb 12, 2014
Area Delimited by Entire OK State MLS - Single-Family Property Type
JANUARY
2010
2011
2012
93
YEAR TO DATE (YTD)
2013
92
2010
82
2011
2012
93
82
80
2014
2013
2014
92
82
82
80
1 Year
+0.87%
2 Year
-9.98%
1 Year
+0.87%
2 Year
-9.98%
5 YEAR MARKET ACTIVITY TRENDS
5yr JAN AVG = 86
Average Days on Market
High
Mar 2011 = 98
Low
Jul 2013 = 69
100
90
80
70
60
50
40
30
20
10
0
Jun 2010
Dec 2010 Jun 2011
Dec 2011 Jun 2012
Dec 2012 Jun 2013
Dec 2013
Average DOM this
month at 82,
below the 5 yr JAN
average of 86
3 MONTHS
N 78
O
V
D 83
E
C 5.72%
J 82
A
N -0.64%
AVERAGE DOM OF CLOSED SALES & BEDROOMS DISTRIBUTION BY PRICE
Distribution of Average Days on Market to Sale by Price Range %
AVDOM
2 Beds
3 Beds
4 Beds
5 Beds+
Ready to Buy or Sell Real Estate?
Contact an experienced REALTOR
$25,000
and less
125
5.04%
83.5
97.1
74.9
54.8
21.0
$25,001
$50,000
243
9.79%
79.6
97.6
68.2
70.3
98.5
$50,001
$100,000
569
22.93%
83.3
88.7
82.5
74.2
8.0
$100,001
$150,000
580
23.37%
78.9
103.6
72.8
81.3
101.9
$150,001
$200,000
376
15.15%
76.9
93.1
76.2
71.0
59.4
$200,001
$275,000
315
12.69%
86.6
101.0
80.8
86.0
118.1
$275,001
and up
274
11.04%
92.9
117.1
110.1
85.0
85.8
96.2
500
52.04M
77.9
1358
175.14M
Average Closed DOM:
Total Closed Units:
Total Closed Volume:
82.4
2,482
378,530,713
80.3
547
125.56M
Reports produced and compiled by RE STATS Inc. Information is deemed reliable but not guaranteed. Does not reflect all market activity.
Steve Reese
405-848-9944
steve@oklahomarealtors.com
86.9
77
25.80M
pp. 6
8. Monthly Inventory Analysis
Data from the The Oklahoma Association of
REALTORS®
January 2014
Closed Sales as of Feb 12, 2014
Average List Price at Closing
Report Produced on: Feb 12, 2014
Area Delimited by Entire OK State MLS - Single-Family Property Type
JANUARY
2010
2011
2012
YEAR TO DATE (YTD)
2013
154,477
150,211
2014
158,360
2011
2012
2013
2014
154,477
150,211
142,068
139,073
2010
158,360
142,068
139,073
1 Year
+2.51%
2 Year
+11.47%
1 Year
+2.51%
2 Year
+11.47%
5 YEAR MARKET ACTIVITY TRENDS
5yr JAN AVG = 149K
Average List Price
High
Jul 2013 = 176,626
Low
Jan 2010 = 139,073
200,000
100,000
0
Jun 2010 Dec 2010 Jun 2011 Dec 2011 Jun 2012 Dec 2012 Jun 2013 Dec 2013
3 MONTHS
N 169,908
O
V
D 164,936
E
Average LPrice this C -2.93%
month at 158,360,
above the 5 yr JAN J 158,360
A
average of 148,838 N -3.99%
AVERAGE LIST PRICE OF CLOSED SALES & BEDROOMS DISTRIBUTION BY PRICE
Distribution of Average List Price at Closing by Price Range
%
AVL$
2 Beds
3 Beds
4 Beds
5 Beds+
105
4.23%
17,528
18,643
23,524
16,600
15,950
$25,001
$50,000
246
9.91%
39,415
40,877
45,809
39,523
36,700
$50,001
$100,000
Ready to Buy or Sell Real Estate?
Contact an experienced REALTOR
$25,000
and less
551
22.20%
77,196
75,590
81,033
79,814
70,000
$100,001
$150,000
578
23.29% 127,970
130,783 129,837 135,722 143,895
$150,001
$200,000
398
16.04% 172,875
177,375 174,288 175,675 183,475
$200,001
$275,000
315
12.69% 235,966
236,947 237,450 241,061 253,177
$275,001
and up
289
11.64% 421,720
390,713 403,416 416,071 533,195
Average List Price:
Total Closed Units:
Total List Volume:
$158,360
2,482
393,048,974
$108,828 $134,202 $236,508 $350,893
500
1358
547
77
54.41M 182.25M 129.37M
27.02M
Reports produced and compiled by RE STATS Inc. Information is deemed reliable but not guaranteed. Does not reflect all market activity.
Steve Reese
405-848-9944
steve@oklahomarealtors.com
pp. 7
9. Monthly Inventory Analysis
Data from the The Oklahoma Association of
REALTORS®
January 2014
Closed Sales as of Feb 12, 2014
Average Sold Price at Closing
Report Produced on: Feb 12, 2014
Area Delimited by Entire OK State MLS - Single-Family Property Type
JANUARY
2010
2011
143,656
133,432
2012
YEAR TO DATE (YTD)
2013
2014
149,464
2010
2011
2012
152,510
143,656
136,117
133,432
2013
2014
149,464
152,510
136,117
1 Year
+2.04%
2 Year
+12.04%
1 Year
+2.04%
2 Year
+12.04%
5 YEAR MARKET ACTIVITY TRENDS
5yr JAN AVG = 143K
Average Sold Price
High
Jul 2013 = 171,577
Low
Jan 2010 = 133,432
200,000
100,000
0
Jun 2010 Dec 2010 Jun 2011 Dec 2011 Jun 2012 Dec 2012 Jun 2013 Dec 2013
3 MONTHS
N 164,003
O
V
D 159,616
E
Average SPrice this C -2.68%
month at 152,510,
above the 5 yr JAN J 152,510
A
average of 143,036 N -4.45%
AVERAGE SOLD PRICE OF CLOSED SALES & BEDROOMS DISTRIBUTION BY PRICE
Distribution of Average Sold Price at Closing by Price Range
%
AVS$
2 Beds
3 Beds
4 Beds
5 Beds+
125
5.04%
17,242
15,857
18,643
15,677
16,426
$25,001
$50,000
243
9.79%
38,034
36,844
39,216
37,304
33,049
$50,001
$100,000
Ready to Buy or Sell Real Estate?
Contact an experienced REALTOR
$25,000
and less
569
22.93%
75,469
71,931
77,087
75,591
62,500
$100,001
$150,000
580
23.37% 126,300
124,132 125,613 130,291 136,765
$150,001
$200,000
376
15.15% 171,356
173,619 170,358 171,630 179,053
$200,001
$275,000
315
12.69% 233,034
231,344 230,252 236,038 239,710
$275,001
and up
274
11.04% 412,780
375,204 385,807 403,017 509,188
Average Closed Price:
Total Closed Units:
Total Closed Volume:
$152,510
2,482
378,530,713
$104,075 $128,966 $229,542 $335,035
500
1358
547
77
52.04M 175.14M 125.56M
25.80M
Reports produced and compiled by RE STATS Inc. Information is deemed reliable but not guaranteed. Does not reflect all market activity.
Steve Reese
405-848-9944
steve@oklahomarealtors.com
pp. 8
10. Monthly Inventory Analysis
Data from the The Oklahoma Association of
REALTORS®
January 2014
Closed Sales as of Feb 12, 2014
Average Percent of List Price to Selling Price
Report Produced on: Feb 12, 2014
Area Delimited by Entire OK State MLS - Single-Family Property Type
JANUARY
2010
2011
2013
2014
96.34%
95.46%
2012
YEAR TO DATE (YTD)
96.25%
2011
2012
95.22%
2013
2014
96.34%
95.46%
95.30%
95.22%
2010
96.25%
95.30%
1 Year
-0.09%
2 Year
+0.99%
1 Year
-0.09%
2 Year
+0.99%
5 YEAR MARKET ACTIVITY TRENDS
5yr JAN AVG=95.71%
Average List/Sell Price
High
Dec 2013 = 97.23%
Low
Jan 2011 = 95.22%
98
97
96
95
Jun 2010
Dec 2010 Jun 2011
Dec 2011 Jun 2012
Dec 2012 Jun 2013
Dec 2013
3 MONTHS
N 96.25%
O
V
D 97.23%
E
Average List/Sell this C 1.02%
month at 96.25%,
above the 5 yr JAN J 96.25%
A
average of 95.71% N -1.01%
AVERAGE L/S% OF CLOSED SALES & BEDROOMS DISTRIBUTION BY PRICE
Distribution of $avgmed L/S % by Price Range
%
AVL/S%
2 Beds
3 Beds
4 Beds
5 Beds+
125
5.04% 89.79% 86.85% 91.77% 94.34%102.87%
$25,001
$50,000
243
9.79% 91.81% 92.05% 90.88% 95.86% 92.55%
$50,001
$100,000
Ready to Buy or Sell Real Estate?
Contact an experienced REALTOR
$25,000
and less
569
22.93% 96.75% 96.16% 97.08% 96.51% 89.29%
$100,001
$150,000
580
23.37% 96.56% 95.09% 96.94% 96.28% 95.66%
$150,001
$200,000
376
15.15% 98.36% 97.91% 98.72% 97.87% 97.68%
$200,001
$275,000
315
12.69% 97.54% 97.77% 97.15% 98.03% 95.22%
$275,001
and up
274
11.04% 97.05% 96.33% 97.04% 97.28% 96.51%
Average List/Sell Ratio:
Total Closed Units:
Total Closed Volume:
96.20%
2,482
378,530,713
94.54%
500
52.04M
96.48%
1358
175.14M
97.24%
547
125.56M
Reports produced and compiled by RE STATS Inc. Information is deemed reliable but not guaranteed. Does not reflect all market activity.
Steve Reese
405-848-9944
steve@oklahomarealtors.com
96.15%
77
25.80M
pp. 9
11. Monthly Inventory Analysis
Data from the The Oklahoma Association of
REALTORS®
January 2014
Inventory as of Feb 12, 2014
Market Summary
Report Produced on: Feb 12, 2014
Area Delimited by Entire OK State MLS - Single-Family Property Type
Inventory
Inventory
Market Activity
New Listings
5,849 = 22.80%
Closed Sales
2,482 = 8.83%
Start Inventory
19,802
Pending Sales
3,483 = 12.39%
Total Inventory
Units
25,651
Volume
$5,026,512,991
Other Off Market
2,962 = 10.53%
Active Inventory
19,192 = 68.25%
JANUARY
Absorption: Last 12 months, an Average of 3,641 Sales/Month
Pending Listings
2,482
3,483
5,849
158,360
152,510
96.25%
82.43
19,192
5.27
-1.97%
1.66%
-1.43%
2.51%
2.04%
-0.09%
0.87%
-6.61%
-12.00%
2013
2014
2,482
3,483
5,849
158,360
152,510
96.25%
82.43
19,192
5.27
2,532
3,426
5,934
154,477
149,464
96.34%
81.71
20,550
5.99
+/-%
-1.97%
1.66%
-1.43%
2.51%
2.04%
-0.09%
0.87%
-6.61%
-12.00%
2013
2014
AVERAGE PRICES
List Price
Sale Price
158,360
5,849
154,477
3,426
-1.43%
3,483
149,464
+1.66%
+2.51%
2013
2014
INVENTORY
20,550
+/-%
2013
2014
JANUARY MARKET
Active Inventory
2014
2,532
3,426
5,934
154,477
149,464
96.34%
81.71
20,550
5.99
Closed Sales
Pending Sales
New Listings
Average List Price
Average Sale Price
Average Percent of List Price to Selling Price
Average Days on Market to Sale
Monthly Inventory
Months Supply of Inventory
5,934
Year To Date
2013
Active Inventory as of January 31, 2014 = 19,192
New Listings
Market Activity
Monthly Supply of Inventory
5.99
+2.04%
AVERAGE L/S% & DOM
% of List to Sale Price
82.43
5.27
96.25%
-6.61%
-12.00%
-0.09%
81.71
+0.87%
Reports produced and compiled by RE STATS Inc. Information is deemed reliable but not guaranteed. Does not reflect all market activity.
405-848-9944
2013
2014
Days on Market to Sale
96.34%
19,192
Steve Reese
152,510
steve@oklahomarealtors.com
pp. 10