March 2014 Housing Sales Statistics
•
0 gefällt mir•123 views

The Oklahoma Association of REALTORS® is committed to providing accurate, up-to-date housing information for our state, including monthly data on number of houses sold, average days on market, average sold price and more.

Empfohlen
Weitere ähnliche Inhalte
Kürzlich hochgeladen
Kürzlich hochgeladen (20)
Empfohlen
Empfohlen (20)
March 2014 Housing Sales Statistics
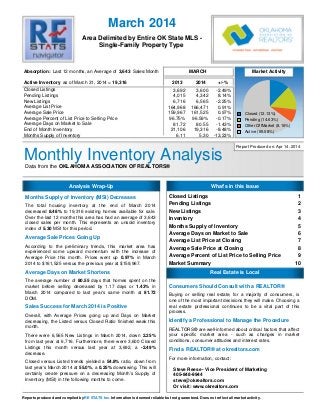
- 1. Monthly Inventory AnalysisData from the OKLAHOMA ASSOCIATION OF REALTORS® Area Delimited by Entire OK State MLS - Single-Family Property Type March 2014 Report Produced on: Apr 14, 2014 Absorption: Active Inventory 3,643 19,316 MARCH Market Activity 2013 2014 +/-% Last 12 months, an Average of Sales/Month as of March 31, 2014 = Closed Listings Pending Listings New Listings Average List Price Average Sale Price Average Percent of List Price to Selling Price Average Days on Market to Sale End of Month Inventory Months Supply of Inventory Closed Listings 1 Pending Listings 2 New Listings 3 Inventory 4 Months Supply of Inventory 5 Average Days on Market to Sale 6 Average List Price at Closing 7 Average Sale Price at Closing 8 Average Percent of List Price to Selling Price 9 Market Summary 10 3,692 3,600 -2.49% 4,015 4,342 8.14% 6,716 6,565 -2.25% 164,968 166,471 0.91% 159,967 161,525 0.97% 96.75% 96.59% -0.17% 81.72 80.55 -1.43% 21,106 19,316 -8.48% 6.11 5.30 -13.23% Analysis Wrap-Up What's in this Issue Real Estate is Local Closed (12.13%) Pending (14.63%) Other OffMarket (8.16%) Active (65.08%) Months Supply of Inventory (MSI) Decreases The total housing inventory at the end of March 2014 decreased 8.48% to 19,316 existing homes available for sale. Over the last 12 months this area has had an average of 3,643 closed sales per month. This represents an unsold inventory index of 5.30 MSI for this period. Average Sale Prices Going Up According to the preliminary trends, this market area has experienced some upward momentum with the increase of Average Price this month. Prices went up 0.97% in March 2014 to $161,525 versus the previous year at $159,967. Average Days on Market Shortens The average number of 80.55 days that homes spent on the market before selling decreased by 1.17 days or 1.43% in March 2014 compared to last year’s same month at 81.72 DOM. Sales Success for March 2014 is Positive Overall, with Average Prices going up and Days on Market decreasing, the Listed versus Closed Ratio finished weak this month. There were 6,565 New Listings in March 2014, down 2.25% from last year at 6,716. Furthermore, there were 3,600 Closed Listings this month versus last year at 3,692, a -2.49% decrease. Closed versus Listed trends yielded a 54.8% ratio, down from last year’s March 2014 at 55.0%, a 0.25% downswing. This will certainly create pressure on a decreasing Month’s Supply of Inventory (MSI) in the following months to come. Consumers Should Consult with a REALTOR® Buying or selling real estate, for a majority of consumers, is one of the most important decisions they will make. Choosing a real estate professional continues to be a vital part of this process. Identify a Professional to Manage the Procedure REALTORS® are well-informed about critical factors that affect your specific market area - such as changes in market conditions, consumer attitudes and interest rates. Find a REALTOR® at okrealtors.com For more information, contact: Steve Reese - Vice President of Marketing 405-848-9944 steve@okrealtors.com Or visit: www.okrealtors.com Reports produced and compiled by Information is deemed reliable but not guaranteed. Does not reflect all market activity.RE STATS Inc.
- 2. Monthly Inventory Analysis OKLAHOMA ASSOCIATION OF REALTORS® March 2014 ClosedListings Closed Listings ReadytoBuyorSellRealEstate? ContactanexperiencedREALTOR Data from the Area Delimited by Entire OK State MLS - Single-Family Property Type Closed Sales as of Apr 11, 2014 Report Produced on: Apr 14, 2014 MARCH YEAR TO DATE (YTD) 5 YEAR MARKET ACTIVITY TRENDS 5yr MAR AVG = 3,362 3 MONTHS CLOSED LISTINGS & BEDROOMS DISTRIBUTION BY PRICE High Low Jul 2013 = 4,633 Jan 2010 = 1,720 Closed Listingsthis month at above the 5 yr MAR average of 3,600, 3,362 J A N F E B M A R Distribution of Closed Listings by Price Range % AVDOM 2 Beds 3 Beds 4 Beds 5 Beds+ 2010 3,310 2011 2,778 2012 3,428 2013 3,692 2014 3,600 1 Year 2 Year -2.49% +5.02% 2010 7,218 2011 6,850 2012 8,477 2013 8,964 2014 8,866 1 Year 2 Year -1.09% +4.59% 2,523 2,743 8.72% 3,600 31.24% 160 4.44% 74.7 72 77 11 0 $25,000 and less 583 16.19% 77.8 200 346 34 3 $25,001 $75,000 414 11.50% 85.2 93 275 40 6 $75,001 $100,000 923 25.64% 72.8 140 660 110 13 $100,001 $150,000 654 18.17% 77.0 77 399 170 8 $150,001 $200,000 438 12.17% 88.2 51 184 190 13 $200,001 $275,000 428 11.89% 96.3 29 119 226 54 $275,001 and up 5,000 4,000 3,000 2,000 1,000 0 Jun 2010 Dec 2010 Jun 2011 Dec 2011 Jun 2012 Dec 2012 Jun 2013 Dec 2013 Total Closed Units: Total Closed Volume: Average Closed Price: 3,600 581,490,364 $161,525 80.6 662 75.87M $114,602 2060 283.86M $137,795 781 181.78M $232,756 97 39.98M $412,215 pp. 1Reports produced and compiled by Information is deemed reliable but not guaranteed. Does not reflect all market activity.RE STATS Inc. Steve Reese - Vice President of Marketing 405-848-9944 steve@okrealtors.com
- 3. Monthly Inventory Analysis OKLAHOMA ASSOCIATION OF REALTORS® March 2014 PendingListings Pending Listings ReadytoBuyorSellRealEstate? ContactanexperiencedREALTOR Data from the Area Delimited by Entire OK State MLS - Single-Family Property Type Pending Listings as of Apr 11, 2014 Report Produced on: Apr 14, 2014 MARCH YEAR TO DATE (YTD) 5 YEAR MARKET ACTIVITY TRENDS 5yr MAR AVG = 3,985 3 MONTHS PENDING LISTINGS & BEDROOMS DISTRIBUTION BY PRICE High Low Apr 2010 = 4,937 Dec 2010 = 2,050 Pending Listingsthis month at above the 5 yr MAR average of 4,342, 3,985 J A N F E B M A R Distribution of Pending Listings by Price Range % AVDOM 2 Beds 3 Beds 4 Beds 5 Beds+ 2010 4,153 2011 3,554 2012 3,861 2013 4,015 2014 4,342 1 Year 2 Year +8.14% +12.46% 2010 9,529 2011 8,449 2012 10,381 2013 11,086 2014 11,155 1 Year 2 Year +0.62% +7.46% 3,379 3,434 1.63% 4,342 26.44% 145 3.34% 75.3 70 64 11 0 $25,000 and less 652 15.02% 76.2 229 369 50 4 $25,001 $75,000 495 11.40% 72.1 114 322 57 2 $75,001 $100,000 1,130 26.02% 65.6 182 817 123 8 $100,001 $150,000 816 18.79% 61.2 104 504 196 12 $150,001 $200,000 550 12.67% 79.1 69 243 224 14 $200,001 $275,000 554 12.76% 65.7 46 156 274 78 $275,001 and up 5,000 4,000 3,000 2,000 1,000 0 Jun 2010 Dec 2010 Jun 2011 Dec 2011 Jun 2012 Dec 2012 Jun 2013 Dec 2013 Total Pending Units: Total Pending Volume: Average Listing Price: 4,342 727,190,210 $153,936 81.4 814 97.85M $120,204 2475 356.15M $143,897 935 224.29M $239,883 118 48.91M $414,465 pp. 2Reports produced and compiled by Information is deemed reliable but not guaranteed. Does not reflect all market activity.RE STATS Inc. Steve Reese - Vice President of Marketing 405-848-9944 steve@okrealtors.com
- 4. Monthly Inventory Analysis OKLAHOMA ASSOCIATION OF REALTORS® March 2014 NewListings New Listings ReadytoBuyorSellRealEstate? ContactanexperiencedREALTOR Data from the Area Delimited by Entire OK State MLS - Single-Family Property Type New Listings as of Apr 11, 2014 Report Produced on: Apr 14, 2014 MARCH YEAR TO DATE (YTD) 5 YEAR MARKET ACTIVITY TRENDS 5yr MAR AVG = 6,913 3 MONTHS NEW LISTINGS & BEDROOMS DISTRIBUTION BY PRICE High Low Apr 2010 = 7,795 Dec 2013 = 3,477 New Listings this month at below the 5 yr MAR average of 6,565, 6,913 J A N F E B M A R Distribution of New Listings by Price Range % 2 Beds 3 Beds 4 Beds 5 Beds+ 2010 7,578 2011 6,951 2012 6,755 2013 6,716 2014 6,565 1 Year 2 Year -2.25% -2.81% 2010 17,973 2011 16,791 2012 18,580 2013 18,135 2014 17,681 1 Year 2 Year -2.50% -4.84% 5,896 5,220 -11.47% 6,565 25.77% 577 8.79% 267 262 42 6 $50,000 and less 598 9.11% 231 316 50 1 $50,001 $75,000 694 10.57% 183 434 70 7 $75,001 $100,000 2,147 32.70% 387 1,431 301 28 $100,001 $175,000 879 13.39% 103 469 295 12 $175,001 $225,000 912 13.89% 102 321 423 66 $225,001 $325,000 758 11.55% 75 177 375 131 $325,001 and up 8,000 7,000 6,000 5,000 4,000 3,000 2,000 1,000 0 Jun 2010 Dec 2010 Jun 2011 Dec 2011 Jun 2012 Dec 2012 Jun 2013 Dec 2013 Total New Listed Units: Total New Listed Volume: Average New Listed Listing Price: 6,565 1,240,284,504 $166,552 1348 178.18M $132,181 3410 527.58M $154,716 1556 425.13M $273,220 251 109.39M $435,820 pp. 3Reports produced and compiled by Information is deemed reliable but not guaranteed. Does not reflect all market activity.RE STATS Inc. Steve Reese - Vice President of Marketing 405-848-9944 steve@okrealtors.com
- 5. Monthly Inventory Analysis OKLAHOMA ASSOCIATION OF REALTORS® March 2014 ActiveInventory Active Inventory ReadytoBuyorSellRealEstate? ContactanexperiencedREALTOR Data from the Area Delimited by Entire OK State MLS - Single-Family Property Type Active Inventory as of Apr 11, 2014 Report Produced on: Apr 14, 2014 END OF MARCH ACTIVE DURING MARCH 5 YEAR MARKET ACTIVITY TRENDS 5yr MAR AVG = 21,821 3 MONTHS INVENTORY & BEDROOMS DISTRIBUTION BY PRICE High Low Jul 2011 = 26,774 Mar 2014 = 19,316 Inventory this month at below the 5 yr MAR average of 19,316, 21,821 J A N F E B M A R Distribution of Inventory by Price Range % AVDOM 2 Beds 3 Beds 4 Beds 5 Beds+ 2010 21,450 2011 24,086 2012 23,165 2013 21,090 2014 19,316 1 Year 2 Year -8.41% -16.62% 2010 27,751 2011 30,405 2012 29,613 2013 27,349 2014 26,084 1 Year 2 Year -4.63% -11.92% 20,000 19,528 -2.36% 19,316 -1.09% 1,800 9.32% 130.1 907 773 109 11 $50,000 and less 2,062 10.68% 125.0 817 1,081 150 14 $50,001 $75,000 2,268 11.74% 114.9 634 1,387 222 25 $75,001 $100,000 5,332 27.60% 103.2 1,005 3,413 838 76 $100,001 $175,000 3,410 17.65% 105.0 532 1,674 1,099 105 $175,001 $250,000 2,374 12.29% 110.2 299 723 1,141 211 $250,001 $375,000 2,070 10.72% 121.4 231 435 982 422 $375,001 and up 30,000 20,000 10,000 0 Jun 2010 Dec 2010 Jun 2011 Dec 2011 Jun 2012 Dec 2012 Jun 2013 Dec 2013 Total Active Inventory by Units: Total Active Inventory by Volume: Average Active Inventory Listing Price: 19,316 3,976,941,764 $205,888 112.5 4,425 639.39M $144,495 9,486 1.53B $161,800 4,541 1.35B $297,907 864 449.92M $520,736 pp. 4Reports produced and compiled by Information is deemed reliable but not guaranteed. Does not reflect all market activity.RE STATS Inc. Steve Reese - Vice President of Marketing 405-848-9944 steve@okrealtors.com
- 6. Monthly Inventory Analysis OKLAHOMA ASSOCIATION OF REALTORS® March 2014 MonthsSupply Months Supply of Inventory ReadytoBuyorSellRealEstate? ContactanexperiencedREALTOR Data from the Area Delimited by Entire OK State MLS - Single-Family Property Type Active Inventory as of Apr 11, 2014 Report Produced on: Apr 14, 2014 MSI FOR MARCH INDICATORS FOR MARCH 2014 5 YEAR MARKET ACTIVITY TRENDS 5yr MAR AVG = 6.8 3 MONTHS MONTHS SUPPLY & BEDROOMS DISTRIBUTION BY PRICE High Low Jun 2011 = 9.7 Mar 2014 = 5.3 Months Supply this month at below the 5 yr MAR average of 5.3, 6.8 J A N F E B M A R Distribution of Active Inventory by Price Range and MSI % MSI 2 Beds 3 Beds 4 Beds 5 Beds+ 2010 6.7 2011 8.4 2012 7.5 2013 6.1 2014 5.3 1 Year 2 Year -13.16% -29.50% Inventory 19,316 End of Month Active Inventory Closed 43,719 Closed Last 12 Months Absorption 3,643 Average Closed per Month over 12 Months MSI 5.3 Months Supply of Inventory MSI % 18.861% Percent Months Supply of Inventory 5.5 5.3 -2.37% 5.3 -0.88% 1,800 9.32% 4.3 4.9 3.7 4.2 2.8 $50,000 and less 2,558 13.24% 6.3 8.0 5.6 6.0 5.1 $50,001 $80,000 2,367 12.25% 5.1 6.0 4.7 6.0 9.5 $80,001 $110,000 5,107 26.44% 4.2 4.9 3.9 4.2 6.7 $110,001 $180,000 3,040 15.74% 5.2 6.1 5.3 4.6 5.7 $180,001 $250,000 2,437 12.62% 6.5 8.5 6.4 6.0 8.1 $250,001 $380,000 2,007 10.39% 12.2 18.6 13.3 10.8 12.6 $380,001 and up 10 9 8 7 6 5 4 3 2 1 0 Jun 2010 Dec 2010 Jun 2011 Dec 2011 Jun 2012 Dec 2012 Jun 2013 Dec 2013 MSI: Total Active Inventory: 19,316 5.3 6.1 4,425 4.7 9,486 5.6 4,541 8.8 864 pp. 5Reports produced and compiled by Information is deemed reliable but not guaranteed. Does not reflect all market activity.RE STATS Inc. Steve Reese - Vice President of Marketing 405-848-9944 steve@okrealtors.com
- 7. Monthly Inventory Analysis OKLAHOMA ASSOCIATION OF REALTORS® March 2014 AverageDaysonMarket Average Days on Market to Sale ReadytoBuyorSellRealEstate? ContactanexperiencedREALTOR Data from the Area Delimited by Entire OK State MLS - Single-Family Property Type Closed Sales as of Apr 11, 2014 Report Produced on: Apr 14, 2014 MARCH YEAR TO DATE (YTD) 5 YEAR MARKET ACTIVITY TRENDS 5yr MAR AVG = 87 3 MONTHS AVERAGE DOM OF CLOSED SALES & BEDROOMS DISTRIBUTION BY PRICE High Low Mar 2011 = 98 Jul 2013 = 69 Average DOM this month at below the 5 yr MAR average of 81, 87 J A N F E B M A R Distribution of Average Days on Market to Sale by Price Range % AVDOM 2 Beds 3 Beds 4 Beds 5 Beds+ 2010 82 2011 98 2012 94 2013 82 2014 81 1 Year 2 Year -1.43% -13.98% 2010 83 2011 96 2012 93 2013 83 2014 83 1 Year 2 Year -0.65% -10.77% 83 85 2.02% 81 -5.18% 160 4.44% 74.7 69.9 74.7 105.2 0.0 $25,000 and less 583 16.19% 77.8 90.5 72.3 49.1 189.7 $25,001 $75,000 414 11.50% 85.2 81.8 79.6 130.7 91.3 $75,001 $100,000 923 25.64% 72.8 87.0 67.8 80.7 110.5 $100,001 $150,000 654 18.17% 77.0 103.6 73.9 69.9 126.6 $150,001 $200,000 438 12.17% 88.2 100.3 82.6 86.6 142.4 $200,001 $275,000 428 11.89% 96.3 124.2 97.3 83.6 132.0 $275,001 and up 100 90 80 70 60 50 40 30 20 10 0 Jun 2010 Dec 2010 Jun 2011 Dec 2011 Jun 2012 Dec 2012 Jun 2013 Dec 2013 Average Closed DOM: Total Closed Units: Total Closed Volume: 80.6 3,600 581,490,364 90.1 662 75.87M 74.6 2060 283.86M 82.1 781 181.78M 129.3 97 39.98M pp. 6Reports produced and compiled by Information is deemed reliable but not guaranteed. Does not reflect all market activity.RE STATS Inc. Steve Reese - Vice President of Marketing 405-848-9944 steve@okrealtors.com
- 8. Monthly Inventory Analysis OKLAHOMA ASSOCIATION OF REALTORS® March 2014 AverageListPrice Average List Price at Closing ReadytoBuyorSellRealEstate? ContactanexperiencedREALTOR Data from the Area Delimited by Entire OK State MLS - Single-Family Property Type Closed Sales as of Apr 11, 2014 Report Produced on: Apr 14, 2014 MARCH YEAR TO DATE (YTD) 5 YEAR MARKET ACTIVITY TRENDS 5yr MAR AVG = 155K 3 MONTHS AVERAGE LIST PRICE OF CLOSED SALES & BEDROOMS DISTRIBUTION BY PRICE High Low Jul 2013 = 176,633 Jan 2010 = 139,091 Average LPrice this month at above the 5 yr MAR average of 166,471, 155,417 J A N F E B M A R Distribution of Average List Price at Closing by Price Range % AVL$ 2 Beds 3 Beds 4 Beds 5 Beds+ 2010 144,429 2011 147,486 2012 153,729 2013 164,968 2014 166,471 1 Year 2 Year +0.91% +8.29% 2010 143,605 2011 148,329 2012 148,916 2013 161,167 2014 161,035 1 Year 2 Year -0.08% +8.14% 157,919 156,768 -0.73% 166,471 6.19% 141 3.92% 19,438 22,535 21,183 25,690 0 $25,000 and less 559 15.53% 51,041 52,851 54,704 53,142 53,200 $25,001 $75,000 425 11.81% 89,484 90,577 92,261 91,375 86,483 $75,001 $100,000 905 25.14% 127,601 132,471 128,729 132,683 131,838 $100,001 $150,000 676 18.78% 175,040 178,517 176,896 180,610 179,013 $150,001 $200,000 449 12.47% 236,124 240,325 235,841 242,589 247,158 $200,001 $275,000 445 12.36% 427,337 472,878 400,142 395,427 636,876 $275,001 and up 200,000 100,000 0 Jun 2010 Dec 2010 Jun 2011 Dec 2011 Jun 2012 Dec 2012 Jun 2013 Dec 2013 Average List Price: Total Closed Units: Total List Volume: $166,471 3,600 599,293,851 $119,151 662 78.88M $141,983 2060 292.49M $238,799 781 186.50M $427,101 97 41.43M pp. 7Reports produced and compiled by Information is deemed reliable but not guaranteed. Does not reflect all market activity.RE STATS Inc. Steve Reese - Vice President of Marketing 405-848-9944 steve@okrealtors.com
- 9. Monthly Inventory Analysis OKLAHOMA ASSOCIATION OF REALTORS® March 2014 AverageSoldPrice Average Sold Price at Closing ReadytoBuyorSellRealEstate? ContactanexperiencedREALTOR Data from the Area Delimited by Entire OK State MLS - Single-Family Property Type Closed Sales as of Apr 11, 2014 Report Produced on: Apr 14, 2014 MARCH YEAR TO DATE (YTD) 5 YEAR MARKET ACTIVITY TRENDS 5yr MAR AVG = 150K 3 MONTHS AVERAGE SOLD PRICE OF CLOSED SALES & BEDROOMS DISTRIBUTION BY PRICE High Low Jul 2013 = 171,586 Jan 2010 = 133,454 Average SPrice this month at above the 5 yr MAR average of 161,525, 149,934 J A N F E B M A R Distribution of Average Sold Price at Closing by Price Range % AVS$ 2 Beds 3 Beds 4 Beds 5 Beds+ 2010 139,264 2011 141,128 2012 147,785 2013 159,967 2014 161,525 1 Year 2 Year +0.97% +9.30% 2010 138,144 2011 142,000 2012 143,037 2013 155,789 2014 155,724 1 Year 2 Year -0.04% +8.87% 151,985 151,551 -0.29% 161,525 6.58% 160 4.44% 18,053 18,661 17,295 19,382 0 $25,000 and less 583 16.19% 50,483 49,344 51,352 48,361 50,173 $25,001 $75,000 414 11.50% 88,105 87,424 88,563 87,212 83,598 $75,001 $100,000 923 25.64% 126,117 126,486 125,513 129,000 128,446 $100,001 $150,000 654 18.17% 173,849 173,462 172,747 176,569 174,775 $150,001 $200,000 438 12.17% 234,957 235,232 230,290 238,848 243,066 $200,001 $275,000 428 11.89% 419,814 464,216 388,780 384,284 613,053 $275,001 and up 200,000 100,000 0 Jun 2010 Dec 2010 Jun 2011 Dec 2011 Jun 2012 Dec 2012 Jun 2013 Dec 2013 Average Closed Price: Total Closed Units: Total Closed Volume: $161,525 3,600 581,490,364 $114,602 662 75.87M $137,795 2060 283.86M $232,756 781 181.78M $412,215 97 39.98M pp. 8Reports produced and compiled by Information is deemed reliable but not guaranteed. Does not reflect all market activity.RE STATS Inc. Steve Reese - Vice President of Marketing 405-848-9944 steve@okrealtors.com
- 10. Monthly Inventory Analysis OKLAHOMA ASSOCIATION OF REALTORS® March 2014 AverageList/SellPrice Average Percent of List Price to Selling Price ReadytoBuyorSellRealEstate? ContactanexperiencedREALTOR Data from the Area Delimited by Entire OK State MLS - Single-Family Property Type Closed Sales as of Apr 11, 2014 Report Produced on: Apr 14, 2014 MARCH YEAR TO DATE (YTD) 5 YEAR MARKET ACTIVITY TRENDS 5yr MAR AVG=96.22% 3 MONTHS AVERAGE L/S% OF CLOSED SALES & BEDROOMS DISTRIBUTION BY PRICE High Low Dec 2013 = 97.05% Jan 2011 = 95.22% Average List/Sell this month at above the 5 yr MAR average of 96.59%, 96.22% J A N F E B M A R Distribution of Average L/S % by Price Range % AVL/S% 2 Beds 3 Beds 4 Beds 5 Beds+ 2010 96.50% 2011 95.64% 2012 95.64% 2013 96.75% 2014 96.59% 1 Year 2 Year -0.17% +0.99% 2010 96.03% 2011 95.45% 2012 95.52% 2013 96.39% 2014 96.30% 1 Year 2 Year -0.09% +0.82% 95.91% 96.29% 0.39% 96.59% 0.32% 160 4.44% 86.11% 88.86% 84.75% 77.60% 0.00% $25,000 and less 583 16.19% 95.11% 93.90% 96.12% 91.98% 94.92% $25,001 $75,000 414 11.50% 96.48% 96.83% 96.48% 95.65% 96.62% $75,001 $100,000 923 25.64% 97.36% 95.69% 97.64% 97.59% 99.52% $100,001 $150,000 654 18.17% 97.76% 97.35% 97.81% 97.85% 97.72% $150,001 $200,000 438 12.17% 98.18% 98.18% 97.82% 98.52% 98.43% $200,001 $275,000 428 11.89% 97.53% 98.02% 97.74% 97.65% 96.35% $275,001 and up 98 97 96 95 Jun 2010 Dec 2010 Jun 2011 Dec 2011 Jun 2012 Dec 2012 Jun 2013 Dec 2013 Average List/Sell Ratio: Total Closed Units: Total Closed Volume: 96.60% 3,600 581,490,364 95.05% 662 75.87M 96.80% 2060 283.86M 97.26% 781 181.78M 97.14% 97 39.98M pp. 9Reports produced and compiled by Information is deemed reliable but not guaranteed. Does not reflect all market activity.RE STATS Inc. Steve Reese - Vice President of Marketing 405-848-9944 steve@okrealtors.com
- 11. Monthly Inventory Analysis OKLAHOMA ASSOCIATION OF REALTORS® March 2014 Market Summary Data from the Area Delimited by Entire OK State MLS - Single-Family Property Type Inventory as of Apr 11, 2014 Report Produced on: Apr 14, 2014 Inventory Inventory Market Activity Market Activity New Listings Closed Sales Pending Sales Other Off Market Active Inventory Start Inventory Total Inventory Units Volume 6,565 = 25.15% 19,534 26,099 $5,189,818,447 3,600 = 12.13% 4,342 = 14.63% 2,421 = 8.16% 19,316 = 65.08% Absorption: Active Inventory 3,643 19,316 MARCH Year To Date 2013 2014 +/-% 2013 2014 +/-% Last 12 months, an Average of Sales/Month as of March 31, 2014 = Closed Sales Pending Sales New Listings Average List Price Average Sale Price Average Percent of List Price to Selling Price Average Days on Market to Sale Monthly Inventory Months Supply of Inventory 3,692 3,600 -2.49% 4,015 4,342 8.14% 6,716 6,565 -2.25% 164,968 166,471 0.91% 159,967 161,525 0.97% 96.75% 96.59% -0.17% 81.72 80.55 -1.43% 21,106 19,316 -8.48% 6.11 5.30 -13.23% 8,964 8,866 -1.09% 11,086 11,155 0.62% 18,135 17,681 -2.50% 161,167 161,035 -0.08% 155,789 155,724 -0.04% 96.39% 96.30% -0.09% 83.23 82.69 -0.65% 21,106 19,316 -8.48% 6.11 5.30 -13.23% New Listings Pending Listings List Price Sale Price Active Inventory Monthly Supply of Inventory % of List to Sale Price Days on Market to Sale 2013 2014 2013 2014 2013 2014 2013 2014 MARCH MARKET AVERAGE PRICES INVENTORY AVERAGE L/S% & DOM 6,716 4,015 6,565 -2.25% 4,342 +8.14% 164,968 159,967 166,471 +0.91% 161,525 +0.97% 21,106 6.11 19,316 -8.48% 5.30 -13.23% 96.75% 81.72 96.59% -0.17% 80.55 -1.43% pp. 10Reports produced and compiled by Information is deemed reliable but not guaranteed. Does not reflect all market activity.RE STATS Inc. Steve Reese - Vice President of Marketing 405-848-9944 steve@okrealtors.com