Health at-a-glance-europe-2014-chartset
•
4 gefällt mir•43,145 views

The document is a report from the OECD and European Commission titled "Health at a Glance: Europe 2014" that was released in December 2014. It provides data and analysis on health status, risk factors, health care resources, quality of care, access to care, and health expenditure in European countries. The report finds that while life expectancy has increased across Europe, gaps remain between countries and education levels. It also examines trends in diseases, health risks, health workforce and capacity, treatment outcomes, financial barriers to care, and spending on health systems.

Empfohlen
Empfohlen
Weitere ähnliche Inhalte
Was ist angesagt?
Was ist angesagt? (19)
Ähnlich wie Health at-a-glance-europe-2014-chartset
Ähnlich wie Health at-a-glance-europe-2014-chartset (20)
Mehr von OECD Directorate for Employment, Labour and Social Affairs
Mehr von OECD Directorate for Employment, Labour and Social Affairs (20)
Kürzlich hochgeladen
Kürzlich hochgeladen (20)
Health at-a-glance-europe-2014-chartset
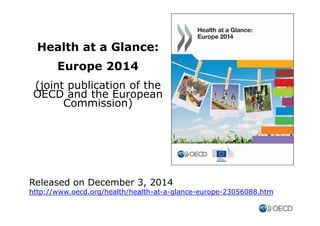
- 1. Health at a Glance: Europe 2014 (joint publication of the OECD and the European Commission) Released on December 3, 2014 http://www.oecd.org/health/health-at-a-glance-europe-23056088.htm
- 2. Table of Contents 1.Health status 2.Risk factors for health 3.Health care resources and activities 4.Quality of care 5.Access to care 6.Health expenditure Note by Turkey: The information in this document with reference to “Cyprus” relates to the southern part of the Island. There is no single authority representing both Turkish and Greek Cypriot people on the Island. Turkey recognises the Turkish Republic of Northern Cyprus (TRNC). Until a lasting and equitable solution is found within the context of the United Nations, Turkey shall preserve its position concerning the “Cyprus issue”. Note by all the European Union Member States of the OECD and the European Union: The Republic of Cyprus is recognised by all members of the United Nations with the exception of Turkey. The information in this document relates to the area under the effective control of the Government of the Republic of Cyprus.
- 3. 1. HEALTH STATUS • Life expectancy and mortality • Chronic diseases
- 4. Life expectancy across EU countries increased by over 5 years between 1990 and 2012, but the gap between countries with the highest and lowest longevity remains unchanged at around 8 years Source: Eurostat Statistics Database
- 5. Women live six years longer than men on average across EU countries, but the gender gap is one year only for healthy life years 2012 (or nearest year) Source: Eurostat Statistics Database
- 6. There are large gaps in life expectancy by education level: in Central and Eastern Europe, 65-year-old men with low education level can expect to live four to seven years less Gaps between people with high and low level of education at 65, 2010 (or nearest year) Source: Eurostat Statistics Database
- 7. The prevalence of chronic diseases such as diabetes is rising, due to changes in lifestyle and population ageing Prevalence estimates of diabetes, adults aged 20-79 years, 2013 Note: Data are age-standardised to the World Standard Population. Source: International Diabetes Federation (2013), Diabetes Atlas, 6th edition
- 8. 2. RISK FACTORS FOR HEALTH • Smoking • Alcohol consumption • Overweight and obesity
- 9. Smoking among adults has declined across EU countries, but still more than one-fifth of adults smoke daily Adult population smoking daily, 2012 and change between 2000 and 2012 (or nearest year) Source: Health at a Glance: Europe 2014, OECD
- 10. Alcohol consumption remains too high in several countries; it is 2 times higher in Lithuania, Estonia and Austria than in Italy Alcohol consumption among population aged 15 years and over, 2012 (or nearest year) Source: Health at a Glance: Europe 2014, OECD
- 11. Obesity among adults has increased in nearly all countries: 1 in 6 adults was obese around 2012, up from 1 in 8 in 2002 1. Data are based on measurements rather than self-reported height and weight. Source: Health at a Glance: Europe 2014, OECD
- 12. 3. HEALTH CARE RESOURCES AND ACTIVITIES • Doctors and nurses • Medical equipment • Hospital activities • Pharmaceutical consumption
- 13. The number of doctors per capita has increased in nearly all EU countries since 2000 Practising doctors per 1 000 population, 2000 and 2012 (or nearest year) 1. Data include not only doctors providing direct care to patients, but also those working in the health sector as managers, educators, researchers, etc. (adding another 5-10% of doctors). 2. Data refer to all doctors licensed to practice. Source: Health at a Glance: Europe 2014, OECD
- 14. The number of doctors continued to increase following the economic crisis, but at a slower rate in some countries Evolution in the number of doctors, selected EU countries, 2000 to 2012 (or nearest year) 1. Data refer to doctors licensed to practice. Source: Health at a Glance: Europe 2014, OECD
- 15. The number of nurses per capita has increased in all EU countries since 2000, except in the Slovak Republic and Lithuania Practising nurses per 1 000 population, 2012 and change between 2000 and 2012 (or nearest year) 1. Data include not only nurses providing direct care to patients, but also those working in the health sector as managers, educators, researchers, etc. 2. Austria reports only nurses employed in hospital. Source: Health at a Glance: Europe 2014, OECD
- 16. The number of MRI and CT scanners has increased in all EU countries. Italy and Greece have the highest number per capita 2012 (or nearest year) MRI units CT scanners Note: The EU average does not include countries which only report equipment in hospital. 1. Equipment outside hospital not included. Source: Health at a Glance: Europe 2014, OECD
- 17. The average length of stay in hospital has fallen in nearly all EU countries, reflecting efficiency gains Average length of stay in hospital, 2000 and 2012 (or nearest year) 1. Data refer to average length of stay for curative (acute) care only (resulting in an under-estimation). Source: Health at a Glance: Europe 2014, OECD
- 18. The average length of stay for normal delivery has become shorter in all EU countries, but large variations remain 2012 (or nearest year) Source: Health at a Glance: Europe 2014, OECD
- 19. The share of cataract surgeries performed as day cases has increased in all countries; it is now close to 100% in many countries Source: Health at a Glance: Europe 2014, OECD
- 20. The consumption of pharmaceuticals is increasing across EU countries, notably for antidiabetics and antidepressants Antidiabetics Antidepressants Source: Health at a Glance: Europe 2014, OECD
- 21. 4. QUALITY OF CARE • Acute care for life threatening conditions (cancers and heart attacks) • Management of chronic diseases • Prevention of communicable diseases
- 22. Survival for breast cancer has increased in most countries, but remain lower in Poland and Ireland than in Sweden and Finland Breast cancer five-year relative survival, 1997-2002 and 2007-12 (or nearest period) Note: 95% confidence intervals represented by |—|. Source: Health at a Glance: Europe 2014, OECD
- 23. In-hospital mortality rates following heart attack have fallen in all EU countries, reflecting improvements in acute care Reduction in case-fatality in adults aged 45 and over within 30 days after admission for AMI, 2001-11 (or nearest year) Note: 95% confidence intervals represented by |—|. Source: Health at a Glance: Europe 2014, OECD
- 24. Treatment for chronic diseases is not optimal. Too many people are still admitted to hospitals for asthma … Asthma hospital admission in adults, 2006 and 2011 (or nearest year) Note: 95% confidence intervals represented by |—|. Source: Health at a Glance: Europe 2014, OECD
- 25. … and too many people are admitted to hospitals for diabetes, highlighting the need to improve primary care Diabetes hospital admission in adults, 2006 and 2011 (or nearest year) Note: 95% confidence intervals represented by |—|. Source: Health at a Glance: Europe 2014, OECD
- 26. Vaccination rates against influenza among people aged 65+ have risen in some countries but fallen in others, increasing the risks of complications, hospitalisations and death Influenza vaccination coverage, population aged 65 and over, 2002-12 (or nearest year) Source: Health at a Glance: Europe 2014, OECD
- 27. 5. ACCESS TO CARE • Financial barriers • Geographic barriers • Timely access (waiting times)
- 28. Nearly all EU countries have universal (or almost universal) health coverage, except Bulgaria, Greece and Cyprus Health insurance coverage for a core set of services, 2012 (or nearest year) Source: Health at a Glance: Europe 2014, OECD
- 29. The number of doctors varies not only across countries, but also across regions in each country, creating geographic barriers Physician density, by NUTS 2 level, 2012 (or nearest year) Source: Eurostat Statistics Database
- 30. Unmet medical care needs are reported, mainly among low-income groups Unmet need for a medical examination (for financial or other reasons), by income quintile, 2012 Note: 2011 data for Austria and Ireland. Source: Eurostat Statistics Database (based on EU-SILC)
- 31. Low-income people are twice more likely to report unmet needs for medical and dental care than the general population Change in unmet dental care need for financial reasons, average across EU countries, 2005 to 2012 Change in unmet medical care need for financial reasons, average across EU countries, 2005 to 2012 Source: Eurostat Statistics Database (based on EU-SILC)
- 32. Waiting times for cataract surgery have decreased in some countries, but the trend has reversed in other countries following the economic crisis Cataract surgery, waiting times from specialist assessment to treatment, 2006 to 2012 (or 2013) Source: Health at a Glance: Europe 2014, OECD
- 33. Waiting times for hip replacement have also decreased prior to the economic crisis, but have gone up in some countries since then Hip replacement, waiting times from specialist assessment to treatment, 2006 to 2012 (or 2013) Source: Health at a Glance: Europe 2014, OECD
- 34. 6. HEALTH EXPENDITURE • Expenditure • Financing
- 35. Health spending per capita varies widely across EU countries. It is highest in the Netherlands, Austria and Germany Health expenditure per capita, 2012 (or nearest year) 1. Current health expenditure. Source: Health at a Glance: Europe 2014, OECD
- 36. Several European countries hard hit by the economic crisis have cut their health spending since 2009 Annual average growth rate in per capita health expenditure, real terms, 2000 to 2012 (or nearest year) Source: Health at a Glance: Europe 2014, OECD
- 37. Many EU countries allocate more than 10% of their GDP to 37 health, while others allocate less than 6% Health expenditure as a share of GDP, 2012 (or nearest year) 1. Total expenditure only (no breakdown between current and capital spending available). Source: Health at a Glance: Europe 2014, OECD
- 38. The share of GDP allocated to health has stabilised or decreased since 2009 in many countries as health spending remained flat or fell Health expenditure as a share of GDP, 2000-12 Source: Health at a Glance: Europe 2014, OECD 1. Data refer to current expenditure (excluding capital spending).
- 39. Most health spending is publicly financed in nearly all EU countries. On average, almost three-quarter was publicly financed in 2012 Expenditure on health by type of financing, 2012 (or nearest year) 1. The Netherlands do not account for fixed deductable payable by patients (350 EUR per year) as out-of-pocket spending, resulting in an underestimation of the share of out-of-pocket payments. 2. Data refer to total health expenditure. 3. Public spending cannot be split. Source: Health at a Glance: Europe 2014, OECD
- 40. The share of out-of-pocket payments by patients has increased in some countries after the economic crisis; it has come down in others Change in out-of-pocket expenditure as share of total expenditure on health, 1. Data refer to current health expenditure. 2007 to 2012 (or nearest year) Source: Health at a Glance: Europe 2014, OECD