Learning Analytics for Educational Design and Student Predictions: Beyond the Hype with Real-Life Examples
•Als PPT, PDF herunterladen•
0 gefällt mir•554 views

Interaction in this session will increase your insight into the tricky business of managing data. Subsequently, two examples will illustrate how learning analytics is being used to shape didactic frameworks and educational design (University of Amsterdam) and how it is being used to provide adaptive learning opportunities for students (University of Michigan).

Empfohlen
Weitere ähnliche Inhalte
Was ist angesagt?
Was ist angesagt? (19)
Ähnlich wie Learning Analytics for Educational Design and Student Predictions: Beyond the Hype with Real-Life Examples
Ähnlich wie Learning Analytics for Educational Design and Student Predictions: Beyond the Hype with Real-Life Examples (20)
Mehr von Nynke Bos
Mehr von Nynke Bos (16)
Kürzlich hochgeladen
Kürzlich hochgeladen (20)
Learning Analytics for Educational Design and Student Predictions: Beyond the Hype with Real-Life Examples
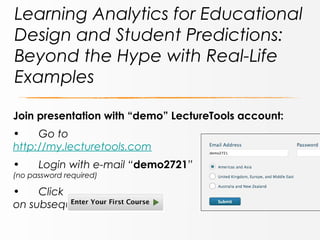
- 1. Learning Analytics for Educational Design and Student Predictions: Beyond the Hype with Real-Life Examples Join presentation with “demo” LectureTools account: • Go to http://my.lecturetools.com • Login with e-mail “demo2721” (no password required) • Click on subsequent page.
- 2. Nynke Kruiderink – University of Amsterdam Nynke Bos – University of Amsterdam Perry J. Samson – University of Michigan- Ann Arbor Learning Analytics for Educational Design and Student Predictions my.lecturetools.com :: user = demo2721 (no password needed)
- 3. Who we are Nynke Bos Head of ICT, Faculty of Humanities Nynke Kruiderink Teamleader Educational Technology of Social Sciences, Faculty of Social and Behavioral Sciences University of Amsterdam, The Netherlands 30,000 students 5000 employees annual budget 600 Million euro’s (810 Million dollars) 57 bachelor’s programmes 92 masters’s programmes my.lecturetools.com :: user = demo2721 (no password needed)
- 4. Lessons Learned Feb 2012-present my.lecturetools.com :: user = demo2721 (no password needed)
- 5. Proof of Concept Two tiered: Interviews with lecturers, professors, managers Gather and store data in central place for easy access my.lecturetools.com :: user = demo2721 (no password needed)
- 6. Lessons Learned 1. 2. 3. 4. Emotional response to ‘Big Brother' aspect of accessing data Data from LMS not detailed enough (folder based not file based) 50% of learning data available Piwki, not secure enough
- 7. Next steps Focus group Learning Analytics Professor Erik Duval – KU Leuven
- 8. What is the problem? Recorded lectures Recording of face-to-face lectures No policy at the University of Amsterdam Different deployment throughout the curriculum Not at all (fears/ emotional) Week after the lecture Week before the assessment And all the scenario’s in between
- 9. Student vs. Policy Students ‘demanded’ policy Quality assurance department wanted insight into academic achievement before doing so Development of didactic framework Research: Learning Analytics
- 10. Design Two courses on psychology Courses run simultaneously Intervention in one condition, but not in the other A thank you
- 11. Data collection Viewing of recorded lecture Lecture attendance per lecture Final grade on the course more segmented view Grades on previous courses Distance to the lecture hall Gender Age Hits in Blackboard Inventory Learning Style (ILS: Vermunt, 1996) Students were asked to fill out a consent form
- 12. Lessons Learned Let people know what you are doing Data preparation: fuzzy, messy Choose the data Simplify the data Keep an eye on the prize
- 13. LectureTools: Student View my.lecturetools.com :: e-mail = “demo2721” (no password)
- 14. LectureTools: Responder my.lecturetools.com :: e-mail = “demo2721” (no password)
- 15. LectureTools: Questions my.lecturetools.com :: e-mail = “demo2721” (no password)