Birch Bay Watershed Characterization
•
2 gefällt mir•640 views

This is the presentation given by Margaret Clancy, a consultant with ESA Adolfson, at the February 19 Nisqually River Council meeting.

Empfohlen
Empfohlen
Weitere ähnliche Inhalte
Was ist angesagt?
Was ist angesagt? (20)
Andere mochten auch
Andere mochten auch (12)
Ähnlich wie Birch Bay Watershed Characterization
Ähnlich wie Birch Bay Watershed Characterization (20)
Mehr von Nisqually River Council
Mehr von Nisqually River Council (20)
Kürzlich hochgeladen
Kürzlich hochgeladen (20)
Birch Bay Watershed Characterization
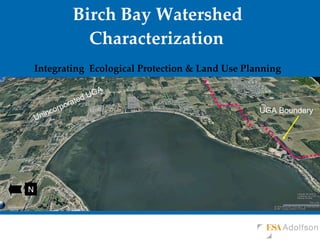
- 1. Birch Bay Watershed Characterization Integrating Ecological Protection & Land Use Planning N UGA Boundary Unincorporated UGA
- 2. Decision Making Tools NPDES ESA CWA HPA SMA CAO GMA SEPA
- 3. Unsuccessful Mitigation Source: National Research Council, 2001
- 4. Economic Development Ecological Protection Property Rights
- 5. Watershed Protection Strategies Time and Money Low High High Level of Ecological Protection Site-by-Site Protection REACTIVE Opportunistic Watershed-based Protection PROACTIVE Strategic
- 6. 1.7 Million More People by 2040
- 10. Identify Important Areas for Supporting Processes Infiltration & Recharge Storage Groundwater discharge Delivery of water Longshore drift Large woody debris Source: Puget Sound Partnership
- 11. And How Those Areas Have Been Altered Protection Restoration Development Restoration Source: Puget Sound Partnership
- 13. Benefits and Outputs Priority Areas for Development, Restoration, and Protection Density/zoning adjustments Expedited permit decisions Fine Scale Mid Scale Broad Scale Investment areas for acquisition Mitigation sending/receiving areas Development standards / design standards
- 14. Methods Water Quality Importance Alteration High Medium Low High Medium Low { { Protect Restore Develop = } } Hydrology Habitat Inputs Criteria Ranking Outputs
- 15. Important Areas for Hydrology Importance of a sub-basin for water flow = SW + GW + ET surface water (precip, delivery, storage ) + groundwater (recharge & discharge) + evapotranspiration
- 17. Identifying ‘Alterations’ Degree of alteration to water flow processes : - loss of wetlands + loss of floodplain storage - Impermeable surface + loss of forest cover + road density - loss of streams miles
- 18. Hydrology Analysis High Moderate Low High Moderate Low Important Areas Alterations
- 19. Low High High Low Alteration Importance Restore Develop Protect
- 21. Water Quality Analysis Important Areas for Pathogen Processes Relative to Potential Sources Potential Sources Reduces risk to shellfish resources Most important areas for protection & restoration
- 22. Wildlife Assessment Waterfowl areas Focal species: Great Blue Heron Focal species: Toad, Red-legged Frog
- 23. = Ecoregional Assessments Land Conversion Road Density Local Habitat Assessment Valleys = Poor Ranking Peaks = Favorable Ranking PHS/Heritage data (local empirical data)
- 24. Results of Fish & Wildlife Analysis High Low Habitat Value
- 25. Overall Results by Sub-basin
- 26. Future Build Out Step 4 – Evaluate Changes to Impervious Coverage Step 3 – Assess Future Development Patterns (Location & Density) Step 2 – Identify Buildable Areas per Whatcom County Regulations Step 1 – Assess Existing Development Patterns (Residential Location & Density)
- 29. Effects of Future Growth Impervious Surface Analysis
- 30. Vulnerability Increases in dwelling unit density and Impervious surface
- 31. Potential Conflicts High Increase in impervious surface Priority restoration area
- 33. Strategic Decisions Standard Approach Integrated Approach
Hinweis der Redaktion
- Getting out in front of the planning and permitting process
- Our analysis had 3 parts which allowed us to ultimately identify the priority areas for restoration, protection and development.
- Characterization uses available information to help planners make decisions about land use and resource protection at different scales of resolution: Broad scale Mid scale Fine scale Here are some examples of the types of data you need at each scale
- Different levels of analysis can inform different types of decisions. A planner is able to make different decisions depending on the scale of the analysis. Here are some examples of what each scale can yield in terms of information.
- precipitation, the timing of the delivery of that precipitation, and the relative amount of surface storage. The groundwater component is modeled by water volume (as precipitation), recharge, and discharge (see Table B-1). Evap is always the same assumed to be forested. Storage factor is weighted highest and considers depressional wetland presence and soils. For groundwater, permeability determines recharge. Discharge is a function of stream miles within unconfined floodplains
- We made a simple calculation to rank subbasins based on the amount of wetlands
- We then estimated the extent of degree of alteration in each sub basin looking at specific attributes such as loss of wetlands…
- We can then map the results to see where the important areas and altered areas occur
- These are a few of the background maps we used. The soil drainage map for instance indicates in orange and red locations likely to hold water for waterfowl. The map for the Focal species: Western Toad, Northern Red-legged Frog : is a cost-distance map that shows wetlands blue, and connected terrestrial areas in light to dark green. Red lines indicate roads expected to be barrier roads that disconnect habitat through high levels of road mortality. The third map, for the focal species Great Blue Heron shows the heronry, staging & feeding areas, alternative nest sites, and flyways.
- Next we assess how build out might affect the sub basins. This is one of the aspects of the pilot study that distinguished it from a typical critical areas inventory because now we are looking at the juxtaposition of important areas, past alterations and future build out to see what areas at most risk of development.
- One of the key metrics we used I impervious surface because we can correlate it to changes in DU density under different zoning scenarios. We can start to see where we might have conflicts between planned growth and resource protection or restoration.
- You can then begin to develop specific mgmt recommendations for each area