Men Vs. Women eCommerce Infographic
•
0 gefällt mir•576 views

Men Vs. Women eCommerce Infographic and Online Spending and Online Shopping

Empfohlen
Weitere ähnliche Inhalte
Mehr von Nextopia Software Corporation
Mehr von Nextopia Software Corporation (14)
Kürzlich hochgeladen
Kürzlich hochgeladen (20)
Men Vs. Women eCommerce Infographic
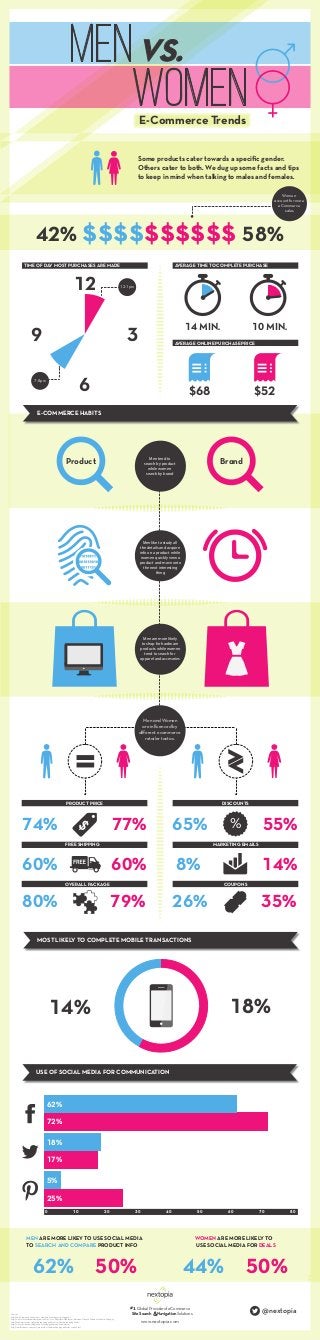
- 1. MENVS. WOMENE-Commerce Trends $$$$$$$$$$ 58%42% 12 6 39 Some products cater towards a specific gender. Others cater to both. We dug up some facts and tips to keep in mind when talking to males and females. Women account for more eCommerce sales 10 MIN.14 MIN. $68 $52 AVERAGE ONLINE PURCHASE PRICE AVERAGE TIME TO COMPLETE PURCHASETIME OF DAY MOST PURCHASES ARE MADE 12-1pm 7-8pm WOMEN ARE MORE LIKELY TO USE SOCIAL MEDIA FOR DEALS MEN ARE MORE LIKEY TO USE SOCIAL MEDIA TO SEARCH AND COMPARE PRODUCT INFO 62% 50% 44% 50% = 80% 79% 60% 60% 74% 77% PRODUCT PRICE FREE SHIPPING OVERALL PACKAGE 26% 35% 8% 14% 65% 55% DISCOUNTS MARKETING EMAILS COUPONS % >< 62% 72% 5% 25% 17% 18% 0 10 20 30 40 50 60 70 80 USE OF SOCIAL MEDIA FOR COMMUNICATION 14% 18% MOST LIKELY TO COMPLETE MOBILE TRANSACTIONS Product Brand E-COMMERCE HABITS Men and Women are influenced by different ecommerce retailer tactics. Men tend to search by product while women search by brand Men like to study all the details and acquire info on a product while women quickly view a product and move onto the next interesting thing Men are more likely to shop for hardware products while women tend to search for apparel and accesories MA+EB Sources: http://dailyinfographic.com/men-vs-women-online-shopping-infographic http://www.practicalecommerce.com/articles/3222-BehavioralDifferences-Between-Men-and-Women-Influence-Shopping http://ecommercerules.com/male-shopping-gabits-versus-female-shopping-habits/ http://www.pfsweb.com/blog/understanding-gender-and-ecommerce/ http://smallbiztrends.com/2013/08/male-vs-female-shopping-behavior-survey.html www.nextopia.com & #1 GlobalProviderofeCommerce SiteSearch NavigationSolutions @nextopia