Promoting College Rention of Low-Income and First-Generation Students (Part 2)
•
1 gefällt mir•513 views

The document analyzes data from the Boston-based Bottom Line college access and success programs that provide counseling to low-income and first generation students. It finds that students who participate in the Success counseling program, which provides intensive one-on-one support, are more likely to attain a college degree within 6 years compared to similar students who only participate in the Access program. Propensity score matching is used to estimate the effect of the Success program and finds it increases 6-year degree attainment by 28 percentage points and 4-year degree attainment by 18 percentage points.

Empfohlen
Empfohlen
Weitere ähnliche Inhalte
Ähnlich wie Promoting College Rention of Low-Income and First-Generation Students (Part 2)
Ähnlich wie Promoting College Rention of Low-Income and First-Generation Students (Part 2) (20)
Mehr von National Partnership for Educational Access
Mehr von National Partnership for Educational Access (20)
Kürzlich hochgeladen
Kürzlich hochgeladen (20)
Promoting College Rention of Low-Income and First-Generation Students (Part 2)
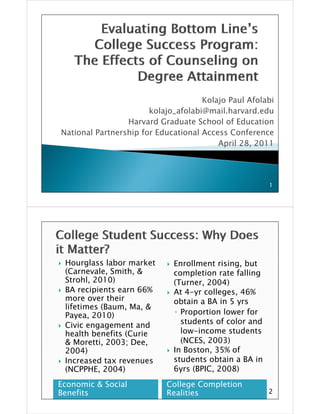
- 1. Kolajo Paul Afolabi kolajo_afolabi@mail.harvard.edu Harvard Graduate School of Education National Partnership for Educational Access Conference A il 28 2011 April 28, 1 Hourglass labor market Enrollment rising, but (Carnevale, Smith, & (Carnevale Smith completion rate falling Strohl, 2010) (Turner, 2004) BA recipients earn 66% At 4-yr colleges, 46% more over their obtain a BA in 5 yrs lifetimes (Baum, Ma, & Payea, 2010) ◦ Proportion lower for Civic Ci i engagement and t d students of color and health benefits (Curie low-income students & Moretti, 2003; Dee, (NCES, 2003) 2004) In Boston, 35% of Boston Increased tax revenues students obtain a BA in (NCPPHE, 2004) 6yrs (BPIC, 2008) Economic & Social College Completion Benefits Realities 2
- 2. Lots of research, few apples-to-apples research apples to apples comparisons ◦ Myers (2003); Turner (2004) Recent rigorous research has focused on 2yr and nontradtional students ◦ Scrivener & Weiss (2009); Richburg Hayes et al Richburg-Hayes al. (2009); Bettinger & Baker (2011) Integration to college and access to information and ◦ Tinto (1993); Cushman (2006) Information key for low income and first low-income generation students ◦ Kane & Avery (2004) ◦ Person, Rosenbaum, & Deil-Amen (2006) 3 Q1: Who participates in Bottom Line’s Access and Success programs? Q2: How do students describe their reasons for leaving college? Q3: When do Access-Only students leave college? Q4: What is the effect of the Success program on the probability on degree attainment? p y g 4
- 3. Boston-based college Counseling starts access and success summer before college program enrollment Access program serves p g DEAL framework: roughly 500 students Degree, Employment, at 38 high schools Aid, and Life Success Program Two one-on-one one on one serves 750 students at campus visits a month 18 target schools Also connect over phone, phone email Student Success Program Overview g O Counseling 5 All participants in N=2068 Bottom Line’s B Li ’ Participants have a P i i h programs 2002- GPA>2.5 and are 2008 either low-income or low income Data from program first generation databases, National All start at 4yr Student colleges ll Clearinghouse, IPEDS 3 cohorts with 6 yrs Notes from Success of data (n=606) (n 606) counselors on 5 cohorts with 4 yrs students of data (n=1355) Data Sample 6
- 4. Q1: Described who Bottom Line’s participants were and where they went to college d h h ll Q2: Explored how students describe leaving college by analyzing counselor logs from Bottom Line’s database for the Success participants who left college Q3: Looked at when Access-Only students left college by analyzing enrollment data for students who only participated i th A t d t h l ti i t d in the Access Program 7 Variable V i bl Access Students A St d t Success Students S St d t HS GPA (out of 4) 2.89 3.03 SAT (02 05, max 1600) (02-05, 892 852 SAT (06, max 2400) 1296 1293 Percent low-income 57% 77% Percent first gen 75% 87% Percent black 55% 52% Percent female 70% 74% Percent Hispanic/Latino 25% 28% P Percent i private college t in i t ll 72% 51% Percent in suburban college 46% 39% Percent in urban college 45% 61% 8
- 5. Twenty-six percent of students who participate only in the Access Program obtain a college degree within four years, and 45 percent obtain a degree within six years. years Of the students who leave college, only about half leave by the end of their first year. Enrollment data show that students are leaving college at all points in their post- secondary years. 9 Students described their reasons for leaving college as being related to: ◦ Issues external to their campus life ◦ A d i transition Academic ii ◦ Economic frustration ◦TTemporary administrative roadblocks. d i i t ti dbl k 10
- 6. Enrollment in Bottom Line’s Success program was only available to students who enrolled at l il bl t t d t h ll d t a “target” institution Students who participated in the Access program but did not attend a target institution make an arguably good control group Success program participants were matched to their Access-only counterparts using y p g nearest neighbor propensity score matching (with replacement) 1 1 Outcomes ◦ GRAD6YRi: obtained a degree within 6yrs of enrollment ◦ GRAD4YRi: obtained a degree within 4yrs of enrollment Treatment ◦ SUCCESSi: Participated in the Success program Matching Variables ◦ BACKGROUNDi ◦ ACADEMICi ◦ COLLEGEj 1 2
- 7. Propensity Score Estimation 1 Pr[ SUCCESSi =1] = ( − β0 +β1BACKGROUND +β2ACADEMICSi +β3COLLEGEj ) 1+e i ◦ For the ith student at the jth college Average Treatment Effect Ymatch = ∑ ⎡(Yi SUCCESS = 1) − (Y j SUCCESS = 0 ) ⎤ ˆ 1 nt ⎣ ⎦ ◦ Where Y is obtaining a degree, i indexes the treated cases, and j indexes the control cases , 1 3 Ana Maya Participated in Participated in Access Access -First-generation -First-generation -Latina -Latina -HS GPA = 2.9 -HS GPA = 3.1 Target Non target Non-target school = -Enrolls in 4-yr, -Enrolls in 4-yr, school = no Success mid-size, public, large, public, Success counseling g selective college selective college counseling g Propensity to be p y Propensity to be p y in Success = .75 in Success = .73 1 4
- 8. Success Access Difference 6yr grad rate 73% 45% 28% Unmatched 4yrgrad rate 45% 27% 18% 6yr grad rate 81% 39% 43% Matched M h d 4yrgrad rate 42% 23% 19% 6yr grad rate y g 82% 48% 34% Parametric Estimates 4yrgrad rate 57% 37% 20% 15 Limitations of propensity score matching ◦ PSM only produces unbiased estimates when l d bi d ti t h assignment to treatment conditional on the covariates is independent of the outcome (Dehejia & Wahba, 1999; Diaz & Handa, 2006 ) ◦ Self-selection into target schools Would negatively bias my estimates Generalizability ◦ Already self-selected group y g p ◦ Mixed evidence on effectiveness of counseling with other populations (Bettinger & Baker, 2011; Scrivener & Weiss, 2009) Weiss 16
- 9. Evidence continues to gather that information and counseling can be key in helping students to li b k i h l i d access and succeed in higher education ◦ Bettinger & Baker (2011) g ( ) ◦ Bettinger, Long, Oreopoulos, & Sanbanmatsu (2010) ◦S i Scrivener & Weiss (2009) W i ◦ Richburg-Hayes et al. (2009) Need to establish importance of well-identified well identified assignment mechanisms in demonstrating program effectiveness 17 Avery, C. & Kane, T. (2004). Student perceptions of college opportunities: The Boston COACH program. In Caroline Hoxby (Ed.), College choices: The economics of where to go, when to go, and how to pay for it (pp. 355-391). Chicago: The University of Chicago Press. h h f h Baum, S., Ma, J., Payea, K. (2010). Education pays 2010; The benefits of higher education for individuals and society. New York: The College Board. Bettinger, E Bettinger E. & Baker, R (2011) The effects of student coaching in college: Baker R. (2011). An evaluation of a randomized experiment in student mentoring. NBER Working Paper No. 16881. National Bureau of Economic Research. Bettinger, E. P., Long, B. T., Oreopoulos, P., & Sanbonmatsu, L. (2009). The role of simplification and information in college decisions: Results from the H&R Block FAFSA experiment. NBER Working Paper No. 15361. National Bureau of Economic Research. Boston Private Industry Council. (2008). Getting to the finish line: College enrollment and graduation; A seven year longitudinal study of the Boston Public Schools class of 2000. Boston, Massachusetts: Author. 18
- 10. Carnevale, A.P., Smith, N., & Strohl, J. (2010). Help wanted: Projections of jobs and education requirements though 2018. Washington, DC: Georgetown University Center on Education and the Workforce. Currie, J. & Moretti, E. (2003). Mother’s education and the intergenerational transmission of human capital: Evidence from college openings. Quarterly Journal of Economics, 118(4), 1495-1532. Cushman K. (2006). First in the family: Your college years Providence RI: Cushman, K (2006) years. Providence, Next Generation Press. Dee, T. S. (2004). Are there civic returns to education? Journal of Public Economics, 88(9-10), 1697-1720. (9 10), 1697 1720. Dehejia, R. H., & Wahba, S. (1999). Causal effects in nonexperimental studies: Reevaluating the evaluation of training programs. Journal of the American Statistical Association, 94(448), 1053–1062. Diaz, J. J., & S. Handa. (2006). An assessment of propensity score matching as a nonexperimental impact estimator: Evidence from Mexico's PROGRESA program. Journal of Human Resources, 41(2), 319-345 19 Meyers, R. D. (2003) College Success Programs. Washington, DC: Pathways M R D C ll S P W hi t DC P th to College Network. National Center for Education Statistics (NCES). (2004). College Persistence on the Rise? Changes in 5 Year Degree Completion and Postsecondary 5-Year Persistence Rates Between 1994 and 2000. Washington, DC: U.S. Department of Education. National Center for Public Policy and Higher Education (NCPPHE). (2004. Policy alert: The educational pipeline: Big investment, big returns. Washington, DC: Author. Person, A., Rosenbaum, J., & Deil-Amen, R. (2006). Student planning and information problems in different college structures Teachers College structures. Record, 108, 374–396. Richburg-Hayes, L., Brock, T., LeBlanc, A., Paxson, C., Rouse, C.E., & Barrow, L. (2009) Rewarding persistence: Effects of a performance-based scholarship ( ) gp p p program for low-income parents. New York, NY: MDRC. Scrivener, S., & Weiss, M. J. (2009). More Guidance, Better Results? New York: MDRC. 20
- 11. Tinto, V. (1993). Leaving college: Rethinking the causes and cures of student Ti t V (1993) L i ll R thi ki th d f t d t attrition (2nd ed.). Chicago; London: University of Chicago Press. Turner, S. E. (2004). Going to college and finishing college: Explaining different educational outcomes. In Caroline Hoxby (Ed.), College choices: The economics of where to go, when to go, and how to pay for it (pp. 13-56). Chicago: The University of Chicago Press. 21 Roughly 22% of students who attend target schools don’t participate in Success Doesn’t really effect 6yr estimate, but 4yr attenuates significantly Exclude –PSM Exclude - PM ITT - PSM 6yr 32% 41% 20% 4yr 5% 22% 0% 22
- 12. Bentley College Salem State College Boston College Smith College Boston University Suffolk University Bridgewater State College Tufts University Clark University (MA) U Mass-Amherst College of The Holy Cross U Mass-Boston Massachusetts College of Liberal Arts U Mass-Dartmouth Mass Dartmouth Northeastern Foundation Worcester Polytechnic Year Institute Northeastern University Worcester State College 23 Class Access Only Success Total 2002 118 90 208 2003 118 68 186 2004 145 67 212 2005 293 98 391 2006 215 143 358 2007 209 143 352 2008 190 171 361 Total 1288 780 2068 24