Data for chronic obstructive pulmonary disease (COPD) and asthma: making a real difference
•
1 gefällt mir•1,984 views

NHS improvement has produced a guide, based on the learning from our COPD and asthma service improvement projects, to help future sites get started and make progress in improving quality, understand their use of resources, and measure improvement. The guide covers acute and primary care, home oxygen services, and asthma care.

Empfohlen
Empfohlen
Weitere ähnliche Inhalte
Ähnlich wie Data for chronic obstructive pulmonary disease (COPD) and asthma: making a real difference
Ähnlich wie Data for chronic obstructive pulmonary disease (COPD) and asthma: making a real difference (20)
Mehr von NHS Improvement
Mehr von NHS Improvement (20)
Kürzlich hochgeladen
Kürzlich hochgeladen (20)
Data for chronic obstructive pulmonary disease (COPD) and asthma: making a real difference
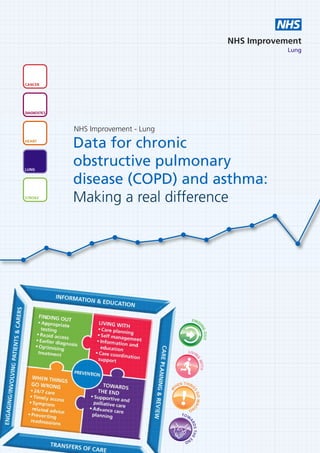
- 1. NHS NHS Improvement Lung CANCER DIAGNOSTICS NHS Improvement - Lung HEART Data for chronic LUNG obstructive pulmonary disease (COPD) and asthma: STROKE Making a real difference FIND I NG OUT LIVI N G W IT H N THIN HE G W SG ! O WRO NG TO W AR DS THE E ND
- 3. CONTENTS Data for chronic obstructive pulmonary disease (COPD) and asthma: Making a real difference FIND I How to use data to improve primary care 4 NG O UT How to use data to improve acute care 7 LIVIN How to use data to improve home oxygen 16 G WIT service assessment and reviews (HOS-AR) H How to use data to improve asthma care 20
- 4. 4 Data for chronic obstructive disease (COPD) and asthma: Making a real difference HOW TO USE DATA TO IMPROVE FIND I NHS Improvement has worked with primary • When do your annual reviews take place? COPD NG O UT care sites across England, to explore how is a very seasonal disease, and often we have supported self-care and regular review can noticed that reviews occur in response to the best be delivered in order to improve the QOF deadline, or increase during winter. It might LIVIN outcomes and quality of care offered to be possible to be more proactive, and consider G patients. This includes how to optimise reviewing patients during the summer months WIT medicines use and reduce waste. when patients are more likely to be well and H able to attend. Are we using all the data we are • Often we collect good data, but fail to act on it. collecting to improve patient care? For example, measures such as %FEV1 predicted Why access primary care data? or MRC dyspnoea score should help us target • We spend one billion pounds a year on appropriate treatment and risk stratify patients respiratory inhalers. Our project work has to ensure they are on the best treatment for identified that there is often prescribing outside their needs. Without this information it is of guidance – often patients on incorrect difficult to optimise treatment in line with the medication, too much or too little, and our national guidance or track changes that allow us project sites have improved compliance and to support patients appropriately reduced waste, reducing their spend on monthly • Recording of exacerbations is inaccurate – less prescribing costs. Can you identify patients who than a quarter of patients have their number of are on medication, but without a diagnosis? exacerbations recorded nationally • The 2010 NICE guidance for COPD recommends • By identifying more of your undiagnosed that medications are given in line with lung population you may increase QOF income capacity and patients with lower lung function • There are various tools to help practices identify are reviewed more frequently – does this occur which patients are at high risk of admission, or in your practice? who need more interventions, both at • Can you notice subtle changes to your patients’ population and individual level. These tools can condition? Ensure that you are capturing data help identify which patients you may want to on lung function, exacerbations, admissions and review or manage differently one such approach medicines use accurately and consistently. is the DOSE index (covering dyspnoea, airflow Reviewing this information can help optimise obstruction, smoking status and exacerbations). treatment and timely intervention • Can you identify patients with multiple long Our service improvement projects in primary care term conditions? Prevalence data from have all recognised the essential role data has in Birmingham suggests 32.8% of COPD patients monitoring how we are improving towards our have hypertension, and 26.5% have CHD. Could improvement targets, identifying patients with your practice be more efficient by managing increasing risk or incorrect medication, and for multiple conditions together, reducing monitoring compliance with guidance. Our sites duplication of tests and appointments? have used data to help achieve: • Reduced monthly spend on medication • Reduced rates of admission to hospital • Improved patient satisfaction and improved management of breathlessness.
- 5. Data for chronic obstructive disease (COPD) and asthma: Making a real difference 5 How? Use nationally available benchmarking data Sometimes, just a simple view of the nationally Query Primary Care systems directly available data may be good enough to start If you work in general practice, you are probably improvement work by highlighting where you already familiar with your practice database, may be an outlier, or raising questions about why however you may need some support to performance is where it is: understand the data you can access. • APHO Practice profiles for respiratory disease • Most practice databases include the functionality cover Prevalence, performance on to search your population, and return lists of QOF, and data on your local population and patients meeting selected criteria. patient satisfaction. • There may be a number of existing database www.apho.org.uk/PracProf queries. It is often straightforward to access a list • INHALE – This new national service provides a of your COPD population, often from QOF PCT level summary of national indicators across related queries. admissions, readmissions, total spend, and • The PCRS have produced an excellent summary across various outcome measures. of the commonly used Read Codes for COPD, www.inhale.nhs.uk which might be useful in constructing queries in • The project in Sheffield found many benefits your practice. Consistent use of Read Codes from simple practice benchmarking data for allows you to record, track and respond to admission rates, medication rates, and QOF changes in your patient’s condition, their health scores, using NHS Comparators. This site gives care use and outcomes of the care you everyone access to local admissions data in an provide. easy but comprehensive way. www.pcrs-uk.org/copd_nice/ www.nhscomparators.nhs.uk read_code_table.pdf Sheffield case study: • Training is available in querying your primary http://system.improvement.nhs.uk/Improvement care data from your system suppliers, and your System/ViewDocument.aspx?path=Lung%2f local PCT/CCG may have expertise in using data. National%2fwebsite%2fManaging_COPD_ • Organisations exist that specialise in getting the publication%2fSheffield_Target_support.pdf most value from your data. PRIMIS were • Medicines spend data by category, practice and established to deliver consultancy and training in cluster is available for practices to use from accessing primary care data, and provide support ePACT. Even simple summary data was enough in using your data. for our Victoria practice project to demonstrate www.primis.nottingham.ac.uk a reduction in medicines spend of over £1,000 per month. For more information, the case study can be downloaded at: http://system.improvement.nhs.uk/Improvement System/ViewDocument.aspx?path=Lung%2f National%2fwebsite%2fEarlier_diagnosis%2f Aldershot.pdf
- 6. 6 Data for chronic obstructive disease (COPD) and asthma: Making a real difference Consider pharmaceutical industry • Apollo SQL Suite (www.apollomedical.com) is a supported tools commercial tool that can provide a number of These tools can provide simple dashboards of your queries that help support you to achieve your current performance against guidance, suggest QOF measures, but also to review your COPD areas for improvement, and may bring nurse population health. In Hammersmith and support for implementing changes: Fulham, a whole PCT dashboard was created • GlaxoSmithKline POINTS tool – this powerful using data from Apollo and a data warehouse tool has been used already in around a third of created the information experts at their PCT. Full practices in England, and provides a useful details are in the lung improvement case study: dashboard overview, but also detailed files http://system.improvement.nhs.uk/Improvement showing the quality of care for your patients System/ViewDocument.aspx?path=Lung%2f based on compliance with national guidance National%2fwebsite%2fEarlier_diagnosis • Astra Zeneca and other pharmaceutical %2fData_warehouse.pdf companies can provide a wealth of useful • Optimal Patient Care worked with Leicestershire information on quality and cost indicators, in an PCT to extract data from all practices, and easily interpreted and usable form. identified wide variation in medicines use, and many indicators of quality care that could be fed Advanced tools for accessing data back to individual practices to support In our project work we have come across many improvement. advanced tools which allow for whole clusters or www.improvement.nhs.uk/lung/National PCTs to access data, analyse medicines use, and Projects/ManagingCOPD/Casestudiesin visually present data across their whole area. COPD.aspx Some examples include: • Eclipse Live – This new, innovative tool, is being Web links and more information developed by Prescribing Services Ltd by Dr For case studies and more information on Julian Brown, and piloted by the service accessing data - improvement project at the Isle of Wight, It www.improvement.nhs.uk/lung/Respiratory allows for detailed medicines management Resources/Guidetodataforlungimprovement questions to be answered with comparisons to projects.aspx both local and national medicines use levels, and for Read Coded primary care data to be analysed across a PCT or CCG level area. https://www.eclipsesolutions.org/EclipseInfo/ AboutUs/ • MSD Informatics offer solutions for accessing data across PCTs, and provide data extraction tools to support clinical audit and assessing clinical risk, with implementation in our Coventry improvement site.
- 7. Data for chronic obstructive disease (COPD) and asthma: Making a real difference 7 HOW TO USE DATA TO IMPROVE ACUTE CARE N THING HE Case for change Key facts S W ! GO The Right Care atlas of variation for Respiratory • Total number of COPD admissions has been WRO Disease shows us that there is unwarranted consistent at around 100,000 per year for five N G variation in COPD admission rates, even when years, at a total cost of £236.6m, but with an deprivation factors are considered, and that eight-fold variation in the rate of admissions outcomes in terms of length of stay, mortality, and from PCTs. overall spend vary across the country. • The number of bed days has reduced by 16% over the last five years. Our analysis has shown us that the average length • The number of 0-day admissions without an of stay was 6.6 days, yet there is a two-fold overnight stay has doubled from 5,000 to difference between the best and worst PCTs for 10,000 over five years. COPD length of stay. If the length of stay for • Only 50% of patients are managed by a above average Primary Care Trusts was reduced to respiratory clinician. be in line with the national mean, this would save the NHS approximately £14 million, and 65,000 Key learning bed days. Reducing the length of stay to the level • See where you are compared to others by of the PCTs in the top quartile increases the looking at National available data . INHALE – potential saving to £32 million and 146,000 bed This new national service provides a PCT level days. summary of national indicators across admissions, readmissions, total spend, and These are crude estimates, but we know that we across various outcome measures, and can help have already seen a 16% reduction in the number identify areas for improvement in your trust. of bed days, and a reduction in the mean length www.inhale.nhs.uk. Also, the Right Care NHS of stay by one day over five years, and that there atlas of variation in healthcare for people with is still more that can be done in improving respiratory disease provides a clear overview of services, such as improving access to seven day the difference in outcome, and how your area care, use of inpatient and discharge care bundles, compares to others. www.rightcare.nhs.uk and improving self-management to prevent • Understanding the patterns of demand and admission. Evidence from our project sites and capacity within your area can help you plan and from published evidence has shown that there is organise services effectively. Review variation in the potential to reduce admissions by 20% or demand by day and time of admission, day and more, in a short time scale. time of discharge and time of year, to help you understand what your service looks like and These savings often require a whole pathway identify what improvements could be made. approach, including community wide COPD • Sites have used demand and capacity effectively reviews, with investment and support for through matching the time when they aim to increased community based services. However, discharge patients to the peak times when even on our more focused acute projects, we have patients are admitted. This ensures specialist used data to identify and drive savings in length of beds are available in time for new patients to be stay and readmissions. admitted, which reduces ‘outliers’ – i.e. patients on incorrect wards.
- 8. 8 Data for chronic obstructive disease (COPD) and asthma: Making a real difference • Mean length of stay is used nationally as a • When presenting data, make sure it is presented statistic for comparing length of stay in acute in a format that your audience understands, and providers, however when describing the don’t try to include every data item you have: distribution of length of stay, mean is not always having too many measures can be very the most helpful statistic to use. Nationally, the confusing. distribution of length of stay shows us that we have many short stay patients, but the average is Understanding length of stay affected by the very sick patients in our hospitals Mean length of stay (LoS) is a nationally used and those whose discharge may be delayed measure used to compare trust performance while they wait for appropriate social care to nationally for a range of conditions, however it is be provided. a crude indicator and doesn’t help us to • Statistical Process Control (SPC) is a technique understand how the hospital beds are being used. which plots either averages, or individual results By breaking down LoS data to provide more detail over time, alongside control limits, that we gain a clearer understanding of the demonstrate when a process is controlled and admissions, and what the mean LoS reflects. predictable, and which results are outside these predicted limits. This helps you to identify and Figure 1 shows us the percentage of patients understand the variation in your system. staying for each length of stay. We can see that • Get to know your trust analysts, performance 10% of patients have ‘0 day’ LoS, 15% have a managers and coders, as these people will be one day LoS and so on. The graph is ‘trimmed’ at able to access and show you how best to use 20 days and the small number of patients who the data to answer your questions. stay longer than 20 days have not been included. • How your data is coded may vary in your local area, so often looking more broadly than ‘primary COPD’ in your questions can be helpful. Also, consider if your improvement work is Figure 1: Percentage of all admissions focused on a particular disease group, or on a 16 particular ward within the hospital, as you 14 may wish to look at patients in the respiratory ward beds, who do not have a respiratory % of all admissions 12 diagnosis. You will need to use a variety of data, 10 often using terms such as HRGs, and secondary diagnosis, to get a picture of patients who may 8 need to be under your care. 6 • Capturing your interventions along the patient pathway is important. Care bundles are a good 4 example of ensuring core components of care 2 are implemented and continually monitored for their effectiveness and impact Auditing their 0 use can provide useful process data. Respiratory 0 2 4 6 8 10 12 14 16 18 20 care bundles have commonly been used for Duration of stay COPD, asthma and pneumonia.
- 9. Data for chronic obstructive disease (COPD) and asthma: Making a real difference 9 Figure 2 shows us the cumulative proportion of admissions with a length of stay of equal or less Figure 2: Percentage of all admissions than that number of days. We can see from the this duration or less chart that 50% of patients have a LoS of 3 days or less and 80% of patients have a LoS of 8 days or 100 less. Only 6% of patients stay for more than 20 90 days. 80 % of all admissions 70 Figure 3 shows us the proportion of bed days 60 accounted for by these patients. Remember that 50% of patients have a LoS of three days or less: 50 we can see that these patients account for about 40 12% of hospital bed days. The 80% of patients 30 who have a LoS of eight days or less account for 20 40% of hospital bed days for COPD. Remember 10 that 6% of patients who stayed for more than 20 days? They must account for the remaining 28% 0 of hospital bed days. 0 2 4 6 8 10 12 14 16 18 20 Duration of stay Many differences can be observed in the shape of the data across your trust, when compared to the national averages. Figure 3: Percentage of bed days • Many short, zero day length of stay, could accounted for by patients with this indicate that you are either having too many LOS or less unnecessary admissions, or discharge patients more quickly than most. Nationally, around 10% 80 of admissions are sent home in less than one day. 70 • A high proportion of long staying patients can % of all admissions have a big impact on your mean length of stay, 60 and could indicate issues around discharge 50 processes or transfer to social care. This will be shown as a ‘long tail’ in your data. By splitting 40 your data into proportions for example those 30 patients who stay longer than seven days and analysing these separately can help you identify 20 where your service improvement work will have 10 the biggest impact. • The majority of bed days are taken up by longer 0 staying patients. This may seem like common 0 2 4 6 8 10 12 14 16 18 20 sense, however often the focus of improvement Duration of stay work is on short stay patients. Figure 3 shows us that over 50% of bed days are for the patients Source: HES, Primary diagnosis COPD, Finished staying at least 11 days, therefore initiatives admissions, 2010/11. focussed on short-stay patients may have limited impact on total bed days or length of stay for COPD.
- 10. 10 Data for chronic obstructive disease (COPD) and asthma: Making a real difference • Improvement may be shown by the peak of the curve shifting to the left, indicating a reduction Some key terminology for hospital in the length of stay for the majority of your admissions data patients. • PAS – Patient Admission System – this is the generic name given to systems in Questions to ask when reviewing hospitals that capture hospital data. variation in length of stay • HES – Hospital Episodes Statistics is the • Look at the LoS by the day of admission. You national activity statistics that are may notice peaks in LoS on certain days. collected and presented, based on data • What is different about these days? from A&E, inpatient and outpatient care. • Do you have daily ward rounds? • HRG – Healthcare Resource Group, this is • What is your clinical decision making a standard group of clinically similar process like? treatments used as a common grouping • Do you have nurse led discharge? of hospital care, and are used to set the • Do you have seven day working? standard price of care in Payment by • Compare the number of admissions by the time Results and the Tariff. The main of day. When do your peak admission and COPD HRG range over severity of COPD, discharge times occur? with or without NIV, and with or without • Are patients waiting on other wards for a complications. specialist bed? • Diagnosis, recorded by ICD-10 code, is • Do your patients have to wait for tablets? the latest version of the International • Do you have a discharge lounge that you Statistical Classification of Diseases and could use / do you use your discharge lounge Health Related Problems, a as much as you could? comprehensive classification of all • Does length of stay vary over the year, diagnoses. Each admission will have particularly during the winter period? Ask why, several diagnoses coded to it when the and identify what your teams do differently patient is discharged from hospital. during these times. • OPCS Classifications of Interventions and • How long do patients stay in A&E and medical Procedures (OPCS-4) are used to define assessment / decision wards? and categorise procedures in hospital, • Does your trust aim to admit all COPD patients such as non-invasive ventilation direct to a specialist ward? • The British Thoracic Society has produced • For patients requiring longer term recovery, are an excellent guide to data coding, which different types of beds often used? e.g. is available online at: community hospitals, which can take patients www.brit-thoracic.org.uk/Portals/0/ elsewhere. Delivery%20of%20RespCare/Respiratory • Are COPD patients frequently admitted to wards CodingUpdateJUN2011.pdf other than respiratory wards? What are the reasons for this? • What process do you have in place to ensure that appropriate patients are seen by a respiratory specialist?
- 11. Data for chronic obstructive disease (COPD) and asthma: Making a real difference 11 Using Statistical Process Control (SPC) In simple terms, improvement efforts would first within acute care seek to remove special cause variation in order to We all know that measurement is integral to create a stable and ‘in control’ process. This would improvement methodology in healthcare but how be followed by efforts to reduce the spread (or do we know whether or not we have actually width) of the common cause variation. Processes made a difference and if the care being delivered that are in control provide natural process limits is getting better, staying the same or getting that can be compared to specifications, outcomes worse each year? What we do not always take or standards with corrective action being taken as into account is the variation in the way that required. Comparisons between specification services are delivered – by individual departments, limits and process performance enables the people and even different types of equipment. All calculation of system capability i.e. the ability of of these differences in the way things are done the process to meet customer and business lead to differences in the way services are requirements. Information of this type is delivered. fundamental in guiding process improvement strategies. The main aim of using statistical process control (SPC) is to understand what is ‘different’ and what is the ‘norm’ within a process. By using SPC, we can then understand where the focus of work needs to be concentrated in order to make a SPC charts are therefore used: difference through service transformation work. We can also use SPC charts to determine if an • As a simple tool for analysing data – improvement project is actually improving a measurement for improvement. process and also use them to ‘predict’ statistically • As a tool to help make better decisions. whether a process is ‘capable’ of meeting a set • As a tool for the ongoing monitoring target. and control of a process. • To distinguish special cause from The inherent strength of these charts is that they common causes of variation as a guide provide a visual representation of the performance to management action. of a process by establishing data comparisons • To focuses attention on detecting and against calculated limits (known as the ‘upper and monitoring process variation over time. ‘lower’ control limits). These limits, which are a • To help improve a process to perform function of the data, give an indication via signals consistently and predictably over time. or chart interpretation rules as to whether the • To provide a common language for process exhibits either ‘common cause’ or ‘special discussing process performance. cause’ variation. The charts also visually demonstrate the inherent width or spread of the variation being generated within any given process.
- 12. 12 Data for chronic obstructive disease (COPD) and asthma: Making a real difference Natural (common cause) variation • Is inherent in the design of the process. Figure 4: Example of an uncontrolled process • Results in a stable – IN CONTROL – process with two points above the upper control limit because the variation is predictable. • Is due to random or chance causes of variation. Special cause variation • Is due to irregular or unnatural causes that are not inherent in a process - extrinsic. • Results in an unstable – OUT OF CONTROL – process because variation is not predictable. • Is due to non-random or assignable causes of variation (i.e. a signal that the process has ‘changed’). • Process improvement work will inadvertently introduce special cause variation for these Figure 5: Example of a controlled process reasons. • For a more comprehensive overview and further resources, please refer to the NHS improvement website. • www.improvement.nhs.uk/lung/Service ImprovementTools/StatisticalProcessControl/ tabid/96/Default.aspx Within acute respiratory wards, there can be a broad variation in the severity of the disease in patients who are admitted for COPD, so there is often large variation in length of stay. • Your trust may require you to split the data into the different parts of your pathway, from • Sometimes reviewing all admissions for all medical assessment wards, to respiratory conditions within a single ward is useful, and specialist wards, or rehabilitation wards – there’s can show change which may not be observed rarely a one-size-fits all approach, so you may within the data that looks at a diagnosis across need to consider individual steps within your the whole hospital. pathway. • Consider looking at both patients with a primary diagnosis of COPD, and all respiratory diagnoses.
- 13. Data for chronic obstructive disease (COPD) and asthma: Making a real difference 13 • Sometimes, different types of SPC chart are The chart below shows the results of our work more appropriate. For example, when with the Eastbrook Ward in Worthing – they comparing monthly sampled data with high decreased their average length of stay by one day variation, such as length of stay for COPD, an through a number of small improvements to care X-Bar S chart (see page 14) may be appropriate, and bed management. They also increased control so that you review both the variation in the over the variation, resulting in a more predictable process each month, to the change to the mean. mean length of stay. This allowed for more You may need support from an analyst or respiratory patients to stay on the ward in the statistician to ensure you are using the correct following year, increasing the number of COPD technique for your data. patients able to be seen by a specialist. • For simpler processes such as time to receiving non-invasive ventilation (NIV), or time on an acute medical assessment ward, you can plot individual results on an SPC chart. Figure 6: SPC chart showing reduced variation in length of stay in an acute trust
- 14. 14 Data for chronic obstructive disease (COPD) and asthma: Making a real difference The chart below shows an example of the XBar-S chart. This ward appears to have a fairly well controlled mean length of stay, however the excessive variation in the sample standard deviation, shown as the uncontrolled process in the second chart, indicated that there is an inherent variability in the process we are measuring, and suggests that it may be an uncontrolled process. Figure 7: X bar - S chart of length of spell nights - Sort by discharge
- 15. Data for chronic obstructive disease (COPD) and asthma: Making a real difference 15 The example below shows the number of days taken for patients to arrive at the respiratory ward from their arrival at hospital. Typically, patients arrived quickly, however some patients were admitted to other wards. You would want to review these outliers. Figure 8: Days from admission to respiratory ward (patients who attended ward) Patient number (by admission rate)
- 16. 16 Data for chronic obstructive disease (COPD) and asthma: Making a real difference HOW TO USE DATA TO IMPROVE LIVIN Home oxygen is an area of the NHS that has a G WIT wealth of data available, including invoice data, Project learning - Derby HOS-AR team H supplier concordance reports, and local caseload The team had developed a training data. Data is provided as large spread sheets, is programme for GPs, based on long term available regularly, and is provided to the concerns over inappropriate prescribing and commissioners. had been delivering this for over a year. However, often Home Oxygen Service Assessment The data on who commenced oxygen told and Reviews (HOS-AR) services lack useful us that the proportion of GP information to help them inform their service commencements had decreased, and delivery. The huge spread sheets can be difficult accounted for under 10% of the initiated for a non-expert to use and interpret. There is so home oxygen, indicating that the scheme much data that it is difficult to identify an area to had been successful. focus on. There are no key metrics to drive improvement work. And often data doesn’t However, the data identified that 30-40% always get to the HOS-AR teams. of patients were having oxygen initiated by hospital clinicians. Although the team had this data, they had not observed that the initial problem had been successfully Key learning from our service resolved and that the opportunity for further improvement projects improvement of the service now lay in • HOS-AR has the potential to save money addressing hospital prescribing. alongside improving quality. • Use concordance data, but not in isolation. We found that looking at the The importance of data for HOS-AR waste through using the concordance • There’s huge importance in using data to drive data was an excellent start, but improvement. While sites often thought that combining this alongside looking at they understood their services well, the data quality of prescribing enabled us to often identified hidden issues, and enabled the identify many areas for improvement. sites to provide evidence of improvement to • Who prescribes oxygen is a good themselves and their commissioners process measure. In some areas with low • Choose a few, focused metrics to drive spend and well managed oxygen use, improvement. we found that over 90% of • Be pragmatic – it’s not easy to get perfect data, commencements had been initiated by a and often simple data is more useful specialist from their HOS-AR team. • Present the data in a simple way that makes the • Review how many patients are supplied progress and goals clear. We found a dashboard oxygen outside of guidance, where it was a helpful tool. may not be clinically appropriate. • Data is an essential part of HOS-AR – without it, • Review how HOS AR teams use their we do not know our patients time – often surprising results were discovered in inefficient administrative processes, and time managing oxygen supplier relations.
- 17. Data for chronic obstructive disease (COPD) and asthma: Making a real difference 17 Figure 9: HOS-AR dashboard Example service improvement measures • Who completes the HOOF? • How many patients have potentially clinically inappropriate supply, for example? • Over four hours of SBOT • Under eight hours of LTOT • Over or underuse of prescribed oxygen • How much is spent on oxygen supply per month? • How many patients receive oxygen each month? • What is the service activity – e.g. How many commencements and removals?
- 18. 18 Data for chronic obstructive disease (COPD) and asthma: Making a real difference Showing spread of good practice The respiratory atlas of variation provides maps of comparative oxygen spend across England. Figure 10: NHS Atlas of Variation Map Source: www.rightcare.nhs.uk/index.php/atlas/respiratorydisease
- 19. Data for chronic obstructive disease (COPD) and asthma: Making a real difference 19 We have mapped the spread of services across each SHA. Figure 11: HOS-AR Coverage: West Midlands Metrics for commissioners • The percentage of people on long-term oxygen The service specification in the Home Oxygen therapy who have had a review in the last 9 Assessment and Review Commissioning Toolkit months suggests these metrics for commissioners. • another value-added measure – team can • The percentage of eligible people booked for ensure therapy still effective and matches their HOS assessment who attend their patient’s potential changed condition appointment • The number of inappropriate oxygen • puts onus on team to spread the gospel with prescriptions identified on assessment local clinicians and patients • will change over team lifecycle, initially high • The percentage of people prescribed oxygen but should reduce as HOS-AR established therapy who have a follow up home visit within locally. four weeks • measure of the value-added by the HOS-AR team who can do environmental risk assessment
- 20. 20 Data for chronic obstructive disease (COPD) and asthma: Making a real difference HOW TO USE DATA TO IMPROVE FIND I Asthma is a respiratory condition that affects We found that having a systematic approach to NG O UT approximately three million people in the UK. reviewing your data was an essential part of the Recorded prevalence is around 5.9% but improvement process. Our projects reviewed the estimates suggest the true figure could be nearer data available in their areas to identify LIVIN 10%, one of the highest in the world. The cost improvement priorities, create clear baselines and G to the NHS is put at around £1 billion with the targets for improvement, and through continued WIT majority of the spending on respiratory measurement over a period of 12 months, H medications and about £61 million on achieved reductions in A&E attendance, reduced emergency admissions. readmissions, and improved quality of care. N THING HE There is a 3.2-fold variation in the rate of A systematic approach to reviewing S W ! GO emergency admissions to hospital across England. asthma data WRO N Some of this can be explained by differences in • Benchmark your service with others locally and G the local population, but much is due to nationally. T differences in the quality of asthma care. • Identify priorities for change, and collect relevant baseline data. “An emergency hospital attendance • Continuously monitor progress to evaluate the intervention – this will help you to know if you or admission represents a serious are making progress towards your goal. loss of control of a person’s • Consider auditing patients case notes to gain understanding of the target cohort – data may asthma. Admissions are sometimes indicate where your issues are, but a more necessary… but it has been detailed investigation can reveal the root estimated that three-quarters of cause issues • Share data between clinical and admissions are preventable.” managerial teams. NHS Atlas of Variation for people with respiratory disease. Examples from project sites NHS Improvement worked in partnership with a number of sites over a 12 month period to improve the Asthma pathway and reduce variation in standards of care. The projects focused on four key areas of work: 1. Diagnosis and medicines optimisation 2. Chronic disease management 3. Transforming acute care 4. Integrated pathways.
- 21. Data for chronic obstructive disease (COPD) and asthma: Making a real difference 21 Validate your patient registers Find the root cause The ESyDoc project found that ‘clean’ registers Early in 2010, the respiratory nursing team at (e.g. diagnosed patients with correct read coding) Guy’s and St Thomas’ NHS Foundation Trust are essential, in order to be able to run searches to undertook a snapshot audit of asthma identify cohorts of patients, for example in order attendances to A&E, and this revealed a to stratify into degrees of risk, call the correct surprisingly high 30 day re-attendance rate of just patient for their annual review and to analyse below 30% and this highlighted a problem which data for QOF purposes. they wanted to improve upon. There are tools available to help you understand Areas for improvement were identified by the your data. These are available from team through in depth diagnostic work to reveal pharmaceutical companies or from local data the causes of re-attendance through: analysts. ESyDoc looked at the number of patients • examination of A&E data to establish the on asthma medication without an asthma target cohort diagnosis, patients using large volumes of • an audit of A&E casualty cards medication indicating poor asthma control, and • telephone interview with reattenders to patients with frequent admissions or understand behaviours and motivators. exacerbations, to risk stratify their patients for targeted reviews. Both qualitative and quantitative data was key to understanding the problem and informing solutions.
- 22. 22 Data for chronic obstructive disease (COPD) and asthma: Making a real difference Present data well The analyst helped the team to mine the data on Sandwell has the third highest admission rate local admissions, to support targeting GPs for within the UK and a high prevalence rate of awareness and referral support, and produced a asthma of 7.5% with approximately 21,233 dashboard to help the team manage referrals and people having been diagnosed. Despite this low core measures, which helped the team keep track numbers of referrals for asthma were being of progress. received to the Community Respiratory Service from GPs and secondary care. The team decided the time was right to heighten their profile for asthma and emulate the good work they already did in other respiratory diseases. Figure 12: Respiratory dashboard
- 23. Data for chronic obstructive disease (COPD) and asthma: Making a real difference 23 Measures and information for primary Commercial tools are available that allow you to and secondary care query primary care databases to answer questions, The first step in reviewing your service is to and some pharmaceutical companies support benchmark. See where you are compared to practices in using these tools. Also, most general others by looking at data available nationally. practice systems include reporting functionality • INHALE – This new national service provides a that will allow you to create your own reports on PCT level summary of national indicators across these measures. admissions, readmissions, total spend, and across various outcome measures, and can help Data on hospital activity is easily accessible for identify areas for improvement in your trust. primary care, particularly for numbers and rates of www.inhale.nhs.uk admission and A&E attendance. These activity • The Right Care NHS atlas of variation in measures are available to commissioners, or can healthcare for people with respiratory disease be accessed directly from publicly accessible provides a clear overview of the difference in websites such as NHS comparators, to give a outcome, and how your area compares to picture of the variation in activity in practices others. www.rightcare.nhs.uk within your area. This enabled our projects to • Analyse local data and understand the variation focus attention on practices with the greatest – within your trust or CCG there may be rates of secondary care activity, but also the variation in performance metrics and outcomes greatest number of patients, so to maximise the at each practice, and looking at local data, such impact of their improvement work. as that in the APHO practice profiles, can be a good start to view variation. Measure change in secondary care www.apho.org.uk/pracprof In order to understand the reasons behind a patient’s admission or attendance, often it is Monitoring change in primary care valuable to audit a sample of patient records. Guidelines for Asthma care, such as the 2011 BTS While quantitative data can be useful to / SIGN guidance (British Thoracic Society & understand activity, the qualitative data provided Scottish Intercollegiate Guidelines Network), can by an audit of a sample of records can also be be monitored in primary care by looking in detail useful. at your patient records. Our project sites implemented measures to identify and improve National audits, such as those run by the British quality of care: Thoracic Society, can provide a comprehensive review of your adherence to national standards, • Proportion of patients diagnosed using and provide benchmarking data to show how spirometry your hospital compares to your peers. • Proportion of patients with a self-management plan • Proportion of patients with good inhaler technique • Number of patients on practice caseload receiving asthma medication without asthma diagnosis • Proportion of patients receiving asthma education.
- 24. 24 Data for chronic obstructive disease (COPD) and asthma: Making a real difference Care bundles can be a useful tool to ensure that • Use Statistical Process Control (SPC) charts. SPC the basics of good care are delivered every time. is a technique which plots either averages or A care bundle is a simple check list that individual results over time, alongside control accompanies the patient notes and can easily be limits, that demonstrate when a process is collected and monitored to ensure good care is controlled and predictable, and which results are delivered. For asthma, this could include timely outside these predicted limits. This helps you to assessment, checking inhaler technique, delivery identify and understand the variation in your of patient education, and follow-up with patients system, and instantly identify unusual cases. and GPs. The measures included are similar to • Use demand and capacity. Sites have used those in national audits, however the continuous demand and capacity effectively to look at how measurement approach helps you to monitor and their peaks of demand vary from their supply of maintain the quality of care. capacity. This is useful in acute settings, through matching the time when they aim to discharge Comprehensive data on admissions to hospital is patients to the peak times when patients are collected in your hospital’s PAS (Patient Admission admitted, or in primary care, where you can System) and you can access the information review how community team time is used. through performance analysts and managers • Our primary care data guide for COPD provides within your trust. You may wish to look at the useful links to how to investigate your primary length of stay, readmission rates, different wards care systems, suggests helpful data and coding attended, time to reach specialist wards, and tools, and shows the benefits of accurate data. proportion of patients able to access a respiratory • The how to use data for COPD in secondary care specialist. provides a useful of the variation in acute COPD care and introduces how to use SPC, and Top tips for improvement with data understand your acute pathway data. • Start simple, and use readily available national data sources. The data provided by INHALE, the Right Care NHS atlas of variation in healthcare, and through practice profiles, is a great way to build a picture of the care in your area, and often simple data is good enough to start improvement work. • Get to know your trust analysts, performance managers and coders, as these people will be able to access and show you how best to use the data to answer your questions. • When presenting data, make sure it is presented in a format that your audience understands, and don’t try to include every data item you have: having too many measures can be very confusing.
- 25. Data for chronic obstructive disease (COPD) and asthma: Making a real difference 25 Hospital site Data collected Aim Outcomes Guys and St Thomas Snapshot audit of asthma To reduce asthma Reattendances at A&E fell by 45%. NHS Foundation Trust attendances to A&E reattendances at A&E within 28 days by 20%. Mid Yorkshire Tracked readmissions within Reduce readmissions within Introduction of care bundle Hospital NHS Trust one month and conducted a 28 days by 20%. 60% reduction in readmissions notes review Improved patient coding of data. University Hospitals A College of Emergency Improve standards of care Asthma care pathway. North Staffordshire Medicine CEM 2009/10 for patients presenting to Asthma data base of all patients NHS Trust asthma audit. emergency department attending A&E. Data on attendees and with an acute exacerbation. Training programme. reattenders and admissions. Patient focus groups Audit of casualty cards Sandwell Local data on admissions, Increase number of asthma Reduction in admissions by 21%. process mapping of referrals – referrals into the service by Reduction in A&E attendances all presented into a 50%. by 29%. dashboard. 80% of patients on asthma Increased referrals to nurse specialists Review of case notes. registers were managed in by 75%. accordance with the Increase in self-management plans BTS/SIGN guidelines. 21%. Increase in asthma education by 16% Increase review of inhaler technique by 8.2% Durham Dales Identified patients who Educate pharmacists, 174 Medicine use reviews completed missed annual review, or were improve practice and • 60 patients were recorded as over-using reliever inhalers. pharmacist relations, non-compliant and pharmacist improve patient outcomes interventions were delivered. and ensure quality • Patient education to 32% of patients. prescribing. • Device check and advice - 32% of patients. • 14% of patients were referred back to GP. ESyDoc Practice registers were Increase the recorded 154 new patients were diagnosed searched to identify patients prevalence of Asthma, with asthma. who had received asthma Introduce risk stratification, 454 patients had a self-management medication without any Optimise medicines use plan. respiratory diagnosis, or with 58 patients referred for smoking a need for a review from an cessation. asthma specialist nurse. Improvement in adherence to national guidelines.
- 26. 26 Data for chronic obstructive disease (COPD) and asthma: Making a real difference
- 28. NHS NHS Improvement CANCER DIAGNOSTICS HEART LUNG STROKE NHS Improvement NHS Improvement’s strength and expertise lies in practical service improvement. It has over a decade of experience in clinical patient pathway redesign in cancer, diagnostics, heart, lung and stroke and demonstrates some of the most leading edge improvement work in England which supports improved patient experience and outcomes. Working closely with the Department of Health, trusts, clinical networks, other health sector partners, professional bodies and charities, over the past year it has tested, implemented, sustained and spread quantifiable improvements with over 250 sites across the country as well as providing an improvement tool to over 2,000 GP practices. NHS Improvement 3rd Floor | St John’s House | East Street | Leicester | LE1 6NB Telephone: 0116 222 5184 | Fax: 0116 222 5101 www.improvement.nhs.uk Publication Ref: NHSIMP/Lung0005 - November 2012 ©NHS Improvement 2012 | All Rights Reserved Delivering tomorrow’s improvement agenda for the NHS