SlideShare ist ein Scribd-Unternehmen logo
1 von 9
Downloaden Sie, um offline zu lesen
COMMERCIAL REAL ESTATE
OUTLOOK
NOVEMBER 2010
By George Ratiu, NAR Economist
The third quarter economic activity
maintained the moderate positive
momentum it has been building over the
past year. Consumer spending continued to
surprise with its resiliency in the face of
stubbornly high unemployment. But
questions about the direction of the
economy remain, as evidenced by the
Federal Reserve’s second round of
quantitative easing measures (QE2) as well
as the condition of commercial real estate.
Economic Activity
Based on the Bureau of Economic
Analysis’s second estimate, gross domestic
product (GDP) rose 2.5 percent in the third
quarter. Mirroring the second quarter’s
patterns, all major components—except net
exports—advanced. The gains were driven
by double-digit growth in business
investments, along with sustained
expenditures by consumers and
government. Business spending increased
12.4 percent during the quarter. While
taking a slower pace compared with the first
half of the year, businesses continued to
spend on equipment—software and
transportation were up 15.2 percent and
64.0 percent, respectively. Contrary to
BEA’s first estimate, after eight consecutive
quarters of declines, business spending on
commercial real estate declined 5.8 percent.
The major economic driver, consumer
spending stayed the course, gaining 2.8
percent during the third quarter.
Consumers increased their spending on
both goods and services, particularly for
recreation and recreational goods, home
furnishings, transportation and health care.
International trade expanded during the
quarter, as well. The balance of trade
remained negative, however, as imports
grew by 16.8 percent and exports by 6.3
percent. The other major component of
GDP—government spending—advanced
4.0 percent, mostly at the federal level.
(continued on page 2)
Commercial real estate markets are
flattening out, with modestly improving
fundamentals expected in 2011. Rents are
expected to continue to decline, as
vacancies remain elevated. Multifamily
performance has proven resilient and is
expected to lead into 2011.
Economic Activity Maintains Momentum in Third Quarter
Market Fundamentals
2010.Q3>2010.Q4
OFFICE
Vacancy
Net Absorption
Completions
Rent Growth
INDUSTRIAL
Vacancy
Net Absorption
Completions
Rent Growth
RETAIL
Vacancy
Net Absorption
Completions
Rent Growth
MULTIFAMILY
Vacancy
Net Absorption
Completions
Rent Growth
NATIONAL
ASSOCIATION of
REALTORS®
RESEARCH
GDP (% Chg - Annual Rate)
Source: BLS
COMMERCIAL REAL ESTATE
OUTLOOK
2
(continued from page 1)
Employment
After a strong first half of 2010, employment trends took a
dive during the third quarter. Businesses, while still
spending, are doing so more targeted and not on jobs.
While corporate profits are back up to their peak before
the recession, companies are just sitting on cash and not
actively pursuing expansion plans. The number of payroll
jobs declined by 53,000 for the period. The decline was
somewhat offset in October, when the economy added
151,000 jobs. But, employment conditions remain mired
in uncertainty. The first-time unemployment insurance
claims have been stuck at around 450,000 per week. The
figure needs to fall below 400,000 per week to ensure a
meaningful, consistent job creation. In addition, the
number of people drawing unemployment benefits stayed
above 4.5 million. Not surprisingly, the unemployment
rate has been fixed at 9.6 percent for three months.
Given the tepid pace of recovery and the employment
picture, consumers remained uncertain. In addition, the
midterm elections provided an added measure of volatility
to consumers’ mood. The two main measures of
consumer confidence and sentiment mirrored these
trends. The consumer confidence index compiled by the
Conference Board—a measure that considers
respondents’ general feelings about the job market and
their finances—declined from a high of 62.7 in May to
48.6 in September, the second lowest value for the year.
More troubling, consumers’ expectations are also on the
decline, after a burst of optimism during the first half.
Meanwhile, the University of Michigan survey of
consumer sentiment also declined during the third
quarter, to close at 68.2 in September. It has risen
slightly to 69.3 during November, but remains well below
the 100 value typical of economic expansions.
Commercial Lending
Commercial sales transactions are slowly rising.
However, the commercial markets are starting to
experience a bifurcation along property values. While
investment capital appears ready to deal at the high-end
of the market, the smaller size investments and
businesses are still finding little room to maneuver.
With fundamentals on an upward trend, larger properties
in stronger markets are attracting investor interest. At the
same time, smaller properties in slower markets continue
to display signs of distress.
Commercial Realtors cite lack of financing as the main
obstacle to a broad market recovery. Commercial loan
originations are down 83 percent from peak, lending
standards remain stringent and, faced with other
investment alternatives, banks remain wary of
commercial transactions. The QE2 attempt to keep long-
term rates lower, which may or may not be working, is
inconsequential to the market compared to the
importance of returning lending standards to normal from
their overly stringent current rules. For the time being,
buyers with cash are facing few, if any, competitors in
bidding for a building.
Outlook
The third quarter survey mirrors a weak-yet-hopeful
commercial real estate market. While the economy
grows, high unemployment continues to figure
prominently in the minds of both consumers and
businesses, driving spending decisions. With the
knowledge that the midterm elections brought changes in
Congress and major legislative issues are still pending,
the fourth quarter will likely give a clearer indication of
what lies ahead, especially looking at 2011.
NATIONAL
ASSOCIATION of
REALTORS®
RESEARCH
NOVEMBER 2010
-1000
-800
-600
-400
-200
0
200
400
600
2008-Jan
2008-Mar
2008-May
2008-Jul
2008-Sep
2008-Nov
2009-Jan
2009-Mar
2009-May
2009-Jul
2009-Sep
2009-Nov
2010-Jan
2010-Mar
2010-May
2010-Jul
2010-Sep
Payroll Employment (Monthly Chg, '000s)
Source: BLS
COMMERCIAL REAL ESTATE
OUTLOOK
3
Annual Growth
Rates (%)
2010 I 2010 II 2010 III 2010 IV 2011 I 2011 II 2011 III 2011 IV 2012 I 2012 II 2009 2010 2011 2012
Real GDP 3.7 1.7 2.0 1.8 2.1 2.1 1.8 2.4 3.1 3.1 -2.6 2.7 2.0 2.8
Nonfarm
Payroll
Employment
0.2 2.2 -0.3 2.5 0.8 1.2 0.8 0.5 1.1 1.2 -4.3 -0.4 1.1 1.1
Consumer
Prices
1.5 -0.7 1.5 2.2 2.2 2.6 2.2 1.8 1.7 2.0 -0.3 1.6 1.9 1.9
Real
Disposable
Income
1.3 4.4 0.5 0.7 -0.6 1.1 1.1 1.5 3.2 2.7 0.6 1.1 0.8 2.4
Consumer
Confidence
52 58 51 52 53 54 55 58 61 61 45 53 55 63
Unemploymen
t (%)
9.7 9.7 9.6 9.8 9.8 9.7 9.6 9.5 9.4 9.3 9.3 9.7 9.7 9.3
Interest Rates
(%)
2010 I 2010 II 2010 III 2010 IV 2011 I 2011 II 2011 III 2011 IV 2012 I 2012 II 2009 2010 2011 2012
Fed Funds
Rate
0.1 0.2 0.2 0.1 0.1 0.3 0.5 1.0 1.5 1.8 0.2 0.2 0.5 2.0
3-Month T-Bill
Rate
0.1 0.1 0.2 0.4 0.4 0.7 0.9 1.3 1.7 1.9 0.2 0.2 0.8 2.1
Prime Rate 3.3 3.3 3.3 3.1 3.2 3.2 3.6 4.0 4.6 5.3 3.3 3.2 3.5 5.0
Corporate Aaa
Bond Yield
5.3 5.0 4.6 4.2 4.3 4.6 4.7 4.9 5.1 5.4 5.3 4.8 4.6 5.4
10-Year
Government
Bond
3.7 3.5 2.8 2.7 2.9 3.2 3.4 3.6 3.9 4.1 3.3 3.2 3.3 4.2
30-Year
Government
Bond
4.6 4.4 3.9 3.6 3.8 4.1 4.3 4.5 4.7 4.9 4.1 4.1 4.2 4.9
Source: National Association of REALTORS®
NATIONAL
ASSOCIATION of
REALTORS®
RESEARCH
NOVEMBER 2010
COMMERCIAL REAL ESTATE
OUTLOOK
4
OFFICE 2010 II 2010 III 2010 IV 2011 I 2011 II 2011 III 2011 IV 2009 2010 2011
Vacancy Rate 16.7% 16.6% 16.7% 16.8% 16.8% 16.6% 16.4% 15.7% 16.7% 16.7%
Net Absorption
('000 sq. ft.) 3,042 6,705 -2,353 1,128 2,357 5,723 7,155 -38,106 -3,705 16,363
Completions ('000
sq. ft.) 5,611 3,585 2,824 4,952 1,771 180 396 52,787 21,708 7,299
Inventory ('000,000
sq. ft.) 3,574 3,575 3,576 3,581 3,583 3,583 3,583 3,572 3,576 3,583
Rent Growth -0.5% -0.3% -0.4% -0.4% -0.4% -0.4% -0.4% -12.7% -1.8% -1.6%
INDUSTRIAL 2010 II 2010 III 2010 IV 2011 I 2011 II 2011 III 2011 IV 2009 2010 2011
Vacancy Rate 14.1% 14.0% 13.9% 13.8% 13.6% 13.4% 13.2% 13.2% 14.1% 13.5%
Net Absorption
('000 sq. ft.) -5,186 10,459 14,382 23,937 30,851 36,562 42,613 -258,071 -25,074 133,963
Completions ('000
sq. ft.) 6,551 2,639 5,702 3,087 10,676 11,604 14,717 70,082 27,192 40,084
Inventory ('000,000
sq. ft.) 13,167 13,169 13,174 13,177 13,188 13,199 13,214 13,110 13,174 13,214
Rent Growth -1.3% -0.4% -1.2% -0.9% -0.9% -0.9% -0.7% -10.9% -4.0% -3.4%
RETAIL 2010 II 2010 III 2010 IV 2011 I 2011 II 2011 III 2011 IV 2009 2010 2011
Vacancy Rate 13.1% 13.1% 13.1% 13.1% 13.1% 13.0% 13.0% 12.0% 13.1% 13.1%
Net Absorption
('000 sq. ft.) -637 994 179 595 1,045 1,484 1,907 -18,325 -481 5,031
Completions ('000
sq. ft.) 762 743 1,252 1,323 1,019 319 1,734 12,034 4,024 4,395
Inventory ('000,000
sq. ft.) 1,644 1,645 1,646 1,647 1,648 1,649 1,651 1,659 1,646 1,651
Rent Growth -1.0% -1.1% -0.6% -0.3% -0.1% 0.0% 0.1% -4.0% -3.4% -0.3%
MULTI-FAMILY 2010 II 2010 III 2010 IV 2011 I 2011 II 2011 III 2011 IV 2009 2010 2011
Vacancy Rate 6.0% 5.8% 6.4% 6.2% 5.8% 5.3% 5.8% 7.4% 6.4% 5.8%
Net Absorption
(Units) 90,474 39,651 -72,149 46,563 65,728 82,251 -47,590 105,458 85,173 146,952
Completions (Units) 15,193 12,339 11,012 11,580 12,501 14,647 17,076 177,589 59,461 55,804
Inventory
(Units in millions) 14.5 14.5 14.5 14.5 14.5 14.5 14.5 14.4 14.5 14.5
Rent Growth -0.1% 0.4% 0.2% 0.3% 0.3% 0.4% 0.4% -3.6% 0.2% 1.4%
Source: National Association of REALTORS®/CBRE-Econometric Advisors
NATIONAL
ASSOCIATION of
REALTORS®
RESEARCH
NOVEMBER 2010
COMMERCIAL REAL ESTATE
OUTLOOK
5
Office Industrial Retail Multifamily
Albuquerque, NM 18.4% 12.8% 12.6% 6.0%
Atlanta, GA 21.2% 18.6% 16.5% 9.6%
Austin, TX 17.6% 15.8% 12.3% 6.5%
Baltimore, MD 15.7% 15.4% 10.1% 5.4%
Boston, MA 13.2% 17.6% 10.1% 4.2%
Charlotte, NC 19.0% 15.9% 15.1% 7.4%
Chicago, IL 16.3% 14.9% 13.9% 6.0%
Cincinnati, OH 18.3% 12.9% 18.6% 7.9%
Cleveland, OH 18.3% 12.1% 17.4% 7.3%
Columbus, OH 17.7% 15.7% 17.3% 6.6%
Dallas, TX 22.5% 15.8% 16.9% 8.5%
Denver, CO 16.8% 12.4% 13.0% 5.8%
Detroit, MI 25.7% 20.6% 17.7% 8.5%
Fort Lauderdale, FL 17.0% 12.5% 12.4% 5.1%
Fort Worth, TX 15.1% 15.1% 17.0% 9.2%
Hartford, CT 19.5% 17.5%
Honolulu, HI 9.1% 7.8% 6.9%
Houston, TX 17.2% 10.7% 14.0% 10.3%
Indianapolis, IN 16.6% 12.6% 18.0% 9.0%
Jacksonville, FL 22.0% 15.2% 15.0% 10.1%
Kansas City, MO 16.8% 10.3% 18.5% 7.8%
Las Vegas, NV 24.9% 13.6% 17.6% 8.5%
Long Island, NY 17.6% 11.0% 8.0%
Los Angeles, CA 11.6% 8.0% 8.6% 5.7%
Miami, FL 14.4% 12.4% 8.3% 4.0%
Milwaukee, WI 19.1% 14.3%
Minneapolis, MN 20.2% 12.2% 13.9% 4.8%
Nashville, TN 14.0% 15.5% 12.4% 5.8%
New York, NY 8.8% 11.7% 8.6% 5.6%
Newark, NJ 15.7% 13.4% 4.9%
Oakland, CA 17.8% 14.2% 8.6% 4.6%
Orange County, CA 19.8% 11.1% 7.8% 5.0%
Orlando, FL 17.7% 15.9% 14.6% 7.3%
NATIONAL
ASSOCIATION of
REALTORS®
RESEARCH
NOVEMBER 2010
COMMERCIAL REAL ESTATE
OUTLOOK
6
Office Industrial Retail Multifamily
Philadelphia, PA 15.2% 13.5% 13.1% 5.2%
Phoenix, AZ 25.9% 18.2% 16.6% 8.9%
Pittsburgh, PA 11.4% 5.4%
Portland, OR 16.5% 10.7% 12.1% 4.2%
Raleigh, NC 14.9% 5.6%
Riverside, CA 22.4% 15.4% 14.5% 6.2%
Sacramento, CA 21.9% 18.4% 15.6% 7.4%
Salt Lake City, UT 16.6% 9.2% 15.8% 5.6%
San Diego, CA 18.9% 14.9% 10.5% 4.6%
San Francisco, CA 14.1% 10.6% 7.0% 4.9%
San Jose, CA 24.1% 14.6% 8.0% 3.4%
Seattle, WA 16.8% 11.2% 12.2% 4.9%
St. Louis, MO 15.9% 14.0% 14.5% 8.3%
Stamford, CT 12.8% 19.9%
Tampa, FL 23.2% 13.4% 12.7% 7.8%
Tucson, AZ 16.9% 12.8% 16.8% 8.1%
Ventura, CA 18.4% 12.3% 10.5%
Washington, DC 12.8% 15.2% 8.9% 4.6%
West Palm Beach, FL 21.1% 14.3% 13.3% 5.3%
Wilmington, DE 18.5% 13.7% 14.5%
National Averages* 16.7% 13.9% 13.1% 6.4%
*Not all markets are represented in chart above.
Source: NAR / CBRE-EA
NATIONAL 3.86%
OFFICE 3.12%
INDUSTRIAL 2.80%
RETAIL 3.39%
APARTMENT 6.04%
Source: National Council of Real Estate Investment Fiduciaries
NATIONAL
ASSOCIATION of
REALTORS®
RESEARCH
NOVEMBER 2010
COMMERCIAL REAL ESTATE
OUTLOOK
7
October 2010 – More than 400 SIOR market experts across
the country weighed in on industrial and office market
conditions for the Third Quarter 2010 SIOR Commercial Real
Estate Index. The responses, compiled by the SOCIETY OF
INDUSTRIAL AND OFFICE REALTORS (SIOR) in
association with the NATIONAL ASSOCIATION OF
REALTORS (NAR), present an accurate depiction of the
current industry as fall approaches.
The SIOR Index gained 1.6 points during third quarter 2010.
The SIOR Index, which measures 10 variables pertinent to
the performance of U.S. industrial and office markets (see
Methodology), rose again in the third quarter 2010,
advancing to reach 42.6—100 points signifies a balanced
market. Equilibrium has not been experienced (100 points)
since the third quarter of 2007.
For the past three quarters the market has been on a
gradual but steady incline. The Index has now reached the
level it was at in the beginning of 2009. Both the industrial
and office sectors realized gains once again. When asked
about the outlook of the next three months, 59 percent of
SIORs expected an improvement in the market, an increase
of 2 percent from last quarter.
Overall, vacancy rates are continuing to slowly improve,
however rents still remain low and subleasing space is still
high in this tenant market. Fewer respondents feel that
asking rents are below where they were a year ago, and
fewer SIORs feel that vacancy rates are higher than a year
ago.
Development remains stagnant in all regions and
investments are still low, but on the positive side,
development acquisitions and leasing activity are beginning
to grow in many parts of the country. Development
acquisitions are improving, as 96 percent of SIOR
respondents feel it is a buyer’s market as opposed to 97
percent last quarter.
Although SIOR members continue to report that the national
economic recession is significantly impacting local industrial
and office markets, several market indicators show signs of
leveling-off, and others, especially the Mid-West, are even
posting improvements. Fewer respondents today feel that
the national economy is having a negative impact on their
local market.
The vacancy rates are improving in all regions, however
there is still ample sublease space available and
concessions continue to make it a tenant’s market.
Practitioners from the Midwest are experiencing higher
vacancy rates than a year ago, and the South is posting
better results both in vacancy rates and leasing activity.
Development activity continues to be at a standstill across
the country, with the West, Midwest and South close to an
actual value of zero. Although construction is non existent,
SIORs say there are plenty of deals available for sites.
Office Market
The market improvements are visible more in lower levels of
tenant concessions in office markets, and leasing activity
and rental rates for the office market are slightly stronger
than the industrial market. However, the office market
continues to have more sublease space and higher vacancy
rates, and prospects for the next three months are lower for
office practitioners.
Industrial Market
The industrial marketplace has leasing activity below
historical levels, rental rates in a steeper decline, tenant
concessions from landlords at higher levels, sales prices
falling, and close to zero construction taking place. The
national economy is clearly having a negative impact on the
local markets, but more so for industrial practitioners.
Regional Breakdown
The West (36.8 points) improved by 1.9 points, however it
continues to suffer from weak local economic conditions,
excess sublease space, a deep level of concessions, and
falling prices. SIOR respondents in the West scored the
lowest outlook of all regions for the next quarter.
The South (47 points) saw the greatest improvement, rising
by three points, posting stronger leasing activity and better
vacancy rates. Local economies in the South are continuing
to fare comparatively better than other regions, although
development is still at a standstill.
The Northeast (45.7 points), gained less than a point since
last quarter, the smallest gain out of all regions. It posted
better vacancy rates, sublease space that is closing in on
normal, and more stable sales prices than other regions.
The Mid-West (42 points) improved by 1.3 points.
Development and activity still remains near zero, and it
continues to be a buyer’s market. However, the Midwest is
close to normal conditions for subleasing space.
NATIONAL
ASSOCIATION of
REALTORS®
RESEARCH
NOVEMBER 2010
COMMERCIAL REAL ESTATE
OUTLOOK
8
OFFICE
Region Average Cap Rate Average Price ($/Sq. Ft.)
Mid-Atlantic 5.7% $409
Midwest 6.8% $101
Northeast 5.8% $361
Southeast 6.8% $107
Southwest 8.0% $144
West 7.8% $207
INDUSTRIAL
Region Average Cap Rate Average Price ($/Sq. Ft.)
Mid-Atlantic 9.5% $60
Midwest 7.2% $51
Northeast - $72
Southeast 8.8% $43
Southwest 8.5% $59
West 8.4% $76
RETAIL
Region Average Cap Rate Average Price ($/Sq. Ft.)
Mid-Atlantic 8.0% $215
Midwest 8.3% $68
Northeast 6.2% $569
Southeast 8.4% $129
Southwest 7.3% $132
West 7.6% $238
MULTI-FAMILY
Region Average Cap Rate Average Price ($/Unit)
Mid-Atlantic 8.1% $124,642
Midwest 6.2% $36,931
Northeast 5.6% $171,048
Southeast 7.3% $90,361
Southwest 7.3% $91,757
West 5.9% $195,878
Note: Data based on sales closed in 2010.Q4 through October
Source: Real Capital Analytics
NATIONAL
ASSOCIATION of
REALTORS®
RESEARCH
NOVEMBER 2010
$0
$5
$10
2009Q3 2009Q4 2010Q1 2010Q2 2010Q3
Billions
Office Sales Volume
$0
$2
$4
$6
2009Q3 2009Q4 2010Q1 2010Q2 2010Q3
Billions
Industrial Sales Volume
$0
$5
$10
2009Q3 2009Q4 2010Q1 2010Q2 2010Q3
Billions
Retail Sales Volume
$0
$5
$10
2009Q3 2009Q4 2010Q1 2010Q2 2010Q3
Billions
Multifamily Sales Volume
COMMERCIAL REAL ESTATE
OUTLOOK
9
THE NATIONAL ASSOCIATION OF REALTORS®, “The Voice for Real Estate,” is
America’s largest trade association, representing 1.1 million members involved in
all aspects of the residential and commercial real estate industries..
The Research Division of the National Association of REALTORS® monitors and
analyzes monthly and quarterly economic indicators, including retail sales,
industrial production, producer price index, gross domestic product and
employment data that clearly impact commercial markets over time. In addition,
the Research Division provides several products covering commercial real estate:
• Commercial Member Profile
• Commercial Real Estate Quarterly Market Survey
For more information, please visit us at www.realtors.org/research. If you have
questions or comments regarding this report or any other commercial real estate
research, please contact George Ratiu, NAR Economist, at gratiu@realtors.org.
Although the information presented in this report has been obtained from reliable
sources, NAR does not guarantee its accuracy, and such information may be
incomplete. This report is for information purposes only. All opinions, assumptions
and estimates constitute NAR’s judgment as of the date of this publication and are
subject to change and evolving events. Actual results may vary from forecast
results.
NATIONAL ASSOCIATION OF REALTORS®
Research Division
500 New Jersey Avenue, NW
Washington, DC 20001
Copyright© 2010 NATIONAL ASSOCIATION OF REALTORS®. Reproduction,
reprinting or retransmission in any form is prohibited without written permission. For
questions regarding this matter please e-mail eresearch@realtors.org.
NATIONAL
ASSOCIATION of
REALTORS®
RESEARCH
NOVEMBER 2010

Weitere ähnliche Inhalte

Was ist angesagt?

2012 pia planning_guide
2012 pia planning_guide2012 pia planning_guide
2012 pia planning_guide
Jaeyoon Lee
 
Ulster Bank Northern Ireland PMI October 2021 Slide Pack
Ulster Bank Northern Ireland PMI October 2021 Slide PackUlster Bank Northern Ireland PMI October 2021 Slide Pack
Ulster Bank Northern Ireland PMI October 2021 Slide Pack
Richard Ramsey
 
Housing finance
Housing financeHousing finance
Housing finance
shabraham
 
Security Analysis Project on Tata Global Beverages
Security Analysis Project on Tata Global BeveragesSecurity Analysis Project on Tata Global Beverages
Security Analysis Project on Tata Global Beverages
Shameem Hamed
 

Was ist angesagt? (20)

PwC Global Economy Watch (sept. 2013)
PwC Global Economy Watch (sept. 2013)PwC Global Economy Watch (sept. 2013)
PwC Global Economy Watch (sept. 2013)
 
Construction White Paper
Construction White PaperConstruction White Paper
Construction White Paper
 
LPL Market Insights Chart Book 2nd Qtr 2011
LPL Market Insights Chart Book 2nd Qtr 2011LPL Market Insights Chart Book 2nd Qtr 2011
LPL Market Insights Chart Book 2nd Qtr 2011
 
PSMJ's 2015 A/E/C Market Outlook
PSMJ's 2015 A/E/C Market OutlookPSMJ's 2015 A/E/C Market Outlook
PSMJ's 2015 A/E/C Market Outlook
 
Federal agency cybersecurity funding
Federal agency cybersecurity fundingFederal agency cybersecurity funding
Federal agency cybersecurity funding
 
2012 pia planning_guide
2012 pia planning_guide2012 pia planning_guide
2012 pia planning_guide
 
DCR Trendline December 2013 – Contingent Worker Forecast and Supply Report
DCR Trendline December 2013 – Contingent Worker Forecast and Supply ReportDCR Trendline December 2013 – Contingent Worker Forecast and Supply Report
DCR Trendline December 2013 – Contingent Worker Forecast and Supply Report
 
The Lithuanian Economy - No 9, December 2, 2011
The Lithuanian Economy - No 9, December 2,  2011The Lithuanian Economy - No 9, December 2,  2011
The Lithuanian Economy - No 9, December 2, 2011
 
U.S. construction trends and outlook (Q1 2016)
U.S. construction trends and outlook (Q1 2016)U.S. construction trends and outlook (Q1 2016)
U.S. construction trends and outlook (Q1 2016)
 
The global economy effects on commodity dependent countries like zambia
The global economy effects on commodity dependent countries like zambiaThe global economy effects on commodity dependent countries like zambia
The global economy effects on commodity dependent countries like zambia
 
Ulster Bank Northern Ireland PMI October 2021 Slide Pack
Ulster Bank Northern Ireland PMI October 2021 Slide PackUlster Bank Northern Ireland PMI October 2021 Slide Pack
Ulster Bank Northern Ireland PMI October 2021 Slide Pack
 
Weakening boom reduces unemployment at an unanticipated rate – employment gro...
Weakening boom reduces unemployment at an unanticipated rate – employment gro...Weakening boom reduces unemployment at an unanticipated rate – employment gro...
Weakening boom reduces unemployment at an unanticipated rate – employment gro...
 
Ulster Bank NI June 2019 PMI Slide pack
Ulster Bank NI June 2019 PMI Slide packUlster Bank NI June 2019 PMI Slide pack
Ulster Bank NI June 2019 PMI Slide pack
 
Ibd20131111
Ibd20131111Ibd20131111
Ibd20131111
 
Housing finance
Housing financeHousing finance
Housing finance
 
What's on the horizon for the U.S. Skyline?
What's on the horizon for the U.S. Skyline?What's on the horizon for the U.S. Skyline?
What's on the horizon for the U.S. Skyline?
 
Ulster Bank Northern Ireland PMI - July 2018 Slidepack
Ulster Bank Northern Ireland PMI - July 2018 SlidepackUlster Bank Northern Ireland PMI - July 2018 Slidepack
Ulster Bank Northern Ireland PMI - July 2018 Slidepack
 
Security Analysis Project on Tata Global Beverages
Security Analysis Project on Tata Global BeveragesSecurity Analysis Project on Tata Global Beverages
Security Analysis Project on Tata Global Beverages
 
Macroeconomic relationships
Macroeconomic relationshipsMacroeconomic relationships
Macroeconomic relationships
 
Canadian M&A Insights - Summer 2017
Canadian M&A Insights - Summer 2017Canadian M&A Insights - Summer 2017
Canadian M&A Insights - Summer 2017
 

Andere mochten auch (6)

Commercial Forecast - November 2010
Commercial Forecast - November 2010Commercial Forecast - November 2010
Commercial Forecast - November 2010
 
Economic indicators for week of June 21-25
Economic indicators for week of June 21-25Economic indicators for week of June 21-25
Economic indicators for week of June 21-25
 
Economic Indicators for the week of October 11 - 15
Economic Indicators for the week of October 11 - 15 Economic Indicators for the week of October 11 - 15
Economic Indicators for the week of October 11 - 15
 
Summary of SEPTEMBER 2010 Existing Home Sales Statistics
Summary of SEPTEMBER 2010 Existing Home Sales StatisticsSummary of SEPTEMBER 2010 Existing Home Sales Statistics
Summary of SEPTEMBER 2010 Existing Home Sales Statistics
 
Economic Indicators for Week of October 18-22, 2010
Economic Indicators for Week of October 18-22, 2010Economic Indicators for Week of October 18-22, 2010
Economic Indicators for Week of October 18-22, 2010
 
Energy Efficiency in the Housing Market
Energy Efficiency in the Housing MarketEnergy Efficiency in the Housing Market
Energy Efficiency in the Housing Market
 

Ähnlich wie Commercial Real Estate Outlook - November 2010

Economic Indicators for Week of August 2-August 6, 2010
Economic Indicators for Week of August 2-August 6, 2010Economic Indicators for Week of August 2-August 6, 2010
Economic Indicators for Week of August 2-August 6, 2010
NAR Research
 
Real Estate Capital Markets Are Alive, If Not Quite Well
Real Estate Capital Markets Are Alive, If Not Quite WellReal Estate Capital Markets Are Alive, If Not Quite Well
Real Estate Capital Markets Are Alive, If Not Quite Well
Dan Hutchins
 
Indicus Ma Foi Randstad Employment Trends Survey - Wave 1 - 2011
Indicus Ma Foi Randstad Employment Trends Survey - Wave 1 - 2011Indicus Ma Foi Randstad Employment Trends Survey - Wave 1 - 2011
Indicus Ma Foi Randstad Employment Trends Survey - Wave 1 - 2011
Indicus Analytics Private Limited
 
4Q_2015_RetailReport_email
4Q_2015_RetailReport_email4Q_2015_RetailReport_email
4Q_2015_RetailReport_email
Patrick Anthon
 
RECI July 2016 Metro Chicago Core MOB Snapshot
RECI July 2016 Metro Chicago Core MOB SnapshotRECI July 2016 Metro Chicago Core MOB Snapshot
RECI July 2016 Metro Chicago Core MOB Snapshot
Thomas Amato
 

Ähnlich wie Commercial Real Estate Outlook - November 2010 (20)

Office fall2010 final
Office fall2010 finalOffice fall2010 final
Office fall2010 final
 
FEB 2020 COMMERCIAL REAL ESTATE OUTLOOK AND TRENDS
FEB 2020 COMMERCIAL REAL ESTATE OUTLOOK AND TRENDSFEB 2020 COMMERCIAL REAL ESTATE OUTLOOK AND TRENDS
FEB 2020 COMMERCIAL REAL ESTATE OUTLOOK AND TRENDS
 
Economic Indicators for Week of August 2-August 6, 2010
Economic Indicators for Week of August 2-August 6, 2010Economic Indicators for Week of August 2-August 6, 2010
Economic Indicators for Week of August 2-August 6, 2010
 
Real Estate Capital Markets Are Alive, If Not Quite Well
Real Estate Capital Markets Are Alive, If Not Quite WellReal Estate Capital Markets Are Alive, If Not Quite Well
Real Estate Capital Markets Are Alive, If Not Quite Well
 
Money & Banking
Money & BankingMoney & Banking
Money & Banking
 
The Truth About Lying: An Economic Analysis
The Truth About Lying: An Economic AnalysisThe Truth About Lying: An Economic Analysis
The Truth About Lying: An Economic Analysis
 
Fairfax County FY2012-FY2014 Budget Forecast
Fairfax County FY2012-FY2014 Budget ForecastFairfax County FY2012-FY2014 Budget Forecast
Fairfax County FY2012-FY2014 Budget Forecast
 
Indicus Ma Foi Randstad Employment Trends Survey - Wave 1 - 2011
Indicus Ma Foi Randstad Employment Trends Survey - Wave 1 - 2011Indicus Ma Foi Randstad Employment Trends Survey - Wave 1 - 2011
Indicus Ma Foi Randstad Employment Trends Survey - Wave 1 - 2011
 
Saxo Bank Q3.pdf
Saxo Bank Q3.pdfSaxo Bank Q3.pdf
Saxo Bank Q3.pdf
 
Arbor EconomicOverview 2020 Q1
Arbor EconomicOverview 2020 Q1Arbor EconomicOverview 2020 Q1
Arbor EconomicOverview 2020 Q1
 
US Real Estate Indicators Report
US Real Estate Indicators ReportUS Real Estate Indicators Report
US Real Estate Indicators Report
 
4Q_2015_RetailReport_email
4Q_2015_RetailReport_email4Q_2015_RetailReport_email
4Q_2015_RetailReport_email
 
M&A Capital Market Update Q1 2021
M&A Capital Market Update Q1 2021M&A Capital Market Update Q1 2021
M&A Capital Market Update Q1 2021
 
RECI July 2016 Metro Chicago Core MOB Snapshot
RECI July 2016 Metro Chicago Core MOB SnapshotRECI July 2016 Metro Chicago Core MOB Snapshot
RECI July 2016 Metro Chicago Core MOB Snapshot
 
Economic Indicators for week of August 30-September 3, 2010
Economic Indicators for week of August 30-September 3, 2010Economic Indicators for week of August 30-September 3, 2010
Economic Indicators for week of August 30-September 3, 2010
 
Hh National Ahla3 Q10
Hh National Ahla3 Q10Hh National Ahla3 Q10
Hh National Ahla3 Q10
 
Mercer Capital's Value Focus: Real Estate Industry | Q1 2018 | Segment Focus:...
Mercer Capital's Value Focus: Real Estate Industry | Q1 2018 | Segment Focus:...Mercer Capital's Value Focus: Real Estate Industry | Q1 2018 | Segment Focus:...
Mercer Capital's Value Focus: Real Estate Industry | Q1 2018 | Segment Focus:...
 
The TeamLease Employment Outlook Report: July-September 2011
The TeamLease Employment Outlook Report: July-September 2011The TeamLease Employment Outlook Report: July-September 2011
The TeamLease Employment Outlook Report: July-September 2011
 
Today’s Economic Landscape and What’s on the Other Side February 2010
Today’s Economic Landscape and What’s on the Other Side February 2010Today’s Economic Landscape and What’s on the Other Side February 2010
Today’s Economic Landscape and What’s on the Other Side February 2010
 
Mercer Capital's Value Focus: Auto Dealer Industry | Year-End 2014
Mercer Capital's Value Focus: Auto Dealer Industry | Year-End 2014Mercer Capital's Value Focus: Auto Dealer Industry | Year-End 2014
Mercer Capital's Value Focus: Auto Dealer Industry | Year-End 2014
 

Mehr von NAR Research

Mortgage Delinquencies by State
Mortgage Delinquencies by StateMortgage Delinquencies by State
Mortgage Delinquencies by State
NAR Research
 
Mortgage Delinquencies
Mortgage DelinquenciesMortgage Delinquencies
Mortgage Delinquencies
NAR Research
 
Inflation Watch: February 17, 2011
Inflation Watch: February 17, 2011Inflation Watch: February 17, 2011
Inflation Watch: February 17, 2011
NAR Research
 
How Risky is the FHA’s Low Down Payment Program?
How Risky is the FHA’s Low Down Payment Program?How Risky is the FHA’s Low Down Payment Program?
How Risky is the FHA’s Low Down Payment Program?
NAR Research
 
Metro Area Unemployment
Metro Area UnemploymentMetro Area Unemployment
Metro Area Unemployment
NAR Research
 
State by State Employment Trends
State by State Employment TrendsState by State Employment Trends
State by State Employment Trends
NAR Research
 
Economic Indicators for the Week of January 18th
Economic Indicators for the Week of January 18thEconomic Indicators for the Week of January 18th
Economic Indicators for the Week of January 18th
NAR Research
 
Summary of December 2010 Existing-Home Sales
Summary of December 2010 Existing-Home SalesSummary of December 2010 Existing-Home Sales
Summary of December 2010 Existing-Home Sales
NAR Research
 
Inflation Watch for January, 2011
Inflation Watch for January, 2011Inflation Watch for January, 2011
Inflation Watch for January, 2011
NAR Research
 
Daily Economic Update for January 5, 2011
Daily Economic Update for January 5, 2011Daily Economic Update for January 5, 2011
Daily Economic Update for January 5, 2011
NAR Research
 
Daily Economic Update for January 04, 2011
Daily Economic Update for January 04, 2011Daily Economic Update for January 04, 2011
Daily Economic Update for January 04, 2011
NAR Research
 
Daily Economic Update, January 3, 2011
Daily Economic Update, January 3, 2011Daily Economic Update, January 3, 2011
Daily Economic Update, January 3, 2011
NAR Research
 
Daily Economic Update: December 30, 2010
Daily Economic Update: December 30, 2010Daily Economic Update: December 30, 2010
Daily Economic Update: December 30, 2010
NAR Research
 
Daily Economic Update, December 28, 2010
Daily Economic Update, December 28, 2010Daily Economic Update, December 28, 2010
Daily Economic Update, December 28, 2010
NAR Research
 
Daily Economic Update, December 27, 2010
Daily Economic Update, December 27, 2010Daily Economic Update, December 27, 2010
Daily Economic Update, December 27, 2010
NAR Research
 

Mehr von NAR Research (20)

Mortgage Delinquencies by State
Mortgage Delinquencies by StateMortgage Delinquencies by State
Mortgage Delinquencies by State
 
Mortgage Delinquencies
Mortgage DelinquenciesMortgage Delinquencies
Mortgage Delinquencies
 
Inflation Watch: February 17, 2011
Inflation Watch: February 17, 2011Inflation Watch: February 17, 2011
Inflation Watch: February 17, 2011
 
Recovery to Normalcy: Feb 2011
Recovery to Normalcy: Feb 2011Recovery to Normalcy: Feb 2011
Recovery to Normalcy: Feb 2011
 
Home Price Monitor
Home Price MonitorHome Price Monitor
Home Price Monitor
 
How Risky is the FHA’s Low Down Payment Program?
How Risky is the FHA’s Low Down Payment Program?How Risky is the FHA’s Low Down Payment Program?
How Risky is the FHA’s Low Down Payment Program?
 
Metro Area Monthly Mortgage Payments: 2005 vs 2010
Metro Area Monthly Mortgage Payments: 2005 vs 2010Metro Area Monthly Mortgage Payments: 2005 vs 2010
Metro Area Monthly Mortgage Payments: 2005 vs 2010
 
Metro Area Unemployment
Metro Area UnemploymentMetro Area Unemployment
Metro Area Unemployment
 
State by State Employment Trends
State by State Employment TrendsState by State Employment Trends
State by State Employment Trends
 
Economic Indicators for the Week of January 18th
Economic Indicators for the Week of January 18thEconomic Indicators for the Week of January 18th
Economic Indicators for the Week of January 18th
 
Summary of December 2010 Existing-Home Sales
Summary of December 2010 Existing-Home SalesSummary of December 2010 Existing-Home Sales
Summary of December 2010 Existing-Home Sales
 
Inflation Watch for January, 2011
Inflation Watch for January, 2011Inflation Watch for January, 2011
Inflation Watch for January, 2011
 
Daily Economic Update for January 5, 2011
Daily Economic Update for January 5, 2011Daily Economic Update for January 5, 2011
Daily Economic Update for January 5, 2011
 
Daily Economic Update for January 04, 2011
Daily Economic Update for January 04, 2011Daily Economic Update for January 04, 2011
Daily Economic Update for January 04, 2011
 
Daily Economic Update, January 3, 2011
Daily Economic Update, January 3, 2011Daily Economic Update, January 3, 2011
Daily Economic Update, January 3, 2011
 
Summary of NOVEMBER 2010 Pending Home Sales Statistics
Summary of NOVEMBER 2010 Pending Home Sales StatisticsSummary of NOVEMBER 2010 Pending Home Sales Statistics
Summary of NOVEMBER 2010 Pending Home Sales Statistics
 
Daily Economic Update: December 30, 2010
Daily Economic Update: December 30, 2010Daily Economic Update: December 30, 2010
Daily Economic Update: December 30, 2010
 
Daily Economic Update, December 28, 2010
Daily Economic Update, December 28, 2010Daily Economic Update, December 28, 2010
Daily Economic Update, December 28, 2010
 
Daily Economic Update, December 27, 2010
Daily Economic Update, December 27, 2010Daily Economic Update, December 27, 2010
Daily Economic Update, December 27, 2010
 
Economic Indicators for Week of December 20-23, 2010
Economic Indicators for Week of December 20-23, 2010Economic Indicators for Week of December 20-23, 2010
Economic Indicators for Week of December 20-23, 2010
 

Kürzlich hochgeladen

Cheap Rate ✨➥9711108085▻✨Call Girls In Chandni Chowk (Delhi)
Cheap Rate ✨➥9711108085▻✨Call Girls In Chandni Chowk (Delhi)Cheap Rate ✨➥9711108085▻✨Call Girls In Chandni Chowk (Delhi)
Cheap Rate ✨➥9711108085▻✨Call Girls In Chandni Chowk (Delhi)
delhi24hrs1
 
9990771857 Call Girls in Dwarka Sector 3 Delhi (Call Girls) Delhi
9990771857 Call Girls in Dwarka Sector 3 Delhi (Call Girls) Delhi9990771857 Call Girls in Dwarka Sector 3 Delhi (Call Girls) Delhi
9990771857 Call Girls in Dwarka Sector 3 Delhi (Call Girls) Delhi
delhimodel235
 
Call Girls in Anand Vihar Delhi +91 8447779280}Call Girls In Delhi Best in D...
Call Girls in Anand Vihar Delhi +91 8447779280}Call Girls In Delhi Best  in D...Call Girls in Anand Vihar Delhi +91 8447779280}Call Girls In Delhi Best  in D...
Call Girls in Anand Vihar Delhi +91 8447779280}Call Girls In Delhi Best in D...
asmaqueen5
 
Call Girls In Krishna Nagar Delhi (Escort)↫8447779280↬@SHOT 1500- NIGHT 5500→...
Call Girls In Krishna Nagar Delhi (Escort)↫8447779280↬@SHOT 1500- NIGHT 5500→...Call Girls In Krishna Nagar Delhi (Escort)↫8447779280↬@SHOT 1500- NIGHT 5500→...
Call Girls In Krishna Nagar Delhi (Escort)↫8447779280↬@SHOT 1500- NIGHT 5500→...
asmaqueen5
 
BPTP THE AMAARIO Luxury Project Invest Like Royalty in Sector 37D Gurgaon Dwa...
BPTP THE AMAARIO Luxury Project Invest Like Royalty in Sector 37D Gurgaon Dwa...BPTP THE AMAARIO Luxury Project Invest Like Royalty in Sector 37D Gurgaon Dwa...
BPTP THE AMAARIO Luxury Project Invest Like Royalty in Sector 37D Gurgaon Dwa...
ApartmentWala1
 
9990771857 Call Girls in Dwarka Sector 6 Delhi (Call Girls) Delhi
9990771857 Call Girls in Dwarka Sector 6 Delhi (Call Girls) Delhi9990771857 Call Girls in Dwarka Sector 6 Delhi (Call Girls) Delhi
9990771857 Call Girls in Dwarka Sector 6 Delhi (Call Girls) Delhi
delhimodel235
 
Bptp The Amaario Launch Luxury Project Sector 37D Gurgaon Dwarka Expressway...
Bptp The Amaario Launch  Luxury Project  Sector 37D Gurgaon Dwarka Expressway...Bptp The Amaario Launch  Luxury Project  Sector 37D Gurgaon Dwarka Expressway...
Bptp The Amaario Launch Luxury Project Sector 37D Gurgaon Dwarka Expressway...
ApartmentWala1
 
9990771857 Call Girls Dwarka Sector 8 Delhi (Call Girls ) Delhi
9990771857 Call Girls  Dwarka Sector 8 Delhi (Call Girls ) Delhi9990771857 Call Girls  Dwarka Sector 8 Delhi (Call Girls ) Delhi
9990771857 Call Girls Dwarka Sector 8 Delhi (Call Girls ) Delhi
delhimodel235
 
Call Girls In Gandhi Nagar↬Delhi NCR (Call Us) 8447779280 }Escorts in Delhi NcR
Call Girls In Gandhi Nagar↬Delhi NCR (Call Us) 8447779280 }Escorts in Delhi NcRCall Girls In Gandhi Nagar↬Delhi NCR (Call Us) 8447779280 }Escorts in Delhi NcR
Call Girls In Gandhi Nagar↬Delhi NCR (Call Us) 8447779280 }Escorts in Delhi NcR
asmaqueen5
 
9990771857 Call Girls in Dwarka Sector 6 Delhi (Call Girls) Delhi
9990771857 Call Girls in Dwarka Sector 6 Delhi (Call Girls) Delhi9990771857 Call Girls in Dwarka Sector 6 Delhi (Call Girls) Delhi
9990771857 Call Girls in Dwarka Sector 6 Delhi (Call Girls) Delhi
delhimodel235
 
Acibadem Konaklari Uskudar - Listin Turkey
Acibadem Konaklari Uskudar - Listin TurkeyAcibadem Konaklari Uskudar - Listin Turkey
Acibadem Konaklari Uskudar - Listin Turkey
Listing Turkey
 
Call Girls In Seelampur Delhi ↬8447779280}Seelampur Escorts Service In Delhi...
Call Girls In Seelampur  Delhi ↬8447779280}Seelampur Escorts Service In Delhi...Call Girls In Seelampur  Delhi ↬8447779280}Seelampur Escorts Service In Delhi...
Call Girls In Seelampur Delhi ↬8447779280}Seelampur Escorts Service In Delhi...
asmaqueen5
 
Call Girls in Karkardooma Delhi +91 84487779280}Woman Seeking Man in Delhi NCR
Call Girls in Karkardooma Delhi +91 84487779280}Woman Seeking Man in Delhi NCRCall Girls in Karkardooma Delhi +91 84487779280}Woman Seeking Man in Delhi NCR
Call Girls in Karkardooma Delhi +91 84487779280}Woman Seeking Man in Delhi NCR
asmaqueen5
 

Kürzlich hochgeladen (20)

Cheap Rate ✨➥9711108085▻✨Call Girls In Chandni Chowk (Delhi)
Cheap Rate ✨➥9711108085▻✨Call Girls In Chandni Chowk (Delhi)Cheap Rate ✨➥9711108085▻✨Call Girls In Chandni Chowk (Delhi)
Cheap Rate ✨➥9711108085▻✨Call Girls In Chandni Chowk (Delhi)
 
9990771857 Call Girls in Dwarka Sector 3 Delhi (Call Girls) Delhi
9990771857 Call Girls in Dwarka Sector 3 Delhi (Call Girls) Delhi9990771857 Call Girls in Dwarka Sector 3 Delhi (Call Girls) Delhi
9990771857 Call Girls in Dwarka Sector 3 Delhi (Call Girls) Delhi
 
Premium Villa Projects in Sarjapur Road Bengaluru
Premium Villa Projects in Sarjapur Road BengaluruPremium Villa Projects in Sarjapur Road Bengaluru
Premium Villa Projects in Sarjapur Road Bengaluru
 
Call Girls in Anand Vihar Delhi +91 8447779280}Call Girls In Delhi Best in D...
Call Girls in Anand Vihar Delhi +91 8447779280}Call Girls In Delhi Best  in D...Call Girls in Anand Vihar Delhi +91 8447779280}Call Girls In Delhi Best  in D...
Call Girls in Anand Vihar Delhi +91 8447779280}Call Girls In Delhi Best in D...
 
Yedi Mavi TOBB Zeytinburnu - Listing Turkey
Yedi Mavi TOBB Zeytinburnu - Listing TurkeyYedi Mavi TOBB Zeytinburnu - Listing Turkey
Yedi Mavi TOBB Zeytinburnu - Listing Turkey
 
Call Girls In Krishna Nagar Delhi (Escort)↫8447779280↬@SHOT 1500- NIGHT 5500→...
Call Girls In Krishna Nagar Delhi (Escort)↫8447779280↬@SHOT 1500- NIGHT 5500→...Call Girls In Krishna Nagar Delhi (Escort)↫8447779280↬@SHOT 1500- NIGHT 5500→...
Call Girls In Krishna Nagar Delhi (Escort)↫8447779280↬@SHOT 1500- NIGHT 5500→...
 
BPTP THE AMAARIO Luxury Project Invest Like Royalty in Sector 37D Gurgaon Dwa...
BPTP THE AMAARIO Luxury Project Invest Like Royalty in Sector 37D Gurgaon Dwa...BPTP THE AMAARIO Luxury Project Invest Like Royalty in Sector 37D Gurgaon Dwa...
BPTP THE AMAARIO Luxury Project Invest Like Royalty in Sector 37D Gurgaon Dwa...
 
9990771857 Call Girls in Dwarka Sector 6 Delhi (Call Girls) Delhi
9990771857 Call Girls in Dwarka Sector 6 Delhi (Call Girls) Delhi9990771857 Call Girls in Dwarka Sector 6 Delhi (Call Girls) Delhi
9990771857 Call Girls in Dwarka Sector 6 Delhi (Call Girls) Delhi
 
Bptp The Amaario Launch Luxury Project Sector 37D Gurgaon Dwarka Expressway...
Bptp The Amaario Launch  Luxury Project  Sector 37D Gurgaon Dwarka Expressway...Bptp The Amaario Launch  Luxury Project  Sector 37D Gurgaon Dwarka Expressway...
Bptp The Amaario Launch Luxury Project Sector 37D Gurgaon Dwarka Expressway...
 
9990771857 Call Girls Dwarka Sector 8 Delhi (Call Girls ) Delhi
9990771857 Call Girls  Dwarka Sector 8 Delhi (Call Girls ) Delhi9990771857 Call Girls  Dwarka Sector 8 Delhi (Call Girls ) Delhi
9990771857 Call Girls Dwarka Sector 8 Delhi (Call Girls ) Delhi
 
The Gale at Godrej Park World Hinjewadi Pune Brochure.pdf
The Gale at Godrej Park World Hinjewadi Pune Brochure.pdfThe Gale at Godrej Park World Hinjewadi Pune Brochure.pdf
The Gale at Godrej Park World Hinjewadi Pune Brochure.pdf
 
Call Girls In Gandhi Nagar↬Delhi NCR (Call Us) 8447779280 }Escorts in Delhi NcR
Call Girls In Gandhi Nagar↬Delhi NCR (Call Us) 8447779280 }Escorts in Delhi NcRCall Girls In Gandhi Nagar↬Delhi NCR (Call Us) 8447779280 }Escorts in Delhi NcR
Call Girls In Gandhi Nagar↬Delhi NCR (Call Us) 8447779280 }Escorts in Delhi NcR
 
9990771857 Call Girls in Dwarka Sector 6 Delhi (Call Girls) Delhi
9990771857 Call Girls in Dwarka Sector 6 Delhi (Call Girls) Delhi9990771857 Call Girls in Dwarka Sector 6 Delhi (Call Girls) Delhi
9990771857 Call Girls in Dwarka Sector 6 Delhi (Call Girls) Delhi
 
Acibadem Konaklari Uskudar - Listin Turkey
Acibadem Konaklari Uskudar - Listin TurkeyAcibadem Konaklari Uskudar - Listin Turkey
Acibadem Konaklari Uskudar - Listin Turkey
 
BDSM⚡Call Girls in Sector 57 Noida Escorts >༒8448380779 Escort Service
BDSM⚡Call Girls in Sector 57 Noida Escorts >༒8448380779 Escort ServiceBDSM⚡Call Girls in Sector 57 Noida Escorts >༒8448380779 Escort Service
BDSM⚡Call Girls in Sector 57 Noida Escorts >༒8448380779 Escort Service
 
Call Girls In Seelampur Delhi ↬8447779280}Seelampur Escorts Service In Delhi...
Call Girls In Seelampur  Delhi ↬8447779280}Seelampur Escorts Service In Delhi...Call Girls In Seelampur  Delhi ↬8447779280}Seelampur Escorts Service In Delhi...
Call Girls In Seelampur Delhi ↬8447779280}Seelampur Escorts Service In Delhi...
 
Mapusa Beach ( Call Girls ) Goa ✔ 8617370543 ✅ By Goa Call Girls For Pick Up ...
Mapusa Beach ( Call Girls ) Goa ✔ 8617370543 ✅ By Goa Call Girls For Pick Up ...Mapusa Beach ( Call Girls ) Goa ✔ 8617370543 ✅ By Goa Call Girls For Pick Up ...
Mapusa Beach ( Call Girls ) Goa ✔ 8617370543 ✅ By Goa Call Girls For Pick Up ...
 
Eldeco Dwarka Project In Delhi-brochure.pdf.pdf
Eldeco Dwarka Project In Delhi-brochure.pdf.pdfEldeco Dwarka Project In Delhi-brochure.pdf.pdf
Eldeco Dwarka Project In Delhi-brochure.pdf.pdf
 
Call Girls in Karkardooma Delhi +91 84487779280}Woman Seeking Man in Delhi NCR
Call Girls in Karkardooma Delhi +91 84487779280}Woman Seeking Man in Delhi NCRCall Girls in Karkardooma Delhi +91 84487779280}Woman Seeking Man in Delhi NCR
Call Girls in Karkardooma Delhi +91 84487779280}Woman Seeking Man in Delhi NCR
 
Real Estate Finance and Investments (2019).pdf
Real Estate Finance and Investments (2019).pdfReal Estate Finance and Investments (2019).pdf
Real Estate Finance and Investments (2019).pdf
 

Commercial Real Estate Outlook - November 2010

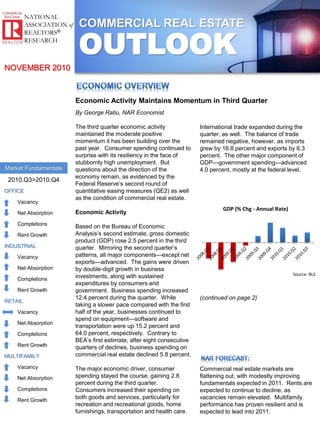
  • 1. COMMERCIAL REAL ESTATE OUTLOOK NOVEMBER 2010 By George Ratiu, NAR Economist The third quarter economic activity maintained the moderate positive momentum it has been building over the past year. Consumer spending continued to surprise with its resiliency in the face of stubbornly high unemployment. But questions about the direction of the economy remain, as evidenced by the Federal Reserve’s second round of quantitative easing measures (QE2) as well as the condition of commercial real estate. Economic Activity Based on the Bureau of Economic Analysis’s second estimate, gross domestic product (GDP) rose 2.5 percent in the third quarter. Mirroring the second quarter’s patterns, all major components—except net exports—advanced. The gains were driven by double-digit growth in business investments, along with sustained expenditures by consumers and government. Business spending increased 12.4 percent during the quarter. While taking a slower pace compared with the first half of the year, businesses continued to spend on equipment—software and transportation were up 15.2 percent and 64.0 percent, respectively. Contrary to BEA’s first estimate, after eight consecutive quarters of declines, business spending on commercial real estate declined 5.8 percent. The major economic driver, consumer spending stayed the course, gaining 2.8 percent during the third quarter. Consumers increased their spending on both goods and services, particularly for recreation and recreational goods, home furnishings, transportation and health care. International trade expanded during the quarter, as well. The balance of trade remained negative, however, as imports grew by 16.8 percent and exports by 6.3 percent. The other major component of GDP—government spending—advanced 4.0 percent, mostly at the federal level. (continued on page 2) Commercial real estate markets are flattening out, with modestly improving fundamentals expected in 2011. Rents are expected to continue to decline, as vacancies remain elevated. Multifamily performance has proven resilient and is expected to lead into 2011. Economic Activity Maintains Momentum in Third Quarter Market Fundamentals 2010.Q3>2010.Q4 OFFICE Vacancy Net Absorption Completions Rent Growth INDUSTRIAL Vacancy Net Absorption Completions Rent Growth RETAIL Vacancy Net Absorption Completions Rent Growth MULTIFAMILY Vacancy Net Absorption Completions Rent Growth NATIONAL ASSOCIATION of REALTORS® RESEARCH GDP (% Chg - Annual Rate) Source: BLS
  • 2. COMMERCIAL REAL ESTATE OUTLOOK 2 (continued from page 1) Employment After a strong first half of 2010, employment trends took a dive during the third quarter. Businesses, while still spending, are doing so more targeted and not on jobs. While corporate profits are back up to their peak before the recession, companies are just sitting on cash and not actively pursuing expansion plans. The number of payroll jobs declined by 53,000 for the period. The decline was somewhat offset in October, when the economy added 151,000 jobs. But, employment conditions remain mired in uncertainty. The first-time unemployment insurance claims have been stuck at around 450,000 per week. The figure needs to fall below 400,000 per week to ensure a meaningful, consistent job creation. In addition, the number of people drawing unemployment benefits stayed above 4.5 million. Not surprisingly, the unemployment rate has been fixed at 9.6 percent for three months. Given the tepid pace of recovery and the employment picture, consumers remained uncertain. In addition, the midterm elections provided an added measure of volatility to consumers’ mood. The two main measures of consumer confidence and sentiment mirrored these trends. The consumer confidence index compiled by the Conference Board—a measure that considers respondents’ general feelings about the job market and their finances—declined from a high of 62.7 in May to 48.6 in September, the second lowest value for the year. More troubling, consumers’ expectations are also on the decline, after a burst of optimism during the first half. Meanwhile, the University of Michigan survey of consumer sentiment also declined during the third quarter, to close at 68.2 in September. It has risen slightly to 69.3 during November, but remains well below the 100 value typical of economic expansions. Commercial Lending Commercial sales transactions are slowly rising. However, the commercial markets are starting to experience a bifurcation along property values. While investment capital appears ready to deal at the high-end of the market, the smaller size investments and businesses are still finding little room to maneuver. With fundamentals on an upward trend, larger properties in stronger markets are attracting investor interest. At the same time, smaller properties in slower markets continue to display signs of distress. Commercial Realtors cite lack of financing as the main obstacle to a broad market recovery. Commercial loan originations are down 83 percent from peak, lending standards remain stringent and, faced with other investment alternatives, banks remain wary of commercial transactions. The QE2 attempt to keep long- term rates lower, which may or may not be working, is inconsequential to the market compared to the importance of returning lending standards to normal from their overly stringent current rules. For the time being, buyers with cash are facing few, if any, competitors in bidding for a building. Outlook The third quarter survey mirrors a weak-yet-hopeful commercial real estate market. While the economy grows, high unemployment continues to figure prominently in the minds of both consumers and businesses, driving spending decisions. With the knowledge that the midterm elections brought changes in Congress and major legislative issues are still pending, the fourth quarter will likely give a clearer indication of what lies ahead, especially looking at 2011. NATIONAL ASSOCIATION of REALTORS® RESEARCH NOVEMBER 2010 -1000 -800 -600 -400 -200 0 200 400 600 2008-Jan 2008-Mar 2008-May 2008-Jul 2008-Sep 2008-Nov 2009-Jan 2009-Mar 2009-May 2009-Jul 2009-Sep 2009-Nov 2010-Jan 2010-Mar 2010-May 2010-Jul 2010-Sep Payroll Employment (Monthly Chg, '000s) Source: BLS
  • 3. COMMERCIAL REAL ESTATE OUTLOOK 3 Annual Growth Rates (%) 2010 I 2010 II 2010 III 2010 IV 2011 I 2011 II 2011 III 2011 IV 2012 I 2012 II 2009 2010 2011 2012 Real GDP 3.7 1.7 2.0 1.8 2.1 2.1 1.8 2.4 3.1 3.1 -2.6 2.7 2.0 2.8 Nonfarm Payroll Employment 0.2 2.2 -0.3 2.5 0.8 1.2 0.8 0.5 1.1 1.2 -4.3 -0.4 1.1 1.1 Consumer Prices 1.5 -0.7 1.5 2.2 2.2 2.6 2.2 1.8 1.7 2.0 -0.3 1.6 1.9 1.9 Real Disposable Income 1.3 4.4 0.5 0.7 -0.6 1.1 1.1 1.5 3.2 2.7 0.6 1.1 0.8 2.4 Consumer Confidence 52 58 51 52 53 54 55 58 61 61 45 53 55 63 Unemploymen t (%) 9.7 9.7 9.6 9.8 9.8 9.7 9.6 9.5 9.4 9.3 9.3 9.7 9.7 9.3 Interest Rates (%) 2010 I 2010 II 2010 III 2010 IV 2011 I 2011 II 2011 III 2011 IV 2012 I 2012 II 2009 2010 2011 2012 Fed Funds Rate 0.1 0.2 0.2 0.1 0.1 0.3 0.5 1.0 1.5 1.8 0.2 0.2 0.5 2.0 3-Month T-Bill Rate 0.1 0.1 0.2 0.4 0.4 0.7 0.9 1.3 1.7 1.9 0.2 0.2 0.8 2.1 Prime Rate 3.3 3.3 3.3 3.1 3.2 3.2 3.6 4.0 4.6 5.3 3.3 3.2 3.5 5.0 Corporate Aaa Bond Yield 5.3 5.0 4.6 4.2 4.3 4.6 4.7 4.9 5.1 5.4 5.3 4.8 4.6 5.4 10-Year Government Bond 3.7 3.5 2.8 2.7 2.9 3.2 3.4 3.6 3.9 4.1 3.3 3.2 3.3 4.2 30-Year Government Bond 4.6 4.4 3.9 3.6 3.8 4.1 4.3 4.5 4.7 4.9 4.1 4.1 4.2 4.9 Source: National Association of REALTORS® NATIONAL ASSOCIATION of REALTORS® RESEARCH NOVEMBER 2010
  • 4. COMMERCIAL REAL ESTATE OUTLOOK 4 OFFICE 2010 II 2010 III 2010 IV 2011 I 2011 II 2011 III 2011 IV 2009 2010 2011 Vacancy Rate 16.7% 16.6% 16.7% 16.8% 16.8% 16.6% 16.4% 15.7% 16.7% 16.7% Net Absorption ('000 sq. ft.) 3,042 6,705 -2,353 1,128 2,357 5,723 7,155 -38,106 -3,705 16,363 Completions ('000 sq. ft.) 5,611 3,585 2,824 4,952 1,771 180 396 52,787 21,708 7,299 Inventory ('000,000 sq. ft.) 3,574 3,575 3,576 3,581 3,583 3,583 3,583 3,572 3,576 3,583 Rent Growth -0.5% -0.3% -0.4% -0.4% -0.4% -0.4% -0.4% -12.7% -1.8% -1.6% INDUSTRIAL 2010 II 2010 III 2010 IV 2011 I 2011 II 2011 III 2011 IV 2009 2010 2011 Vacancy Rate 14.1% 14.0% 13.9% 13.8% 13.6% 13.4% 13.2% 13.2% 14.1% 13.5% Net Absorption ('000 sq. ft.) -5,186 10,459 14,382 23,937 30,851 36,562 42,613 -258,071 -25,074 133,963 Completions ('000 sq. ft.) 6,551 2,639 5,702 3,087 10,676 11,604 14,717 70,082 27,192 40,084 Inventory ('000,000 sq. ft.) 13,167 13,169 13,174 13,177 13,188 13,199 13,214 13,110 13,174 13,214 Rent Growth -1.3% -0.4% -1.2% -0.9% -0.9% -0.9% -0.7% -10.9% -4.0% -3.4% RETAIL 2010 II 2010 III 2010 IV 2011 I 2011 II 2011 III 2011 IV 2009 2010 2011 Vacancy Rate 13.1% 13.1% 13.1% 13.1% 13.1% 13.0% 13.0% 12.0% 13.1% 13.1% Net Absorption ('000 sq. ft.) -637 994 179 595 1,045 1,484 1,907 -18,325 -481 5,031 Completions ('000 sq. ft.) 762 743 1,252 1,323 1,019 319 1,734 12,034 4,024 4,395 Inventory ('000,000 sq. ft.) 1,644 1,645 1,646 1,647 1,648 1,649 1,651 1,659 1,646 1,651 Rent Growth -1.0% -1.1% -0.6% -0.3% -0.1% 0.0% 0.1% -4.0% -3.4% -0.3% MULTI-FAMILY 2010 II 2010 III 2010 IV 2011 I 2011 II 2011 III 2011 IV 2009 2010 2011 Vacancy Rate 6.0% 5.8% 6.4% 6.2% 5.8% 5.3% 5.8% 7.4% 6.4% 5.8% Net Absorption (Units) 90,474 39,651 -72,149 46,563 65,728 82,251 -47,590 105,458 85,173 146,952 Completions (Units) 15,193 12,339 11,012 11,580 12,501 14,647 17,076 177,589 59,461 55,804 Inventory (Units in millions) 14.5 14.5 14.5 14.5 14.5 14.5 14.5 14.4 14.5 14.5 Rent Growth -0.1% 0.4% 0.2% 0.3% 0.3% 0.4% 0.4% -3.6% 0.2% 1.4% Source: National Association of REALTORS®/CBRE-Econometric Advisors NATIONAL ASSOCIATION of REALTORS® RESEARCH NOVEMBER 2010
  • 5. COMMERCIAL REAL ESTATE OUTLOOK 5 Office Industrial Retail Multifamily Albuquerque, NM 18.4% 12.8% 12.6% 6.0% Atlanta, GA 21.2% 18.6% 16.5% 9.6% Austin, TX 17.6% 15.8% 12.3% 6.5% Baltimore, MD 15.7% 15.4% 10.1% 5.4% Boston, MA 13.2% 17.6% 10.1% 4.2% Charlotte, NC 19.0% 15.9% 15.1% 7.4% Chicago, IL 16.3% 14.9% 13.9% 6.0% Cincinnati, OH 18.3% 12.9% 18.6% 7.9% Cleveland, OH 18.3% 12.1% 17.4% 7.3% Columbus, OH 17.7% 15.7% 17.3% 6.6% Dallas, TX 22.5% 15.8% 16.9% 8.5% Denver, CO 16.8% 12.4% 13.0% 5.8% Detroit, MI 25.7% 20.6% 17.7% 8.5% Fort Lauderdale, FL 17.0% 12.5% 12.4% 5.1% Fort Worth, TX 15.1% 15.1% 17.0% 9.2% Hartford, CT 19.5% 17.5% Honolulu, HI 9.1% 7.8% 6.9% Houston, TX 17.2% 10.7% 14.0% 10.3% Indianapolis, IN 16.6% 12.6% 18.0% 9.0% Jacksonville, FL 22.0% 15.2% 15.0% 10.1% Kansas City, MO 16.8% 10.3% 18.5% 7.8% Las Vegas, NV 24.9% 13.6% 17.6% 8.5% Long Island, NY 17.6% 11.0% 8.0% Los Angeles, CA 11.6% 8.0% 8.6% 5.7% Miami, FL 14.4% 12.4% 8.3% 4.0% Milwaukee, WI 19.1% 14.3% Minneapolis, MN 20.2% 12.2% 13.9% 4.8% Nashville, TN 14.0% 15.5% 12.4% 5.8% New York, NY 8.8% 11.7% 8.6% 5.6% Newark, NJ 15.7% 13.4% 4.9% Oakland, CA 17.8% 14.2% 8.6% 4.6% Orange County, CA 19.8% 11.1% 7.8% 5.0% Orlando, FL 17.7% 15.9% 14.6% 7.3% NATIONAL ASSOCIATION of REALTORS® RESEARCH NOVEMBER 2010
  • 6. COMMERCIAL REAL ESTATE OUTLOOK 6 Office Industrial Retail Multifamily Philadelphia, PA 15.2% 13.5% 13.1% 5.2% Phoenix, AZ 25.9% 18.2% 16.6% 8.9% Pittsburgh, PA 11.4% 5.4% Portland, OR 16.5% 10.7% 12.1% 4.2% Raleigh, NC 14.9% 5.6% Riverside, CA 22.4% 15.4% 14.5% 6.2% Sacramento, CA 21.9% 18.4% 15.6% 7.4% Salt Lake City, UT 16.6% 9.2% 15.8% 5.6% San Diego, CA 18.9% 14.9% 10.5% 4.6% San Francisco, CA 14.1% 10.6% 7.0% 4.9% San Jose, CA 24.1% 14.6% 8.0% 3.4% Seattle, WA 16.8% 11.2% 12.2% 4.9% St. Louis, MO 15.9% 14.0% 14.5% 8.3% Stamford, CT 12.8% 19.9% Tampa, FL 23.2% 13.4% 12.7% 7.8% Tucson, AZ 16.9% 12.8% 16.8% 8.1% Ventura, CA 18.4% 12.3% 10.5% Washington, DC 12.8% 15.2% 8.9% 4.6% West Palm Beach, FL 21.1% 14.3% 13.3% 5.3% Wilmington, DE 18.5% 13.7% 14.5% National Averages* 16.7% 13.9% 13.1% 6.4% *Not all markets are represented in chart above. Source: NAR / CBRE-EA NATIONAL 3.86% OFFICE 3.12% INDUSTRIAL 2.80% RETAIL 3.39% APARTMENT 6.04% Source: National Council of Real Estate Investment Fiduciaries NATIONAL ASSOCIATION of REALTORS® RESEARCH NOVEMBER 2010
  • 7. COMMERCIAL REAL ESTATE OUTLOOK 7 October 2010 – More than 400 SIOR market experts across the country weighed in on industrial and office market conditions for the Third Quarter 2010 SIOR Commercial Real Estate Index. The responses, compiled by the SOCIETY OF INDUSTRIAL AND OFFICE REALTORS (SIOR) in association with the NATIONAL ASSOCIATION OF REALTORS (NAR), present an accurate depiction of the current industry as fall approaches. The SIOR Index gained 1.6 points during third quarter 2010. The SIOR Index, which measures 10 variables pertinent to the performance of U.S. industrial and office markets (see Methodology), rose again in the third quarter 2010, advancing to reach 42.6—100 points signifies a balanced market. Equilibrium has not been experienced (100 points) since the third quarter of 2007. For the past three quarters the market has been on a gradual but steady incline. The Index has now reached the level it was at in the beginning of 2009. Both the industrial and office sectors realized gains once again. When asked about the outlook of the next three months, 59 percent of SIORs expected an improvement in the market, an increase of 2 percent from last quarter. Overall, vacancy rates are continuing to slowly improve, however rents still remain low and subleasing space is still high in this tenant market. Fewer respondents feel that asking rents are below where they were a year ago, and fewer SIORs feel that vacancy rates are higher than a year ago. Development remains stagnant in all regions and investments are still low, but on the positive side, development acquisitions and leasing activity are beginning to grow in many parts of the country. Development acquisitions are improving, as 96 percent of SIOR respondents feel it is a buyer’s market as opposed to 97 percent last quarter. Although SIOR members continue to report that the national economic recession is significantly impacting local industrial and office markets, several market indicators show signs of leveling-off, and others, especially the Mid-West, are even posting improvements. Fewer respondents today feel that the national economy is having a negative impact on their local market. The vacancy rates are improving in all regions, however there is still ample sublease space available and concessions continue to make it a tenant’s market. Practitioners from the Midwest are experiencing higher vacancy rates than a year ago, and the South is posting better results both in vacancy rates and leasing activity. Development activity continues to be at a standstill across the country, with the West, Midwest and South close to an actual value of zero. Although construction is non existent, SIORs say there are plenty of deals available for sites. Office Market The market improvements are visible more in lower levels of tenant concessions in office markets, and leasing activity and rental rates for the office market are slightly stronger than the industrial market. However, the office market continues to have more sublease space and higher vacancy rates, and prospects for the next three months are lower for office practitioners. Industrial Market The industrial marketplace has leasing activity below historical levels, rental rates in a steeper decline, tenant concessions from landlords at higher levels, sales prices falling, and close to zero construction taking place. The national economy is clearly having a negative impact on the local markets, but more so for industrial practitioners. Regional Breakdown The West (36.8 points) improved by 1.9 points, however it continues to suffer from weak local economic conditions, excess sublease space, a deep level of concessions, and falling prices. SIOR respondents in the West scored the lowest outlook of all regions for the next quarter. The South (47 points) saw the greatest improvement, rising by three points, posting stronger leasing activity and better vacancy rates. Local economies in the South are continuing to fare comparatively better than other regions, although development is still at a standstill. The Northeast (45.7 points), gained less than a point since last quarter, the smallest gain out of all regions. It posted better vacancy rates, sublease space that is closing in on normal, and more stable sales prices than other regions. The Mid-West (42 points) improved by 1.3 points. Development and activity still remains near zero, and it continues to be a buyer’s market. However, the Midwest is close to normal conditions for subleasing space. NATIONAL ASSOCIATION of REALTORS® RESEARCH NOVEMBER 2010
  • 8. COMMERCIAL REAL ESTATE OUTLOOK 8 OFFICE Region Average Cap Rate Average Price ($/Sq. Ft.) Mid-Atlantic 5.7% $409 Midwest 6.8% $101 Northeast 5.8% $361 Southeast 6.8% $107 Southwest 8.0% $144 West 7.8% $207 INDUSTRIAL Region Average Cap Rate Average Price ($/Sq. Ft.) Mid-Atlantic 9.5% $60 Midwest 7.2% $51 Northeast - $72 Southeast 8.8% $43 Southwest 8.5% $59 West 8.4% $76 RETAIL Region Average Cap Rate Average Price ($/Sq. Ft.) Mid-Atlantic 8.0% $215 Midwest 8.3% $68 Northeast 6.2% $569 Southeast 8.4% $129 Southwest 7.3% $132 West 7.6% $238 MULTI-FAMILY Region Average Cap Rate Average Price ($/Unit) Mid-Atlantic 8.1% $124,642 Midwest 6.2% $36,931 Northeast 5.6% $171,048 Southeast 7.3% $90,361 Southwest 7.3% $91,757 West 5.9% $195,878 Note: Data based on sales closed in 2010.Q4 through October Source: Real Capital Analytics NATIONAL ASSOCIATION of REALTORS® RESEARCH NOVEMBER 2010 $0 $5 $10 2009Q3 2009Q4 2010Q1 2010Q2 2010Q3 Billions Office Sales Volume $0 $2 $4 $6 2009Q3 2009Q4 2010Q1 2010Q2 2010Q3 Billions Industrial Sales Volume $0 $5 $10 2009Q3 2009Q4 2010Q1 2010Q2 2010Q3 Billions Retail Sales Volume $0 $5 $10 2009Q3 2009Q4 2010Q1 2010Q2 2010Q3 Billions Multifamily Sales Volume
  • 9. COMMERCIAL REAL ESTATE OUTLOOK 9 THE NATIONAL ASSOCIATION OF REALTORS®, “The Voice for Real Estate,” is America’s largest trade association, representing 1.1 million members involved in all aspects of the residential and commercial real estate industries.. The Research Division of the National Association of REALTORS® monitors and analyzes monthly and quarterly economic indicators, including retail sales, industrial production, producer price index, gross domestic product and employment data that clearly impact commercial markets over time. In addition, the Research Division provides several products covering commercial real estate: • Commercial Member Profile • Commercial Real Estate Quarterly Market Survey For more information, please visit us at www.realtors.org/research. If you have questions or comments regarding this report or any other commercial real estate research, please contact George Ratiu, NAR Economist, at gratiu@realtors.org. Although the information presented in this report has been obtained from reliable sources, NAR does not guarantee its accuracy, and such information may be incomplete. This report is for information purposes only. All opinions, assumptions and estimates constitute NAR’s judgment as of the date of this publication and are subject to change and evolving events. Actual results may vary from forecast results. NATIONAL ASSOCIATION OF REALTORS® Research Division 500 New Jersey Avenue, NW Washington, DC 20001 Copyright© 2010 NATIONAL ASSOCIATION OF REALTORS®. Reproduction, reprinting or retransmission in any form is prohibited without written permission. For questions regarding this matter please e-mail eresearch@realtors.org. NATIONAL ASSOCIATION of REALTORS® RESEARCH NOVEMBER 2010