ECR Europe Forum '05. Use the ECR scorecard to benchmark and improve your performance
•
4 gefällt mir•4,247 views

Use the ECR scorecard to benchmark and improve your performance: The ECR scorecard from the Global Commerce Initiative (GCI) enables you to benchmark your supply- and demand-side collaboration against the performance of other companies. This session explains the use of the scorecard and includes a short explanation of basic ECR techniques.

Empfohlen
Weitere ähnliche Inhalte
Was ist angesagt?
Was ist angesagt? (18)
Andere mochten auch
Andere mochten auch (13)
Ähnlich wie ECR Europe Forum '05. Use the ECR scorecard to benchmark and improve your performance
Ähnlich wie ECR Europe Forum '05. Use the ECR scorecard to benchmark and improve your performance (20)
Mehr von ECR Community
Mehr von ECR Community (20)
Kürzlich hochgeladen
Kürzlich hochgeladen (20)
ECR Europe Forum '05. Use the ECR scorecard to benchmark and improve your performance
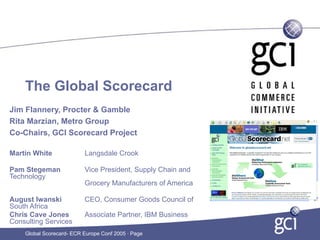
- 1. The Global Scorecard Jim Flannery, Procter & Gamble Rita Marzian, Metro Group Co-Chairs, GCI Scorecard Project Martin White Langsdale Crook Pam Stegeman Vice President, Supply Chain and Technology Grocery Manufacturers of America August Iwanski CEO, Consumer Goods Council of South Africa Chris Cave Jones Associate Partner, IBM Business Consulting Services Global Scorecard- ECR Europe Conf 2005 · Page
- 2. Agenda – “Find out What ECR Can do for You” What is the Global Scorecard and how can it help me? How does it work? Key Performance Indicators – the Hard Business Results Help me understand the capabilities. Show me the benefits ! How Companies and Countries are using the scorecard to improve results Case studies A Challenge from the Scorecard Project team Global Scorecard- ECR Europe Conf 2005 · Page
- 3. What is the Global Scorecard? Background on the Scorecard Project October 1998 March 1999 – Amsterdam Wouldn’t it be a good idea First Global Scorecard meeting to converge the world’s ECR Scorecards into ONE Mission: that could be consistently used by companies around Create a tool to enable the world? companies to… Understand performance Compare results in a common way Establish priorities The tool should be capable of being used… Internally Collaboratively Global Scorecard- ECR Europe Conf 2005 · Page
- 4. Scorecard Journey Four Clear Objectives A tool capable of Globally consistent supporting single but “modular” useable in company or joint developing or mature engagement ECR situations More pragmatic Simple linked to KPIs Easy to use (day-to-day management) Global Scorecard- ECR Europe Conf 2005 · Page
- 5. The Global Scorecard – a Capability Assessment tool - a simple solution to 4 business questions WWW.GLOBALSCORECARD.NET Global Scorecard- ECR Europe Conf 2005 · Page
- 6. 1. What is it I want to deliver ? Key Performance Indicators Implementation Measures Global Scorecard- ECR Europe Conf 2005 · Page
- 7. 8 Key Performance Indicators Category Share – Is the organization achieving the category share desired? Service Level / Unit Fill Rate – Are all items being delivered as ordered? On-Time Delivery – Are goods arriving when expected? Inventory – Have we minimized the amount of inventory needed in the supply chain? On-Shelf / Point-of-Sale availability – Can the consumer purchase the product when they want it? Order to Delivery Lead Time – How responsive are we to changing consumer needs? Distribution costs – Have we optimized the cost of product transportation & storage? Data Synchronization – Do we efficiently get information flow right the first time? Global Scorecard- ECR Europe Conf 2005 · Page
- 8. KPI Purpose / Comments Measure Definition Timeframe of Example Where Measured Manuf. Retailer Joint measure Scorecard InternalScorecards Service Level To measure if the units / % Of cases / For all cases / trading Use the data A fill measure. (E.g. if 50 cases of Manufacturer to retailer DC. 1 or 3 1, 2 (& 3 if 1, 2 (& 3 if / Unit Fill Rate items being ordered are trading units / units / items ordered, systems item “A” and 75 cases of item “B” (for DSD) manufacturer to applicable) applicable) volume the % delivered as available from the were ordered but 50 cases of item being delivered complete store delivered as ordered. (A volume fill enterprise. For “A” and 60 cases of item “B” were as measured by the Retailer to Store ordered measure) benchmarking, delivered. The service level would (for make to order or recipient. This is a case/ report the be 88% - 110/125) consumer direct) trading unit/volume average of these Manufacturer to Consumer data points over measure. the most recent Over deliveries and back 6-month period. orders should not be included in this measure. On-Time To measure order % Of orders # Of purchase orders 1700 orders placed, 1560 Manufacturer to retailer DC. 1 or 3 1, 2 (& 3 if 1, 2 (& 3 if Delivery processing and delivered on delivered on time delivered on-time (per final (for DSD) manufacturer to applicable) applicable) distribution performance time. Purchase Order) = 91.1% divided by the store number of orders. Retailer to Store “on-time” is based on (for make to order or the recipients agreed consumer direct) delivery window Manufacturer to Consumer Inventory Measure finished goods Days “Value” of finished Finished goods inventory Value = Manufacturer DC 1,2 & 3 2&3 1,2 & 3 inventory in the supply goods inventory $1,000,000 Retailer DC chain. The participant divided by the “value” Avg. daily sales = $75,000 Store decided how that inventory of average daily sales Inventory = 13.3 days is “valued” (e.g. cost of (calculated based on (1000000/75000) goods or sales value) and past 6 months uses that “value” in the history) of these numerator and products. denominator. On-shelf / Measure if the product is % Out of stock # Of items / SKUs OOS should be measured as on-shelf or point-of-sale. This 1 1 1 point-of-sale available when the not available divided frequently and as practically as KPI should be reported by availability consumer wants to buy it. by the number of capabilities allow (e.g. audits- Manufacturers (based on We will measure this KPI items / SKUs. preferably at peak times. Mkt. their knowledge of their at the point-of-sale only – Measurement data, statistical brand’s in-stock position) and as an out-of-stock rate. analysis) 6 items missing versus by retailers. 100 items expected = 6% Global Scorecard- ECR Europe Conf 2005 · Page
- 9. 11 Implementation Measures % of consumer units allocated GTIN % of cases / cartons / inners allocated GTIN % of pallets / unit loads labelled with SSCC % of item exceptions to GTIN allocation guidelines % of shipping or receiving locations that have been allocated a GLN % of orders transacted via EDI or XML and % of Invoices transacted via EDI or XML % of sales with synchronized Master Data between trading partners via standards compliant and GS-1 Certified data pools % of SKUs registered in the GlobalRegistry % of GTIN’ s that are catalogued consistent with Global Product Classification Standards For Retailers: % of checkouts that can scan an EAN 13 digit barcode For Retailers: % of checkouts that can scan Reduced Space Symbology (RSS) Global Scorecard- ECR Europe Conf 2005 · Page
- 10. 1. What is it I want to deliver ? Key Performance Indicators Implementation Measures 2. What capabilities do I need to deliver it? a nd B est onc epts orec ard C Sc Prac tices Global Scorecard- ECR Europe Conf 2005 · Page
- 11. 3. How developed are those capabilities within my situation? Progress vs. criteria / benchmarking Entry – Are you ready to work collaboratively? Do you have the basic Supply Chain Infrastructure in place? INTERMEDIATE FULL • Majority of Joint scorecards • Current tool • Time, resource constrained • Best tool for internal • non-strategic business / relationship company assessment • 80/20 approach • used jointly in strategic relationships Global Scorecard- ECR Europe Conf 2005 · Page
- 12. Scorecard – Progress Seamless link Completing the Family from Entry through Pioneering Full Intermediate (1999) Deep dive to Global Improving Intermediate Cascade down (2002) Achieving Cascade down Entry (2001) Key Performance Indicators (2001) Global Scorecard- ECR Europe Conf 2005 · Page
- 13. 3. How developed are those capabilities within my situation? 4. How do I improve those capabilities? e.g. link to VICS CPFR site www.cpfr.org Global Scorecard- ECR Europe Conf 2005 · Page
- 14. 2002 also saw the introduction of the GCI Compliance Scorecard: A shortcut to 3 sections of the Industry tool to measure quantifiable results of implementation of EAN*UCC Standards and GCI endorsed business Processes, Global Scorecard- ECR Europe Conf 2005 · Page
- 15. GCI Compliance Scorecard Section 1: Captures The Qualitative Measures for Standards Implementation – CAPABILITY Section 2: Captures the Quantitative Measures for KPIs Section 3:Captures the Quantitative measurement for Standards Implementation Key Performance Indicators Compliance Scorecard Global Scorecard- ECR Europe Conf 2005 · Page
- 16. Scorecard Usage continues to grow… Value being delivered and recognized 3500 3000 2500 KPIs Full 2000 Intermediate 1500 Entry Compliance 1000 500 0 1999 2000 2001 2002 2003 2004 Global Scorecard- ECR Europe Conf 2005 · Page
- 17. Which Scorecard Should I Use? Compliance Companies 400 - Internal Readiness KPIs -Management Committees 686 Country GS-1 & ECR Efforts - To Drive Standards Entry Implementation 500 - To set work plan priorities Trading Partners - Just Starting to Collaborate Intermediate - Driving for Alignment 125 - Strategic Relations Global Scorecard- ECR Europe Conf 2005 · Page
- 18. Let’s start off by understanding the WHAT The Quantifiable Key Performance Indicators and Implementation Measures of ECR Key Performance Indicators Compliance Scorecard Global Scorecard- ECR Europe Conf 2005 · Page
- 19. Click Here Global Scorecard- ECR Europe Conf 2005 · Page
- 20. The Scorecard looks like this….. Qualitative Assessment of Capabilities (not going to spend much time here) Quantitative Assessment of 88 Resultant Key 96 Performance 95 Indicators 22 Global Scorecard- ECR Europe Conf 2005 · Page 32
- 21. 97 94 Quantitative 7 Assessment of the 89 Implementation GS-1 Standards and 92 Business Processes 5 50 75 70 8 40 Global Scorecard- ECR Europe Conf 2005 · Page
- 22. Global Commerce Initiative Compliance Scorecard 2004 Benchmark Results July – Sept. Complete Scorecards Spring Board Meeting Review Improvement Plans & Fall Board Meeting Launch next year cycle Review Results and Progress Winter / Spring Case Studies & Improvement Plans Global Scorecard- ECR Europe Conf 2005 · Page
- 23. So How Did We Do? PARTICIPATION 2002 2003 2004 # of Scorecards 159 183 326 (+78%) • Growth of Participation • Was driven by Companies # of Companiestheir geographic Broadening 56 60 71 (+18%) representation • To be a better measurement tool, we need to reach out to more Countries companies. NA 25 20 45 (+130%) EMEA 85 110 185 (+68%) LA 25 25 29 (+16%) Asia 25 25 67 (+168%) Global Scorecard- ECR Europe Conf 2005 · Page
- 24. There are 11 Implementation Measures The first 4 are focused on the use of GTINS, or barcodes at various stages in the supply chain. And 9 Key Performance Indicators Global Scorecard- ECR Europe Conf 2005 · Page
- 25. What is a GTIN ? The Global Trade Item Number is a globally unique number to identify trade items, and is therefore the foundation for Global e-commerce. “Umbrella" term used to describe the entire family of EAN/UCC codes, including EAN/UCC-8, UCC-12 (UPC), EAN/UCC-13, and EAN/UCC/DUN-14. Global Scorecard- ECR Europe Conf 2005 · Page
- 26. Product & Shipment Identification – GTIN at Consumer Unit Level Discussion – Why Not 100%? Use of EAN/UCC 14 digit Global Trade Identification Number (GTIN) at the consumer item level including (1) the ability to store and process 14 digit numbers in your interface with your trading partners, (2) the ability of all point-of-sale systems in your company if you have them to scan EAN*UCC-13, UPC-12 and Simple Weighted EAN*UCC-8 barcode symbols and (3) application of automatic data capture (ADC) for bar-coding scanning and/or radio frequency applications (RFID). Because there are items transacted that do not have barcodes today (flowers, bulk, fresh) Full Total 92.4% 92.2% Implementation These items require RSS technology NA 86.3% 90.4% Roll-out Started EMEA 94.4% 98.3% Pilots Started LA 100% 100% Plans Agreed Asia 84.2% 76.3% European Analysis- GTIN at Consumer Unit Level # of Records Business Type Cum. $US Value Wtd. Result Nothing Planned 90 Manufacturers $58.4Billion 97.9% of Units allocated a GTIN 28 C&C / Retailers / Wholesalers $76.7Billion 98.6% of Units allocated a GTIN 118 All $138.1Billion 98.3% of Units allocated a GTIN Global Scorecard- ECR Europe Conf 2005 · Page
- 27. Product & Shipment Identification – GTIN at Trade (Case, Carton) Unit Level Use of EAN/UCC system (14 digit Global Trade Identification Number (GTIN) at the Trade Unit Simple Weighted level (case, carton) and application of automatic data capture (ADC) for bar-coding scanning Discussion and/ or radio frequency applications (RFID). The largest GAP is the lack of GTINs application at the “Inner pack” level. Full It appears that the 89 responding manufacturers 86.5% job than is Implementation Total do a better 74.9% “averagely” seen by the retailer segment. Roll-out NA 84.7% 69.4% Started EMEA 88.3% 91.9% Pilots Started LA 99.9% 100% Plans Agreed Asia 79.8% 82.3% European Analysis- GTIN at Trade Unit Level # of Records Nothing Business Type Cum. $US Value Wtd. Result Planned 89 Manufacturers $57.5Billion 96.4% of Trade Units allocated a GTIN 27 C&C / Retailers / Wholesalers $82.2Billion 88.7% of Trade Units allocated a GTIN 116 All $139.7Billion 91.9% of Trade Units allocated a GTIN Global Scorecard- ECR Europe Conf 2005 · Page
- 28. Product & Shipment Identification (GTIN) Violations What % of items sold / received have exceptions to the Global Trade Identification Discussion. Number (GTIN) allocation guidelines?. It appears that far fewer companies are tracking / measuring data quality. (30% less records than most other measures) Simple Weighted Those that are measuring know they have errors that need to be fixed. Since “you manage what you measure” and since “data quality” is the root of Total 2.7% synchronization benefit – this should be a high priority. 3.0% NA 2.4% 3.5% EMEA 2.0% 1.1% LA 0.9% 2.9% European Analysis- % of items with Know GTIN Allocation Rules Violations # of Records Business Type Asia 5.1% Cum. $US Value 3.8% Wtd. Result 43 Manufacturers $42.2Billion 1.4% of items have know violations 26 C&C / Retailers / Wholesalers $74.3Billion 1.0% of items have know violations 69 All $116.6Billion 1.1% of items have know violations Global Scorecard- ECR Europe Conf 2005 · Page
- 29. Product Classification Standards Use of the EAN.UCC GPC (Global Product Classification) standards to classify and categorise products in the areas of forecasting, planning, searching, procurement, Simple Weighted category management and global data synchronization in the communication both Discussion. internally within the organizations and between trading partners.. Product Classification Standards new in Mid-2004 Full Implementation Fast Moving Consumer Goods including Food, Beverage, Tobacco completed Total 17.0% 10.0% 4 first. Manufacturers just starting to implement. Gen. Merchandise, DIY, Hardlines, Apparel to follow Roll-out Started NA 25.6% 9.9% 3 Retailers need multiple categories available to use the capability This critical mass of categories should be available now. Pilots Started EMEA 16.8% 10.1% 2 1.7 1.2 LA 1.1 15.8% 1.2 5.0% Plans 1.0 Agreed 1 Asia 18.8% 11.0% European Analysis- GTINs catalogued consistently with GPC Standards # of Records Business Type Cum. $US Value Wtd. Result Nothing Planned 0 96 Manufacturers NA EMEA LA $65.6Billion Asia 17.6% Total consistent with GPC Standards 6 C&C / Retailers / Wholesalers $48.6Billion 0.0% consistent with GPC Standards 102 All Global Scorecard- ECR Europe Conf 2005 · Page 2004 $114.2Billion 10.1% consistent with GPC Standards
- 30. Global Data Synchronization The establishment, loading, registering and synchronizing of item and party data based on EAN.UCC standards (GDS Network) Discussion. Simple Weighted Results are probably overstated relative to new “certified” measure versus simply “standards compliant” Full GDSN Roadmap / GlobalRegistry now in place. Results should grow. Implementation Total 16.3% Sinfos, WWRE, Transora, GXS, GS-1UK Data Pool, UCCNet (and 4 other) Data 12.2% Pools now “Certified” Roll-out StartedThe “work” is to get non-certified data pools “certified” or move to a certified data NA 16.6% 9.9% pool. Only 11 (versus average 28) retailers responded to this measure. Pilots Started EMEA 18.7% 20.8% LA 10.6% 4.6% Plans Agreed Asia 8.7% 3.0% European Analysis- % Sales Synchronized via Standards Compliant Data Pool Note: in 2005, measure will be adjusted to read “GS-1 Certified Data Pool” Nothing PlannedRecords # of Business Type Cum. $US Value Wtd. Result 97 Manufacturers $66.7Billion 21.2% of sales synchronized 11 C&C / Retailers / Wholesalers $65.4Billion 20.4% of sales synchronized 108 All $132.1Billion 20.8% of sales synchronized Global Scorecard- ECR Europe Conf 2005 · Page
- 31. Use of Electronic Message Capability % of Orders % of Invoices Use of standard electronic messages to support the product replenishment process Discussion. between trading partners. These include orders, advanced shipment notices (or Simple Weighted Simple Weighted despatch advice), receiving advice and invoices. remains anshould be transmitted using Electronic Messaging for orders and invoices Messages underutilized capability in Europe. EDI via EANCOM, web-EDI or XML standard formats. In this case, it appears that the 52.5% Total participating86.9% make 44.8% of 82.8% retailers more use the capability than retailers “averagely” seen by suppliers. Full Implementation NA 73.0% 94.6% 65.7% 91.2% 4 3.3 3.2 EMEA 56.3% 71.7% 51.6% 66.1% Roll-out Started 3.1 3 2.7 2.9 2.8 2.7 2.8 LA 2.4 2.4 2.3 2.4 2.5 29.0% 41.5% 39.4% 35.8% 2.2 Pilots Started 2.0 2 European Analysis- % of44.2% Invoices transacted via EDI or XML35.1% Asia Orders & 48.7% 28.4% # of Records Business Type Cum. $US Value Wtd. Result Plans Agreed 1021 Manufacturers $70.7Billion 62.2% of orders EDI or XML 99 $67.8Billion 57.6 % of invoices EDI or XML 29 0 C&C / Retailers / Wholesalers $85.4Billion 79.6% of orders EDI or XML Nothing Planned 72.9% of invoices EDI or XML NA All EMEA LA Asia Total 131 $156.2Billion 71.1% of orders EDI or XML 128 $153.2Billion 66.1% of invoices EDI or XML 2002 2003 Global Scorecard- ECR Europe Conf 2005 · Page
- 32. Pam Stegeman Vice President, Supply Chain and Technology Grocery Manufacturers of America Global Scorecard- ECR Europe Conf 2005 · Page
- 33. GMA’s Work in Supply Chain Mission: To assist in creating efficient, effective supply chain Tools: ECR principles, GS1 Global Standards Current Focus: GTINs, GLNs Global Data Synchronization Need: Measurement tool Global Scorecard- ECR Europe Conf 2005 · Page
- 34. GMA’s Use of GCI Scorecard GMA and North American Manufacturers have been working on GTIN implementation and GDS for past 5+ years High level support within companies Strong desire to track progress Set North American goals in 2004 Too many industry surveys, but nothing tracking standards compliance Global Scorecard- ECR Europe Conf 2005 · Page
- 35. GMA’s Progress on GCI Scorecard North American Company Presidents (IAC) took lead to use existing scorecard to measure progress Results: 2003 20 2004 45 (+130%) Now, IAC companies are completing scorecards on same cycle as GCI Board Global Scorecard- ECR Europe Conf 2005 · Page
- 36. North American Goals, Timelines, and Measures Implementation Measures 2004 Goal Timeframe Benchmark % of consumer units allocated GTIN 90.1 95 Jan 2008 Requires RSS % of cases/cartons/inners allocated a GTIN 69.4 80 Jan 2007 Gap is “inners” % of pallet/unit loads labeled w/ SSCC 74.0 80 Jan 2007 % of item exceptions to GTIN allocation guidelines 3.5 <1 Jan 2006 All about clean data % of shipping or receiving locations that have been 62.8 80 Jan 2007 allocated a GLN Move from Duns to GLN Global Scorecard- ECR Europe Conf 2005 · Page
- 37. North American Goals, Timelines, and Measures Implementation Measures 2004 Goal Timeframe Benchmark % of orders transacted via EDI or XML 94.6 85 Goal Achieved % of invoices transacted via EDI or XML 91.2 85 Goal Achieved % of sales with synchronized master data between 9.9 50 Jan 2007 trading partners via standards compliant data pools 20% in 05 50% in 06 % of GTINS catalogued consistently w/ Global 9.9 50 Jan 2007 Classification Standards Global Scorecard- ECR Europe Conf 2005 · Page
- 38. GMA’s Use of GCI Scorecard Results used by GMA and other industry groups to determine where more work and education is needed More education and business case studies on GDS Education/communication of GTIN Allocation Guidelines Information on Global Product Classification Push GLNs Global Scorecard- ECR Europe Conf 2005 · Page
- 39. 2005 Plan to Drive Engagement Goal: 15%+ increase in number of manufacturers completing scorecard Plan: Present updates at each IAC meeting Present to other GMA Committees and conferences Use output as GMA Benchmarks on Standards implementation in U.S. Global Scorecard- ECR Europe Conf 2005 · Page
- 40. Is ECR dead in the U.S.? Absolutely NOT!!! U.S. FMCG and Retail industries have similar work plans to ECR Europe We may not have a formal ECR venue, but the work, the attitude, and the collaborative spirit is alive and well Global Scorecard- ECR Europe Conf 2005 · Page
- 41. A Quick Look at Key Performance Indicators Global Scorecard- ECR Europe Conf 2005 · Page
- 42. 2003 2002 Simple Simple Average Sample total 2004 Average revenue Sample Criterion – EUROPE Totals Units US$m # Records Weighted Avg Key Performance Indicators Service Level / Unit Fill Rate % 132401 87 95.2 96.9 96.1 On-Time Delivery % 128720 80 90.6 88.4 93.4 Manufacturer/Supplier's Finished Goods days 43605 55 39.2 39.2 42.3 Inventory Cover Retail Distribution Centre Inventory Cover days 98083 41 19.1 19.1 15.7 Retail Store Inventory Cover days 68219 35 37.9 14.4 17.0 On-Shelf/Point-of-Sale Out-of-Stocks % 76469 48 5.1 4.0 4.3 Lead Time hours 124601 82 61.7 37.1 48.3 Distribution Costs (% of sales value) % 123743 69 4.0 3.6 4.3 Invoice Accuracy - Master Data % 84613 52 94.9 96.4 91.3 Invoice Accuracy % 98055 75 86.3 91.7 88.4 Global Scorecard- ECR Europe Conf 2005 · Page
- 43. Criterion – EUROPE MANUFACTURERS Sample Weighted Sample total revenue Key Performance Indicators Units Avg US$m # Records Service Level / Unit Fill Rate % 98.5 47005 58 On-Time Delivery % 96.3 43324 51 Manufacturer/Supplier's Finished Goods Inventory Cover days 39.2 43605 55 Retail Distribution Centre Inventory Cover days 22.0 17468 18 Retail Store Inventory Cover days 6.7 7823 7 On-Shelf/Point-of-Sale Out-of-Stocks % 5.9 31751 26 Lead Time hours 60.4 39205 53 Distribution Costs (% of sales value) % 5.1 40856 44 Invoice Accuracy - Master Data % 98.6 29160 27 Invoice Accuracy % 92.6 38083 48 Criterion EUROPE C&C / RETAILERS / WHOLESALERS Sample Weighted Sample total revenue Key Performance Indicators Units Avg US$m # Records Service Level / Unit Fill Rate % 93.4 85396 29 On-Time Delivery % 87.7 85396 29 Retail Distribution Centre Inventory Cover days 18.5 80615 23 Retail Store Inventory Cover days 41.9 60396 28 On-Shelf/Point-of-Sale Out-of-Stocks % 4.5 44718 22 Lead Time hours 62.4 85396 29 Distribution Costs (% of sales value) % 3.5 82887 25 Invoice Accuracy - Master Data % 92.9 55453 25 Invoice Accuracy Scorecard- ECR Europe Conf 2005 · Page % Global 82.3 59972 27
- 44. Key Performance Indicators and Implementation Measures Global Scorecard- ECR Europe Conf 2005 · Page
- 45. We now have Benchmark Data to Establish GLOBAL Goals, Timelines and Measure Real Progress Implementation Measures 2004 Timeframe Goal Benchmark % of consumer units allocated GTIN % 92.2 95 Jan 2008 Requires RSS % of cases/cartons/inners allocated a GTIN % 74.9 95 Jan 2007 Gap is “inners” % of pallets/unit loads labeled with SSCC % 65.7 80 Jan 2007 % of item exceptions to GTIN allocation guidelines % 3.0 < 1 Jan 2006 This is all about clean data % of shipping or receiving locations that have been allocated % a GLN 66.0 80 Jan 2007 Requires GLN allocation rules % of orders transacted via EDI or XML % 86.9 85 Jan 2005 % of invoices transacted via EDI or XML % 82.8 85 Jan 2006 % of sales with synchronized master data between trading % partners via standards compliant data pools 12.2 50 Jan 2007 From 13 – 26 in 05, 26 – 50 in 06 % of GTINs that are catalogued consistently with Global % Product Classification Standards 10.0 80 Jan 2007 % of checkouts that can scan a 13 digit barcode % 99.9 99 Jan 2005 % of checkouts that can scan Reduced Space Symbology % (RSS) 6.3 99 Jan 2008 Global Scorecard- ECR Europe Conf 2005 · Page
- 46. What Goals, Timelines and Measures Will You Set for your Company / Country / Business unit? Implementation Measures WW 2004 WW Europe 2004 Benchmark Goal Benchmark Europe goal % of consumer units allocated GTIN % 92.2 95 (1/08) 98.3 % of cases/cartons/inners allocated a GTIN % 74.9 95 (1/07) 91.3 % of pallets/unit loads labeled with SSCC % 65.7 80 39.8 (1/07) % of item exceptions to GTIN allocation guidelines % 3.0 <1 1.1 (1/06) % of shipping or receiving locations that have been % 66.0 80 82.1 allocated a GLN (1/07) % of orders transacted via EDI or XML % 86.9 85 71.7 (1/05) % of invoices transacted via EDI or XML % 82.8 85 66.1 (1/06) % of sales with synchronized master data between trading partners % 12.2 50 20.8 via standards compliant data pools (1/07) % of GTINs that are catalogued consistently with Global Product % 10.0 80 10.1 Classification Standards (1.07) % of checkouts that can scan a 13 digit barcode % 99.9 99 100.0 % of checkouts that can scan Reduced Space Symbology (RSS) % 6.3 99 ** (1/08) Global Scorecard- ECR Europe Conf 2005 · Page
- 47. The same can be done with the Key Performance Indicators Key Performance Indicators - Benchmark Results Sample Sample total My Weighted Criterion Units Weighted Avg revenue US$m # Records Avg My Goal Key Performance Indicators Service Level / Unit Fill Rate % 95.2 132401 87 99.7 On-Time Delivery % 90.6 128720 80 96.4 Manufacturer/Supplier's Finished Goods Inventory Cover days 39.2 43605 55 37.3 Retail Distribution Centre Inventory Cover days 19.1 98083 41 23.2 Retail Store Inventory Cover days 37.9 68219 35 30.0 On-Shelf/Point-of-Sale Out-of-Stocks % 4.1 76469 48 6.2 <4% Lead Time hours 41.8 124601 82 58.8 48 Distribution Costs (% of sales value) % 4.0 123743 69 5.0 Invoice Accuracy - Master Data % 95.1 83513 51 98.1 Invoice Accuracy % 86.5 98055 75 96.1 1. Performance Gaps can be identified 2. Objectives can be set Global Scorecard- ECR Europe Conf 2005 · Page
- 48. And now we can use the Global Scorecard to Identify HOW to improve those results Rita Marzian Title: Metro Stores Global Scorecard- ECR Europe Conf 2005 · Page
- 49. Now That We Know WHAT Performance Measures Need to Improve We Need to Understand HOW To Improve Them - The Best Practices Lets start with a look at the demand side…… Global Scorecard- ECR Europe Conf 2005 · Page
- 50. Global Scorecard- ECR Europe Conf 2005 · Page
- 51. Collaborative Shopper Value Creation 1. Collaborative Information Management Panel Retailer Services Market Research Company POS DATA Capture and share Consumer- and Shopper- Data needed for joint Value Qualitative creation Shopper Data research Consumer supplier 2 research Research Agency Supplier 1 Global Scorecard- ECR Europe Conf 2005 · Page
- 52. Collaborative Shopper Value Creation 2. Shopper Targeting Global Scorecard- ECR Europe Conf 2005 · Page
- 53. Collaborative Shopper Value Creation – Differentiated Solutions Global Scorecard- ECR Europe Conf 2005 · Page
- 54. Collaborative Shopper Value Creation – Differentiated Solutions Shopper loyalty Relationship based management solutions Category / brand Integrated value management solutions Global Scorecard- ECR Europe Conf 2005 · Page
- 55. Supply Scorecard Martin White Global Scorecard- ECR Europe Conf 2005 · Page
- 56. Supply Management Focus of expansion Reliable operations is an increasingly relevant theme in a fast changing business environment Global Scorecard- ECR Europe Conf 2005 · Page
- 57. Operational Excellence We have enhanced the concept definition and the definition of best practices today Concept it is about continuous improvement strategies and techniques a focus on minimising service and quality defects e.g.out of stocks Definitions store operations reflects emphasis to the shelf need for compliance drive to improve shopper availability distribution reflects increased use of track and trace production reflects practices of synchronisation and lot traceability Global Scorecard- ECR Europe Conf 2005 · Page
- 58. Operational Excellence But the main focus is on two best practices (1)Reliable stockloss and shrinkage management From nothing planned – 0 there is limited awareness of the problem. There are no plans Stock loss is not measured and to alter stock loss measurement processes, to share information or to take individual or joint proactive measures to reduce stock loss To fully implemented - 4 Stock loss is tackled as a part of corporate policy, in a proactive manner. Within the organisation there is a dedicated department for handling stock loss. The problem is measured and analysed on a regular basis. A systematic plan to tackle shrinkage, both individually and collaboratively, is in place, which is acted upon and regularly reviewed. Optimisation of shopper satisfaction achieved through integrating markdown and loss management with product availability Applicable to known and unknown stockloss Reflects practices from the ecr shrinkage group Global Scorecard- ECR Europe Conf 2005 · Page
- 59. Operational Excellence (2)Reliable on–shelf availability management From nothing planned - issue partners have no plans to tackle on-shelf availability, Out-of-stock rate not known. Trading because it is not seen as an 0 To fully implemented - 4 OSA is an integrated business process. Continuous measurement with automatic and alert based data capture, regular root cause analysis and continuous actions based on consumer value creation strategies is undertaken Reflects the need to balance availability with a cost to serve and the customer reaction Best practice is a continuous real time process, fully linked to consumer value creation – but is independent of the technologies required to do this Global Scorecard- ECR Europe Conf 2005 · Page
- 60. Enabler Changes Chris Cave Jones IBM Global Scorecard- ECR Europe Conf 2005 · Page
- 61. Enabler Changes Global Scorecard- ECR Europe Conf 2005 · Page
- 62. Use of product classification standards The EAN.UCC Global Product Classification (GPC) standards allow products to be grouped into a standard hierarchy. The business objectives of the standard are: To support buying programmes by allowing buyers to pre-select groups of applicable products. To provide a common language for category analysis, thus speeding up the ability to react to consumer needs. To be a key enabler of the data synchronisation process Global Scorecard- ECR Europe Conf 2005 · Page
- 63. Electronic messages for supply Advanced Shipment Notice Receipt Advice Or Despatch note Order Invoice Manufacturer Retailer Global Scorecard- ECR Europe Conf 2005 · Page
- 64. Electronic messages for CPFR Sales History Inventory Manufacturer Retailer Forecast Global Scorecard- ECR Europe Conf 2005 · Page
- 65. Electronic messages for data synchronisation GTINs plus all mandatory attributes GLNs plus all mandatory attributes Messages exchanged between users and datapools, between data pools, with the single item registry, between trading partners Global Scorecard- ECR Europe Conf 2005 · Page
- 66. Global Data Synchronisation Registry 3. The registry holds this basic information about all items and the location of each items’ source data pool. Manufacturer Data 2. The data pool sends very 4. A retailer will search the registry, via a selected data pool, Pool basic information about the for an item (by GTIN or by item to the Global Registry. description). The registry returns the details of the items to the data pool. 1. A manufacturer will Data publish item information to the Pool source data pool. 5. The trading partners synchronise the item information between their respective data Retailer pools. This model supports a rich network of data pools. Global Scorecard- ECR Europe Conf 2005 · Page
- 67. Electronic Product Code Global Scorecard- ECR Europe Conf 2005 · Page
- 68. How the EPC network automates the supply chain Global Scorecard- ECR Europe Conf 2005 · Page
- 69. Web site demonstration Chris Cave Jones Associate Partner IBM Business Consulting Services Global Scorecard- ECR Europe Conf 2005 · Page
- 70. Select your language Site fully translated Full site translation in progress Some elements translated Getting Started Global Scorecard- ECR Europe Conf 2005 · Page
- 71. Introductory material on • ECR • Key Performance Indicators • The different levels of scorecard • How to use the scorecard collaboratively with a trading partner • How to do benchmarking • How to customise your scorecards and KPIs Global Scorecard- ECR Europe Conf 2005 · Page
- 72. Guide to ECR Improvement Concepts Click on the name any of the improvement concepts to find out more about it. Global Scorecard- ECR Europe Conf 2005 · Page
- 73. Scr oll D Global Scorecard- ECR Europe Conf 2005 · Page o
- 74. Additional resources section with links to related sites or other downloadable material Global Scorecard- ECR Europe Conf 2005 · Page
- 75. Data synchronisation movie Global Scorecard- ECR Europe Conf 2005 · Page
- 76. Use Key Performance Indicators “the What” Global Scorecard- ECR Europe Conf 2005 · Page
- 77. Insert new KPI record Global Scorecard- ECR Europe Conf 2005 · Page
- 78. First enter your profile data so your KPIs can be correctly registered Enter your annual revenue so that the weighted average can be calculated New feature to allow data to be entered for a single country or a region Global Scorecard- ECR Europe Conf 2005 · Page
- 79. Next enter your KPI values Click on the KPI name if you want to see the definition S c Global Scorecard- ECR Europe Conf 2005 · Page r
- 80. Here is where you enter your Implementation Measures Optional KPIs for those who want a wider range of benchmarking measures S c Global Scorecard- ECR Europe Conf 2005 · Page r
- 81. Click the “Save” button once you have finished entering your data Global Scorecard- ECR Europe Conf 2005 · Page
- 82. KPIs must be submitted for error checking before they can be benchmarked Global Scorecard- ECR Europe Conf 2005 · Page
- 83. Next, we’ll use the capability scorecards Global Scorecard- ECR Europe Conf 2005 · Page
- 84. First, we’ll demonstrate the full global scorecard Global Scorecard- ECR Europe Conf 2005 · Page
- 85. You have to enter a scorecard before you can do benchmarking! Global Scorecard- ECR Europe Conf 2005 · Page
- 86. Enter your profile data, then click “Submit” Global Scorecard- ECR Europe Conf 2005 · Page
- 87. Enter your capability scores by clicking on the radio button …or click on the concept name to see the scorecard details Global Scorecard- ECR Europe Conf 2005 · Page
- 88. Enter your capability scores by clicking on the radio button Enter comments or justification for the score here Global Scorecard- ECR Europe Conf 2005 · Page
- 89. The GCI data entry short cut combines the Enablers section of the full scorecard with the KPIs and the Implementation Measures Global Scorecard- ECR Europe Conf 2005 · Page
- 90. Scr oll D Global Scorecard- ECR Europe Conf 2005 · Page o
- 91. Enter KPI values here then scroll down Global Scorecard- ECR Europe Conf 2005 · Page
- 92. Enter Implementation Measures, then when ready click “Submit” Global Scorecard- ECR Europe Conf 2005 · Page
- 93. I signed on to the KPI section using the P&G master user name I will now demonstrate how to benchmark KPIs Global Scorecard- ECR Europe Conf 2005 · Page
- 94. The P&G Master User can see all the KPI records submitted by each of his subsidiary users as well as his own KPI records. He can select which records he wants to include in the benchmarking report Global Scorecard- ECR Europe Conf 2005 · Page
- 95. I selected to benchmark against European KPI values For manufacturers And to display the results in a table Global Scorecard- ECR Europe Conf 2005 · Page
- 96. Global Scorecard- ECR Europe Conf 2005 · Page
- 97. I could have chosen to display the results in a set of distribution charts Similar charts can be produced for ECR Capability scores Global Scorecard- ECR Europe Conf 2005 · Page
- 98. I will now demonstrate how to use the Entry Level Scorecard Collaboratively with a trading partner Global Scorecard- ECR Europe Conf 2005 · Page
- 99. Enter a new joint scorecard Global Scorecard- ECR Europe Conf 2005 · Page
- 100. You have to know the master user name of your trading partner. Ask them if you don’t know Global Scorecard- ECR Europe Conf 2005 · Page
- 101. Enter your profile data and then select who you want to work with at your trading partner Global Scorecard- ECR Europe Conf 2005 · Page
- 102. Global Scorecard- ECR Europe Conf 2005 · Page
- 103. At the bottom, I enter my proposed actions I then click “Save” to save it as a draft. My trading partner can’t see the scorecard at this stage Global Scorecard- ECR Europe Conf 2005 · Page
- 104. After saving, I am returned to the view screen and can submit the scorecard to my trading partner when ready. My trading partner will get an automatic e-mail telling him that a scorecard has been submitted for his attention Global Scorecard- ECR Europe Conf 2005 · Page
- 105. My trading partner signs on, and then finds my scorecard in his “Available Scorecards” list. He clicks the “View” icon to see Global Scorecard- ECR Europe Conf 2005 · Page it.
- 106. He reviews my scores and comments He can either choose to accept them as is, or can edit them Global Scorecard- ECR Europe Conf 2005 · Page
- 107. At the bottom of the “Edit” screen the trading partner can enter his own comments End then clicks “Save” Global Scorecard- ECR Europe Conf 2005 · Page
- 108. Status changes to “Edited By Partner” Global Scorecard- ECR Europe Conf 2005 · Page
- 109. I can review the trading partner’s comments and the approve the scorecard or edit again. Global Scorecard- ECR Europe Conf 2005 · Page
- 110. Status changed to Joint Confirmed Global Scorecard- ECR Europe Conf 2005 · Page
- 111. Now we will demonstrate using the intermediate scorecard with a trading partner Global Scorecard- ECR Europe Conf 2005 · Page
- 112. The trading partner is selected, profile set up then scores and comments entered using the Intermediate Level Scorecard Global Scorecard- ECR Europe Conf 2005 · Page
- 113. Submit to trading partner when ready Global Scorecard- ECR Europe Conf 2005 · Page
- 114. My trading partner can see that I have created a scorecard, but cannot view it until I have submitted it. In the meantime he can start his own scorecard, by click in the “Respond” button. His scorecard will be linked to mine Global Scorecard- ECR Europe Conf 2005 · Page
- 115. He completes his Intermediate Scorecard and then clicks “Save” Global Scorecard- ECR Europe Conf 2005 · Page
- 116. Once both parties have submitted their scorecards, we are ready for the workshop. Once both parties are in the same room, we can start the workshop. Global Scorecard- ECR Europe Conf 2005 · Page
- 117. My score, comments and actions are shown here My trading partner’s score, comments and actions are shown here Our jointly agreed score, comments and actions are entered during the workshop Global Scorecard- ECR Europe Conf 2005 · Page
- 118. The Sainsbury Master User can monitor the state of all of the Intermediate Scorecards whether under progress or completed Global Scorecard- ECR Europe Conf 2005 · Page
- 119. Intermediate Scorecarding in Action Global Scorecard- ECR Europe Conf 2005 · Page
- 120. The last area is for the deeper KPI benchmarking systems Global Scorecard- ECR Europe Conf 2005 · Page
- 121. The Glosup programme allows retailers to carry out deeper benchmarking analysis Click here to apply to Templeton College, Oxford University, for membership of the programme A full set of downloads is available on the site APQC is an organisation which supports standardised in-depth benchmarking of business measures. Global Scorecard- ECR Europe Conf 2005 · Page
- 122. Global Scorecard- ECR Europe Conf 2005 · Page
- 123. Global Scorecard- ECR Europe Conf 2005 · Page
- 124. Global Scorecard- ECR Europe Conf 2005 · Page
- 125. www.globalscorecard.net Global Scorecard- ECR Europe Conf 2005 · Page
- 126. Case Studies 1. How ECR South Africa Used the Global Scorecard to Galvanize Action 2. How Metro is using the Global scorecard 3. P&G’s use of the Full Scorecard as a collaboration tool Global Scorecard- ECR Europe Conf 2005 · Page
- 127. South Africa – Scorecard in action August Iwański Chief Executive - CGCSA
- 128. 1st October 2002
- 129. Mission To enable retailers, wholesalers, manufacturers, logistics and service providers in the South African Consumer Packaged Goods industry to WORK TOGETHER to meet consumer needs better, faster, and at least cost.
- 130. Vision “A single voice, adding value”
- 132. Key activities Supply and Demand Chain efficiencies – under the banner of ECR Crime Prevention Programme Global Standards including data synchronisation and catalogue (PDC.za) Legal and Regulatory (non-competitive issues including Food Safety)
- 133. Objectives Best practice processes To develop and promote best practice processes for joint demand and supply management projects. EAN●UCC standards endorsed by GCI To support and disseminate the adoption of identification and communication standards i.e. the Enablers and Integrators (as agreed through EAN●UCC and endorsed by the GCI) which enhance inter-company logistics and increase efficiencies for trading partners.
- 134. Objectives (cont. 1) Industry research and education To improve market understanding of member companies through industry research and education. A voice for the industry To provide a voice for the industry to government and other key bodies on all relevant industry, legal & regulatory affairs.
- 135. Underlying principles Focus on the consumer A commitment to the belief that sustained business success stems only from providing consumers with products and services that consistently meet or surpass their demands and expectations. Working Together The greatest consumer value can be offered only when organisations work together, both internally and with their trading partners, to overcome barriers that erode efficiency and effectiveness.
- 136. South African FMCG Value Chain Analysis (VCA) First study commissioned in 1999 To determine the potential cost savings in the SA FMCG Industry 11 Manufacturers and 6 Wholesale / Retail participants Key Results • Manufacturers were ahead of retailers • R2.55 billion potential saving for consumers • R5.1 billion potential saving in a once off inventory reduction
- 137. South African FMCG Value Chain Analysis (VCA) cont. 1 In 2004 a new study was commissioned To measure progress of ECR implementation in the SA FMCG Industry To Identify opportunities for further improvement 22 Manufacturers & 6 Retailers/Wholesalers
- 138. VCA Project - Purpose Snapshot - Determine the degree of implementation, Trend - Identify whether there has been progress since the 1999 study Industry - Identify opportunities for industry initiatives to implement improvements Benchmark - Allow participating organizations to benchmark themselves against the SA FMCG industry, as well as run global benchmarks Action - Help participants identify opportunities and improvement potentials and specific action steps Trigger - Deliver a trigger for the SA industry to start talking TO rather than AT one another
- 139. Working together 22 Manufacturers, 6 Retailers National Brands
- 140. Sample Composition 22 Manufacturers, 6 Retailers/Wholesalers Participant Composition NB: Some participants have filled in more than one scorecard, as they scored for several categories.
- 141. Survey Findings – Key Performance Indicators The Supply Chain is neither lean nor efficient 17 days more inventory in the SA Supply Chain than the global Averages Case fill / service level is inadequate: • Averages On time delivery: Manufacturers 90.2% vs. retailers 87.3%, which means that 10-12% of deliveries are late Unnecessary frictions in order cycle & sorting out problems
- 142. Survey Findings – Key Performance Indicators (cont. 1) Retailer DCs seem to not yet have yielded the expected benefits Similar store inventory levels for DSD and DC replenished operations Supply Chain as a whole is not very responsive Long lead times / replenishment cycles, NDDs Average level out-of-stock on shelf is between 9 and 10% Supply Chain operates in a traditional push approach Despite pledges towards collaboration current business practices between retailers and manufacturers remain predominantly “push” and deal driven Performance measuring is not standardized or a regular practice The South African FMCG industry needs to operationally a standard set of performance measures which is continuously monitored, reviewed and acted upon
- 143. KPIs - Averages
- 144. 1999 – 2004 – 2007 (total ECR) 80% 70% 60% 50% Manufacturers 40% Retailers 30% 20% 10% 0% 1999 2004 2007 (target)
- 145. 1999 – 2004 – 2007 (total ECR) cont. 1 Since 1999 survey – ECR-SA implementation shows moderate progress. Retailers embracing ECR principles slightly more than manufacturers, both parties are virtually on par on overall ECR score. Participants have indicated that over the next three years they want to get from a piloting stage to the point where the roll out of ECR principles is starting to yield real benefits to the business.
- 149. 2005 Action Steps CGCSA Board agreed to focus on 4 projects identified from the VCA Analysis: 1. On Shelf Availability 2. Standardized Industry Key Performance Indicators 3. Category Management Methodologies 4. Training and Skills Development
- 150. Lessons Learned Understanding of the principles depicted on the scorecard is critical CEO Commitment essential Cross-functional team - directors and senior management attendance at the workshop is essential Choose the right partner/facilitator Adequate time is given for the completion of KPI’s Three workshops per company must be held
- 151. Lessons Learned (cont. 1) Enough time must be allocated after the workshops to re-visit participating companies to review data before presenting Do not compare against your local competitor – benchmark against global Less is more Regular feedback Conduct the survey at least every 4-5 years to monitor progress and keep top of mind
- 152. Finally, to conclude Just do it!
- 153. The end Thank you
- 154. Global Scorecard at the METRO Group Rita Marzian METRO Group Global Scorecard- ECR Europe Conf 2005 · Page
- 155. What it started with We have been doing ECR since the early 90‘s We have seen many successful projects Each project has it‘s individual KPI‘s Numerous projects have become daily processes However…. Global Scorecard- ECR Europe Conf 2005 · Page
- 156. What we did not really know: How are we doing in our distribution lines? How are we doing in our countries? Do we really do as good as we think we do? Where do we stand compared to the rest of the industry? Where can we still improve? What areas do we need to address first? Global Scorecard- ECR Europe Conf 2005 · Page
- 157. Where can we find the answers? Global Scorecard- ECR Europe Conf 2005 · Page
- 158. That is what we did Identify ‘Scorecard Ambassadors‘ in the various distribution lines Train people on using the Global Scorecard Evaluate process maturity for demand, supply and integrators Collect KPI‘s and Implementation Measures Fill in the Full Global Scorecard for Germany Fill in the Compliance Scorecard for all our countries Global Scorecard- ECR Europe Conf 2005 · Page
- 159. First Results Group wide we were equal to or above the average in most of the areas There are areas where we can do much better: Strengths and weaknesses differ by distribution line and country We need to push the application of enablers with our business partners!!! Global Scorecard- ECR Europe Conf 2005 · Page
- 160. Current Status Roll-Out of compliance scorecard under way to all our countries across all distribution lines Setting targets for implementation Develop plans to implement the missing pieces / drive implementation further Global Scorecard- ECR Europe Conf 2005 · Page
- 161. Time Permitting Retailer Scorecard Use The Sainsbury’s Journey Global Scorecard- ECR Europe Conf 2005 · Page
- 162. Sainsbury’s have been using the scorecard over many years Full global 20 suppliers Intermediate 200 suppliers Entry 2000 suppliers The process has been integral to delivering sustained collaborative improvements Global Scorecard- ECR Europe Conf 2005 · Page
- 163. Over the years many lessons have been learnt Senior level guidance, but user driven Focus on process and getting people going, not the quality of the scores and output Overcome the fear factor The benefit from each scorecard is different Each relationship is unique Global Scorecard- ECR Europe Conf 2005 · Page
- 164. Over the years many lessons have been learnt The process works, but individuals will adapt the process in a way that works for them Set targets, then manage, monitor and appraise Creating “champions” encouraged healthy competition and enthusiasm Global Scorecard- ECR Europe Conf 2005 · Page
- 165. Improvements came in many different areas In 2003 for example we reported on: - produce supplier - depot service level improvement 1.8% - stock loss reduction 22% - pack at source saving 1.5m euros - wine supplier -50% reduction in supply chain inventory -10% improvement in forecast accuracy Global Scorecard- ECR Europe Conf 2005 · Page
- 166. With some suppliers this was a Collaboration over many years journey Collaboration Facilitation of journey Performance Review performance reviews CPM Benchmark Data Scorecard Report Management of Process Configuration CPS Process & Business Rules Alerting & Exceptions User Defined Alerts & Exceptions AR M Data Publishing Reporting of KPI’s PDS GCI Entry Scorecard Collaborative Scorecard Business Evaluation Global Scorecard- ECR Europe Conf 2005 · Page
- 167. Conclusions Over the course of the journey the Sainsbury’s team undertook: Over 1000 scorecards Over 2500 agreed, joint, actions The real power lies in local benchmarking and the development of improvement plans with your trading partner There is no excuse for not getting started Global Scorecard- ECR Europe Conf 2005 · Page
- 168. Time permitting Procter & Gamble Case Study Jim Flannery Procter & Gamble Global Scorecard- ECR Europe Conf 2005 · Page
- 169. Using the tool to improve Business Results A Practical Example of using the scorecard to get started Customer “A” / P&G Can we find Common Ground to drive Better Business Planning and Long Term Results? Global Scorecard- ECR Europe Conf 2005 · Page
- 170. So we got started.. These goals Strengths included Assessment & • Category Share Weakness targets • Inventory targets • Cycle Time • Data Key Performance synchronization Indicators Opportunities (Finding Common Ground) Global Scorecard- ECR Europe Conf 2005 · Page
- 171. So we got started.. Strengths • Execute Assessment & Weakness the Plans Joint Action Plans • Review Results Opportunities Prioritize (Finding Common Ground) Global Scorecard- ECR Europe Conf 2005 · Page
- 172. Review Results Customer’s Market Share objectives exceeded Category Management projects running Shelf technology Promotional Effectiveness Weeks inventory reduced (P&G stock on hand reduced by 2 weeks) # of orders reduced claims reduced from $120,000 to Nil !! Order / delivery cycle time reduced by 3 days Full Scorecard will be updated annually Global Scorecard- ECR Europe Conf 2005 · Page
- 173. Financial Results Customer / P&G sales up 9% (Ahead of P&G’s market growth & Retailer’s business) P&G “Cost of business” down 2% plus profits from added sales Customer’s “Cost of business” down 3%-3.5% Plus inventory savings & Cash flow improvement Bottom line profit improvements for both Customer and P&G Global Scorecard- ECR Europe Conf 2005 · Page
- 174. Global Scorecard results vs. Operational Indices 150 Year 3 140 Year 2 Year 4 130 NOS Volume Index Retailer's Gross Margin 120 P&G Profits Year 1 110 100 209 318 520 369 Global Scorecard- ECR Europe Conf 2005 · Page
- 175. Thank you www.gci-net.org/gs www.globalscorecard.net Global Scorecard- ECR Europe Conf 2005 · Page