Exam Questions on Basic Statistics
•Als DOCX, PDF herunterladen•
1 gefällt mir•230 views

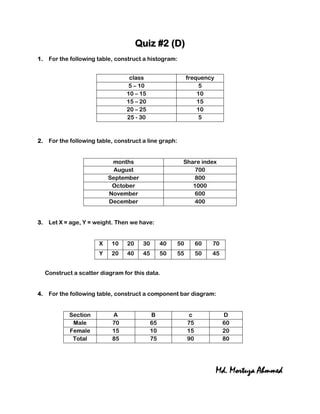
The document contains instructions for constructing different types of graphs and diagrams from numerical data provided in tables. It includes constructing a histogram from a frequency table, a line graph from a table of share indexes over months, a scatter diagram from a table of ages and weights, and a component bar diagram from a table of sections with male, female, and total values.

Empfohlen
Weitere ähnliche Inhalte
Andere mochten auch
Andere mochten auch (20)
Mehr von IUBAT
Mehr von IUBAT (20)
Kürzlich hochgeladen
Kürzlich hochgeladen (20)
Exam Questions on Basic Statistics
- 1. Quiz #2 (D) 1. For the following table, construct a histogram: class frequency 5 – 10 5 10 – 15 10 15 – 20 15 20 – 25 10 25 - 30 5 2. For the following table, construct a line graph: months Share index August 700 September 800 October 1000 November 600 December 400 3. Let X = age, Y = weight. Then we have: X 10 20 30 40 50 60 70 Y 20 40 45 50 55 50 45 Construct a scatter diagram for this data. 4. For the following table, construct a component bar diagram: Section A B c D Male 70 65 75 60 Female 15 10 15 20 Total 85 75 90 80 Md. Mortuza Ahmmed