

Empfohlen
Weitere ähnliche Inhalte
Mehr von IUBAT
Mehr von IUBAT (20)
Kürzlich hochgeladen
Kürzlich hochgeladen (20)
Exam Questions on Basic Statistics
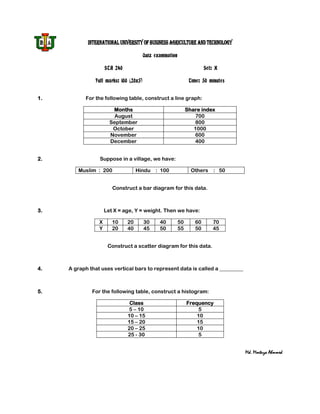
- 1. INTERNATIONAL UNIVERSITY OF BUSINESS AGRICULTURE AND TECHNOLOGY Quiz examination STA 240 Set: X Full marks: 100 (20x5) Time: 50 minutes 1. For the following table, construct a line graph: Months Share index August 700 September 800 October 1000 November 600 December 400 2. Suppose in a village, we have: Muslim : 200 Hindu : 100 Others : 50 Construct a bar diagram for this data. 3. Let X = age, Y = weight. Then we have: X 10 20 30 40 50 60 70 Y 20 40 45 50 55 50 45 Construct a scatter diagram for this data. 4. A graph that uses vertical bars to represent data is called a _________ 5. For the following table, construct a histogram: Class Frequency 5 – 10 5 10 – 15 10 15 – 20 15 20 – 25 10 25 - 30 5 Md. Mortuza Ahmmed