3. project time management
•
3 likes•2,187 views

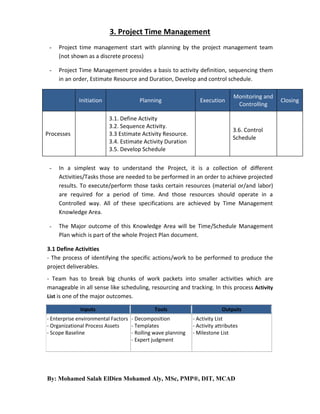
- Project time management start with planning by the project management team (not shown as a discrete process) - Project Time Management provides a basis to activity definition, sequencing them in an order, Estimate Resource and Duration, Develop and control schedule. Initiation Planning Execution Monitoring and Controlling Closing

Recommended
More Related Content
What's hot
What's hot (20)
Viewers also liked
Viewers also liked (16)
Similar to 3. project time management
Similar to 3. project time management (20)
More from Mohamed Salah Eldien Mohamed Ali
More from Mohamed Salah Eldien Mohamed Ali (12)
Recently uploaded
Recently uploaded (20)
3. project time management
- 1. 3. Project Time Management - Project time management start with planning by the project management team (not shown as a discrete process) - Project Time Management provides a basis to activity definition, sequencing them in an order, Estimate Resource and Duration, Develop and control schedule. Initiation Planning 3.1. Define Activity 3.2. Sequence Activity. 3.3 Estimate Activity Resource. 3.4. Estimate Activity Duration 3.5. Develop Schedule Processes Execution Monitoring and Controlling 3.6. Control Schedule - In a simplest way to understand the Project, it is a collection of different Activities/Tasks those are needed to be performed in an order to achieve projected results. To execute/perform those tasks certain resources (material or/and labor) are required for a period of time. And those resources should operate in a Controlled way. All of these specifications are achieved by Time Management Knowledge Area. - The Major outcome of this Knowledge Area will be Time/Schedule Management Plan which is part of the whole Project Plan document. 3.1 Define Activities - The process of identifying the specific actions/work to be performed to produce the project deliverables. - Team has to break big chunks of work packets into smaller activities which are manageable in all sense like scheduling, resourcing and tracking. In this process Activity List is one of the major outcomes. Inputs Tools - Enterprise environmental Factors - Decomposition - Organizational Process Assets - Templates - Scope Baseline - Rolling wave planning - Expert judgment Outputs - Activity List - Activity attributes - Milestone List By: Mohamed Salah ElDien Mohamed Aly, MSc, PMP®, DIT, MCAD Closing
- 2. - Tight Schedule is the foundation for well managed project. Schedule can be treated as a tool that identifies and organizes different required project tasks in a sequence and presented in the form of a Plan. Some benefits of Schedule Management: - It can be used as basis for monitoring, controlling and tracking. How to use resources effectively and in most efficient way Which activities are crucial to finish the project (Critical Path) To develop a proper schedule we need to breakdown bigger work packages of WBS (Work Breakdown structure) to Activities. Activities should be at such a smooth level where further breakdown is meaningless. Rolling Wave Planning: - - When we start breaking down the Work packages - of WBS - into Activities we might know details for few work packages. At that time we might leave those work packages as it is at higher level and plan accordingly. When we really come to execute those work packages then we can further break down into activity level. Estimating at higher level needs lot of "Expert Judgment" techniques. By another way, “Rolling Wave Planning” is a progressive elaboration planning where you do not plan activities until you start the project management process for that phase is in the project life cycle. Milestone List: - Milestones are significant intermediate touch points within project Phases against which management can check the Project performance. Project can't be tracked against single end point. 3.2 Sequence Activity - All Activities those defined and listed can't start at one time. Normally there will be dependencies between activities. One activity will occur after other activity. Putting activities on Activity List in a Sequence is major purpose of this process. This can be in tabular format by showing successors and predecessors (MS Project has this feature). More commonly it can be represented in pictorial format which is similar to "Flow Chart". Inputs - Project Scope Statement - Activity List - Activity Attributes - Milestone List - Organizational Process Assets Tools - Precedence Diagram Method - Schedule Network Templates - Dependency Determination - Applying leads and lags Outputs - Project schedule network diagram - Project document updates By: Mohamed Salah ElDien Mohamed Aly, MSc, PMP®, DIT, MCAD
- 3. Sequencing Terminology - - - Work items — activities, tasks, work packages, cost accounts, deliverables Defined completion criteria Takes time Consumes resources even if those resources are not charged to project Milestones — objectives, goals, checkpoints Has zero duration Consumes no resources Dependencies — relationships, constraints, restraints, logic Mandatory Dependencies (hard logic) Discretionary Dependencies (soft logic or preferred logic) External Dependencies. Dependency Determination - To define sequence among activity, these types of dependencies are used: 1. Mandatory (Finish to Start, or hard logic) Inherent in the nature of work being done or required by the contract E.g. you must design before you can develop 2. Discretionary (preferred, preferential, Start to Start, or soft logic) Defined based on knowledge Can be changed if needed Important when how to shorten or re-sequence the project Based on the need of a party outside the project 3. External - “Hard Dependencies” are mandatory to follow where “Soft Dependencies” are good to follow but they are not mandatory. By: Mohamed Salah ElDien Mohamed Aly, MSc, PMP®, DIT, MCAD
- 4. Displaying Activity Sequences 1. Activity on Node (AON) or Precedence Diagram Method (PDM): Nodes represent activities and draw arrows to show the dependencies. Precedence Diagram Method (PDM) ES = Early Start LS = Latest Start EF = Early Finish LF = Late Finish EF = ES + D -1 LS = LF – D +1 By: Mohamed Salah ElDien Mohamed Aly, MSc, PMP®, DIT, MCAD
- 5. Float (F) = LS – ES = LF – EF 2. Activity on Arrow (AOA) or Arrow Diagram Method (ADM): Nodes are transition points (Dependencies) and Arrows represents the activities. In those cases those nodes are given names and activities are treated as processes. Relationships in Precedence Diagrams Finish-to-start (FS); “the FROM activity must finish before the TO activity can start”. Start-to-start (SS); “the FROM activity must start before the TO activity can start”. Finish-to-finish (FF); “the FROM activity must finish before the TO activity can finish”. Start-to-finish (SF); “the FROM activity must start before the TO activity can finish”. Applying “Lag” and “Lead” Lag — Inserts waiting time between activities and hence, directs a delay in the successor. Lead —May be added to start an activity before the predecessor activity is complete. Allows acceleration of successor. Sequencing — Tips & Tricks; - Use only the lowest level items in the work breakdown structure. Network logic can always be drawn using FS dependencies only. By: Mohamed Salah ElDien Mohamed Aly, MSc, PMP®, DIT, MCAD
- 6. Other types of dependencies are used in scheduling to simplify the network logic as well as to constrain the software calculations Sequence closely related items first (create a subnet), then combine them. Remember that resources, dates, and durations come later. - 3.3 Estimate Activity Resource Process of estimating the type and quantities of material, people, equipment or supplies required to perform each activity. Inputs - Activity List - Activity Attributes - Resource Calendar - Enterprise Environmental factors (EEF) - Org. Process Assets (OPA) Tools - Alternatives Analysis - Published Estimating Data - Bottom-up Estimating - Project Management Software - Expert Judgment Outputs - Resource Breakdown Structure - Activity Resource Requirements - Project document updates Activity Resource Estimation: - By now you might have completed listing all activities in the projects and sequenced those. Now you have to identify what kind of resources is required to execute those activities those can be People, equipment, or material. The goal of this process is to generate Activity Resource Requirement. We are not yet ready for effort estimation yet. In this process we are identifying only required resources. Bottom-up Estimating - This technique is used in various processes in different contexts. Here, if we are using this to identify what kind of resources are needed at Activity level so that similar kind of activities can be assigned to same resource. So when you ask for cross team resources you can tell exact number or quantity. Resource Breakdown Structure (RBS): - This is another hierarchy structure used for projects. It helps you to group similar resources at a place that way you can build specialty teams with in project. It defines assignable resources such as personnel, from a functional point of view; it identifies "who" is doing the work. The total resources define the Top Level, By: Mohamed Salah ElDien Mohamed Aly, MSc, PMP®, DIT, MCAD
- 7. and each subsequent level is a subset of the resource category (or level) above it. Each descending (lower) level represents an increasingly detailed description of the resource until small enough to be used in conjunction with the Work Inputs - Project Scope Statement - Activity List - Activity Attributes - Activity Resource Requirements - Resource Calendar - Enterprise Environmental Factors - Org. Process Assets Tools - Analogous Estimating - Parametric Estimating - Three-point Estimating - Reserve Analysis - Expert Judgment Outputs - Activity Duration Estimates - Project documents updates Breakdown Structure (WBS) to allow the work to be planned, monitored and controlled. 3.4 Estimate Activity Duration - This is the Process of approximating the number of work periods to complete individual activities with estimated resources. - Schedule shall be as believable and realistic as possible. - The main goal for “Activity Duration Estimating” process is to provide effort estimation for all activities developed in during Activity Definition Process. Also know as Effort estimation, means how many hours/days are required to complete an activity. Duration is totally different than the work effort. Effort: Just effort to complete an activity. We will not consider how many resources are working on this activity or when they are start or when they finish. Duration: The effort which was estimated above can be split among several resources or span across multiple days. For example, the effort for an activity is estimated as 24 hours. This is typically 3 working 8 hour days. If you assign 3 resources to perform this activity the duration will be just 1 day. Or you assign only one resource and estimate 1 hour work per day then the duration would be 24 business days which might even longer calendar days considering weekends and holidays. Defining some of the “Tools & Techniques” used; By: Mohamed Salah ElDien Mohamed Aly, MSc, PMP®, DIT, MCAD
- 8. Analogous Estimating: - Comparing to similar activity on the other project is the concept of this technique. This particular technique requires historical data to compare. In cases where there is no historical data, you would rely on other techniques and can’t perform Analogous Estimating Parametric Estimating: Dependent on various parameters used for an activity. Multiplication of base unit of a parameter times of parameter size would give effort. For example 100 lines of code can be developed in 8 hours; then to develop 1000 lines of code it will take 80 hours. And if you need this in a week’s duration you will assign 2 resources. - Use statistical relationship between historical data and other variables (e.g. learning curve) - The result can become heuristics (experience based technique/rule of thumb) - Three-point estimation: - Also called Program Evaluation and Review technique (PERT) - This approach takes pessimistic, optimistic, and realistic estimates for an activity. This approach can produce most close estimate than single Expert Judgment estimate. Normally average of these 3 estimates and Standard deviation are used. - It is usually used for “Time” and “Cost” estimation. - Range of estimate = EAD (Expected Activity Duration) +/- SD (Standard Deviation). By: Mohamed Salah ElDien Mohamed Aly, MSc, PMP®, DIT, MCAD
- 9. - In statistics, the 68-95-99.7 rule, or three-sigma rule, or empirical rule, states that for a normal distribution, nearly all values lie within 3 standard deviations of the mean. About 68.27% of the values lie within 1 standard deviation of the mean. Similarly, about 95.45% of the values lie within 2 standard deviations of the mean. Nearly 99.73% of the values lie within 3 standard deviations of the mean. By: Mohamed Salah ElDien Mohamed Aly, MSc, PMP®, DIT, MCAD
- 10. - Exercise: Three-point estimates (PERT) Exercise: PERT - Most tricky question - Together with your team, you applied three-point estimation on a Critical path which consists of two activities. The following duration uncertainties are all calculated assuming a ±3 sigma Confidence interval. - The duration uncertainty - defined as pessimistic minus optimistic estimate - of the first activity is 18 days; the second estimate has an uncertainty of 24 days. Applying the PERT formula for paths, what is the duration uncertainty of the entire path? A.21 days B.30 days C.42 days D. No statement is possible from the information given. By: Mohamed Salah ElDien Mohamed Aly, MSc, PMP®, DIT, MCAD
- 11. Answer: See that the question says that Duration Uncertainty is Pessimistic minus Optimistic in other words P-O. We know that SD is (P-O) / 6, thus SD is "duration Certainty” / 6 Thus; For Path 1: SD = 18/6 = 3 Variance = 3*3 = 9 For path 2: SD = 24 /6 = 4 Variance = 4*4 = 16 Total Path Variance = 16 + 9 = 25 Sqrt (25) = 5 Meaning (P-O) / 6 = 5 (P - O) = 5 * 6 DURATION UNCERTAINTY = 30 3.5 Develop Schedule - Process of analyzing activity sequences, durations, resource requirements, and schedule constraints to create the project schedule. Inputs - Project Scope Statement - Activity List - Activity Attributes - Project Schedule Network Diagrams - Activity Resource Requirements - Resource Calendars - Activity Duration Estimates - Org. Process Assets - Enterprise Environmental Factor Tools Outputs - Project Schedule - Schedule Model Data - Schedule Baseline - Schedule Network Analysis - Project Document updates; -CPM (Critical Path Method) * Resource Requirements - Schedule Compression (Updates) - What-If Scenario Analysis * Activity Attributes - Resource Leveling (Updates) - Critical Chain Method * Project Calendar (Updates) - Applying Leads & Lags *Schedule Management Plan - Schedule tool (PM Software) (Updates) * PM Plan (Updates) Schedule Development By: Mohamed Salah ElDien Mohamed Aly, MSc, PMP®, DIT, MCAD
- 12. - Schedule in simplest form is a plan for an activity or event. We make schedules for every event of our life. The major ingredients are Activity list and when those occur. Project Schedule development is no different than that. We identify when each and every activities occur. We defined activities and sequenced them in earlier phases. So we provide Calendar dates to all of those activities and that sums up to the project start and end dates too. Slack or Float: - A float is amount of time you can use without disturbing other planned activities. It tells how much of flexibility you have within the project schedule. It is important to have flexibility. There are 2 types of internal slacks and one external slack for any project - Total (Path) Float (Slack) = Late Start – Early Start - Total (path) float is a measure of scheduling flexibility. Free Slack/float: the amount of time an activity can be delayed without delaying the early start date of its successor(s). Total Slack: the amount of time an activity can be delayed without delaying the project end date or intermediary milestone. Project Slack: the amount of time an activity can be delayed without delaying the externally imposed project completion date required by customer/management. In the above network diagram there are 3 possible paths I) Start -> A -> C -> E -> END --- 5 + 3 + 2 = 10 DAYS II) Start -> B -> D -> E -> END --- 4 + 6 + 2 = 12 DAYS III) Start -> B -> D -> F -> END --- 4 + 6 + 6 = 16 DAYS By: Mohamed Salah ElDien Mohamed Aly, MSc, PMP®, DIT, MCAD
- 13. Out of those 3 paths Path III is the longest path which needs 16 days to deliver all 3 Activities in it. We call this one as Critical path. - In the above network diagram For E both D and C are predecessors. It need 10 days to complete B+D and to reach E. And it just takes 8 days for A+C to complete to start E. So even if gets 2 days of delay the start date of E will not be changed. So activity “C” has 2 days of Free Slack. - Path I) has 6 days of Total slack and still won’t impact Project’s end date. - The above process is called as Critical Path Method of Estimation. Observe that Activities on Critical Path doesn’t have flexibility that is ZERO SLACK. What Is the Critical Path? - Critical Path is the longest duration path Identify the shortest time needed to complete a project - There can be more than one critical path - We don’t want critical path, it increase risk - Don’t leave a project with a negative float, you would compress the schedule - Near-critical path is the path that is close in duration to critical path Critical Path Calculations - Forward pass — to determine the project’s ―natural end date‖ based on its early start and early finish dates. Backward pass — to determine late start and late finish dates. By: Mohamed Salah ElDien Mohamed Aly, MSc, PMP®, DIT, MCAD
- 14. - Sometimes you might get delayed in early stages and would like to shrink activities in later phases. We call it as Schedule Compression. We have to compress Critical Path activities only. Shortening the Critical Path; 1. Crashing: adding more resources to any activity on Critical path activities. Or by another meaning; analyzing alternatives to get maximum duration compression for the least cost. Crashing Methods; - Add resources efficiently: More people per activity More shifts per activity (with overtime) - Change materials: Use quick-curing concrete 2. Fast Tracking: By: Mohamed Salah ElDien Mohamed Aly, MSc, PMP®, DIT, MCAD
- 15. - It is about re-sequencing activities in the network diagram to gain time benefit. Or by another meaning; compressing the schedule by overlapping activities that you would prefer to do in sequence. Fast Tracking Notes: - There is no reason to “Crash” or “Fast Track” an activity that is not on the “Critical Path”. - “Fast tracking” is risky and may lead to rework. - “Crashing” is costly because of adding resources. 3. Drag “Devaux’s Removed Activity Gauge” - It is the amount of time that can potentially be saved by removing an activity from the project, or by reducing an activity’s duration to zero. 4. Monte Carlo Simulation “What – if Scenario” - Used when there is possibility that the critical path will be different for a given set of project conditions. 3.6 Control Schedule - Process of analyzing activity sequences, durations, resource requirements, and schedule constraints to create the project schedule. Inputs Tools Outputs By: Mohamed Salah ElDien Mohamed Aly, MSc, PMP®, DIT, MCAD
- 16. - Schedule Management Plan Schedule Baseline Performance Reports Approved Change Requests - - - Progress Reporting Schedule Change Control System Performance Measurement Variance Analysis Schedule Compression Bar Charts PM Software - Schedule Model Data (Updates) Schedule Baseline (Updates) Performance measurements Requested Changes Recommended Corrective Actions Activity List & Attributes (Updates) PM Plan (Updates) Org. Process Assets (Updates) It is about understanding the measures we need to put in place to ensure that we have a good schedule. It is about tracking the status, understanding what time a team member have spent in the project and how much time they need to complete each activity on the project according to the developed schedule. During the “Monitoring & Controlling process” we may need to apply some changes to the approved project schedule to overcome any delays. Schedule Control has most important Tools and outputs for the projects which can be rolled up to Programs, Portfolios to Executive Management. That is Performance measurement and Variance analysis. This process is considered as an iterative process that usually done throughout the project execution. When changes are requested you have to monitor those using schedule Change Control System and recommended changes are suggested. Summary of Key Points - Float is a measure of scheduling flexibility. - Total float is really path float — don’t get too excited if you have lots of float! - Critical path may change over time. - The result of mathematical analysis is an input to scheduling. By: Mohamed Salah ElDien Mohamed Aly, MSc, PMP®, DIT, MCAD
- 17. Exercise Questions: - What is the critical path? - What is critical path duration? - What is float (slack) duration of activity A30? By: Mohamed Salah ElDien Mohamed Aly, MSc, PMP®, DIT, MCAD