Mercer Capital's Business Development Companies Quarterly Newsletter | Q2 2012
•
1 like•144 views

Business development companies are an important and growing source of funding for middle market companies. Along with private equity and other investment funds, BDCs provide billions of dollars of investment capital to private companies in every segment of the economy. For over thirty years, Mercer Capital has met the valuation needs of the same middle market companies to which BDCs and other funds provide capital. This quarterly newsletter tracks the financial and stock market performance of the public BDCs.

Recommended
More Related Content
More from Mercer Capital
More from Mercer Capital (20)
Recently uploaded
Recently uploaded (20)
Mercer Capital's Business Development Companies Quarterly Newsletter | Q2 2012
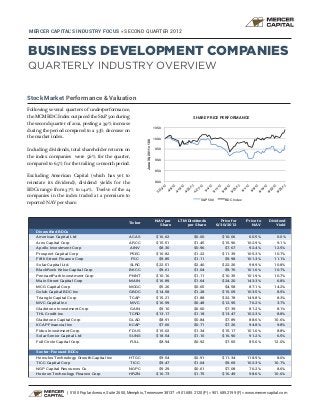
- 1. MERCER CAPITAL’S INDUSTRY FOCUS » SECOND QUARTER 2012 BUSINESS DEVELOPMENT COMPANIES QUARTERLY INDUSTRY OVERVIEW Stock Market Performance & Valuation Following several quarters of underperformance, the MCM BDC Index outpaced the S&P 500 during SHARE PRICE PERFORMANCE the second quarter of 2012, posting a 3.9% increase 105.0 during the period compared to a 3.3% decrease on the market index. 100.0 Including dividends, total shareholder returns on June 30, 2011 = 100 95.0 the index companies were 5.6% for the quarter, 90.0 compared to 6.5% for the trailing 12-month period. 85.0 Excluding American Capital (which has yet to reinstate its dividend), dividend yields for the 80.0 2 12 2 2 2 12 12 2 2 12 12 2 2 2 BDCs range from 3.7% to 14.2%. Twelve of the 24 /1 /1 /1 /1 /1 /1 /1 /1 /1 6/ 4/ / 1/ 8/ 30 13 20 27 11 18 25 15 22 29 4/ 5/ 6/ 6/ 5/ 3/ 4/ 4/ 4/ 5/ 5/ 6/ 6/ 6/ companies in the index traded at a premium to S&P 500 BDC Index reported NAV per share. NAV per LTM Dividends Price for Price to Dividend Ticker Share per Share 6/30/2012 NAV Yield Diversified BDCs American Capital Ltd ACAS $16.62 $0.00 $10.06 60.5% 0.0% Ares Capital Corp ARCC $15.51 $1.45 $15.96 102.9% 9.1% Apollo Investment Corp AINV $8.30 $0.96 $7.67 92.4% 12.5% Prospect Capital Corp PSEC $10.82 $1.22 $11.39 105.3% 10.7% Fifth Street Finance Corp FSC $9.85 $1.11 $9.98 101.3% 11.1% Solar Capital Ltd. SLRC $22.51 $2.40 $22.26 98.9% 10.8% BlackRock Kelso Capital Corp BKCC $9.61 $1.04 $9.76 101.6% 10.7% PennantPark Investment Corp PNNT $10.16 $1.11 $10.35 101.9% 10.7% Main Street Capital Corp MAIN $16.89 $1.64 $24.20 143.3% 6.8% MCG Capital Corp MCGC $5.26 $0.65 $4.58 87.1% 14.2% Golub Capital BDC Inc GBDC $14.58 $1.28 $15.09 103.5% 8.5% Triangle Capital Corp TCAP $15.21 $1.88 $22.78 149.8% 8.3% MVC Capital Inc MVC $16.99 $0.48 $12.95 76.2% 3.7% Gladstone Investment Corp GAIN $9.10 $0.60 $7.39 81.2% 8.1% THL Credit Inc TCRD $13.17 $1.18 $13.47 102.3% 8.8% Gladstone Capital Corp GLAD $8.91 $0.84 $7.89 88.6% 10.6% KCAP Financial Inc KCAP $7.66 $0.71 $7.26 94.8% 9.8% Fidus Investment Corp FDUS $15.02 $1.34 $15.17 101.0% 8.8% Solar Senior Capital Ltd SUNS $18.54 $1.10 $16.90 91.2% 6.5% Full Circle Capital Corp FULL $8.94 $0.92 $7.65 85.6% 12.0% Sector-Focused BDCs Hercules Technology Growth Capital Inc HTGC $9.54 $0.91 $11.34 118.9% 8.0% TICC Capital Corp TICC $9.47 $1.04 $9.69 102.3% 10.7% NGP Capital Resources Co NGPC $9.29 $0.61 $7.08 76.2% 8.6% Horizon Technology Finance Corp HRZN $16.73 $1.75 $16.49 98.6% 10.6% | 5100 Poplar Avenue, Suite 2600, Memphis, Tennessee 38137 » 901.685.2120 (P) » 901.685.2199 (F) » www.mercercapital.com
- 2. MERCER CAPITAL’S INDUSTRY FOCUS » BUSINESS DEVELOPMENT COMPANIES Financial Performance: 2012 Q2 Second quarter net investment income for the group was 6.5% of total assets, compared to 6.0% for the trailing 12-month COMPONENTS OF NET INVESTMENT INCOME period. The improvement was primarily attributable to a 14.0% modestly higher effective yield on assets during the quarter (11.9%, compared to 11.4% for the trailing 12-month period). 12.0% 10.0% The chart at right depicts the components of net operating 8.0% income for the second quarter and the trailing 12-month 6.0% period. 4.0% The group reported a net capital loss (sum of realized gains/ 2.0% losses and change in unrealized appreciation/depreciation) 0.0% of approximately $81.2 million during the quarter and Effective Yield on Effective Cost of Other Expenses / Net Investment $87.2 million during the prior twelve months. For the last Assets Funds Assets Income / Assets 12 months, the companies posted a median return on equity Q2 LTM of 7.3%. Financial Position: 2012 Q2 As a percentage of amortized cost, the fair value of portfolio investments increased to 95.3%, compared to 92.7% one year prior. The increase was primarily attributable to realization of embedded losses. Net investment activity (portfolio purchases net of dispositions) intensified in the second quarter ($610 million for the quarter, compared to $1.63 billion for the prior twelve months). On an aggregate basis, the equity/assets ratio, increased modestly to 66.6%, from 65.7% one year earlier. Over that period, the companies in the group raised approximately $1.0 billion through new equity issuance, compared to approximately $428 million from net borrowings. Valuation Services for BDCs & Other Investment Funds Business development companies are an important and growing source of funding for middle market companies. Along with private equity and other investment funds, BDCs provide billions of dollars of investment capital to private companies in every segment of the economy. For over thirty years, Mercer Capital has met the valuation needs of the same middle market companies to which BDCs and other funds provide capital. We offer the following services for BDCs and other investment funds: • Ongoing fair value measurement and review for portfolio investments • Fair value measurement process consulting • Regulatory review and litigation support • Purchase price allocation for portfolio companies • Goodwill impairment testing for portfolio companies • Equity compensation fair value measurement for portfolio companies • Buy-sell agreement consulting and valuation dispute resolution • Fairness and solvency opinions Mercer Capital’s senior valuation professionals bring broad and deep experience to the range of valuation needs faced by BDCs and other investment funds. For more information about Mercer Capital, visit www.mercercapital.com. For questions regarding the information found in this piece, contact: Travis W. Harms, CFA, CPA/ABV 901.322.9760 » harmst@mercercapital.com Copyright © 2012 Mercer Capital Management, Inc. All rights reserved. It is illegal under Federal law to reproduce this publication or any portion of its contents without the publisher’s permission. Media quotations with source attribution are encouraged. Reporters requesting additional information or editorial comment should contact Barbara Walters Price at 901.685.2120. Mercer Capital’s Industry Focus is published quarterly and does not constitute legal or financial consulting advice. It is offered as an information service to our clients and friends. Those interested in specific guidance for legal or accounting matters should seek competent professional advice. Inquiries to discuss specific valuation matters are welcomed. To add your name to our mailing list to receive this complimentary publication, visit our web site at www.mercercapital.com.