SlideShare ist ein Scribd-Unternehmen logo
1 von 16
Downloaden Sie, um offline zu lesen
Slide 1: Main Points
 Income Redistribution
 •  Increasing share of government spending is
    transferring income from current or future
    taxpayers to the jobless.
 Government Dependency
 •  Hit record high. Will ever return to “normal” level?
 Nothing Helps Like Jobs
 •  Joblessness impacts government spending. It is
    not so clear that the reverse is true.
Slide	
  2:	
  Employment	
  Ra1o	
  
                                                 66%	


                                                 64%	
  
share	
  of	
  working	
  age	
  popula1on	


                                                                                                                                                                                            10.5	
  million	
  jobs	
  

                                                 62%	


                                                 60%	


                                                 58%	
  
                                                           shaded	
  areas	
  denote	
  recession	
  

                                                 56%	
  
                                                      1990	
                     1995	
                               2000	
                              2005	
                               2010	
  
                                                                                   Source:	
  Bureau	
  of	
  Labor	
  Sta8s8cs	
  
                                                                                   Produced	
  by	
  Keith	
  Hall	
  ,	
  Mercatus	
  Center	
  at	
  George	
  Mason	
  University.	
  
Slide 3: Unemployment Impact on Government

Three types of effects:

1.  Slower growth of income slows tax revenue

2.  Government spending on unemployed
    Increases

3.  Government spending on low-income
    families increases
Slide	
  4:	
  	
  Loss	
  of	
  Na1onal	
  Income	
  
                                         $18	
  

                                         $16	
  

                                         $14	
  
                                                                                                 Poten8al	
  GDP	
  
trillions	
  of	
  2012	
  dollars	


                                         $12	
  
                                                                                                 GDP	
  
                                         $10	
  

                                           $8	
  
                                                                                                                                                                   Loss	
  =	
  $1	
  trillion/year	
  
                                           $6	
  

                                           $4	
  

                                           $2	
     shaded	
  areas	
  denote	
  recession	
  

                                           $0	
  
                                             1960	
   1965	
   1970	
   1975	
   1980	
   1985	
   1990	
   1995	
   2000	
   2005	
   2010	
  
                                                          Source:	
  Bureau	
  of	
  Economic	
  Analysis,	
  Congressional	
  Budget	
  Office	
  
                                                          Produced	
  by	
  Keith	
  Hall	
  ,	
  Mercatus	
  Center	
  at	
  George	
  Mason	
  University.	
  
Slide	
  5:	
  Current	
  Gov’t	
  Receipts	
  &	
  Expenditures	
  
                                                                        (share	
  of	
  GDP)	
  
              40%	
  

              35%	
  

              30%	
  

              25%	
  
Percent	


              20%	
  
                                                                                                                         Current	
  expenditures	
  
              15%	
  
                                                                                                                         Current	
  receipts	
  
              10%	
  
                           shaded	
  areas	
  denote	
  recession	
  
               5%	
  

               0%	
  
                 1950	
   1955	
   1960	
   1965	
   1970	
   1975	
   1980	
   1985	
   1990	
   1995	
   2000	
   2005	
   2010	
  
                                 Source:	
  Bureau	
  of	
  Economic	
  Analysis,	
  
                                 Produced	
  by	
  Keith	
  Hall	
  ,	
  Mercatus	
  Center	
  at	
  George	
  Mason	
  University.	
  
Slide 6: How Does Government
Spending Enter Into GDP?
Four Main Types of Government Spending
  1.  *Government Consumption (46%)
  2.  *Government Investment (8%)
  3.  Transfer Payments (43%)
  4.  Interest Payments (8%)


  *part of GDP
Slide 7: Federal Government
Spending and GDP
 Four Main Types of Government Spending
   1.  *Government Consumption (27%)
   2.  *Government Investment (4%)
   3.  Grants-In-Aid to S&L Govt (12%)
   4.  Other Transfer Payments (47%)
   5.  Interest Payments (8%)
Slide	
  8:	
  	
  Government	
  Spending	
  by	
  Type	
  
                                                            (share	
  of	
  GDP)	
  
              25%	
  
                                                                                                               19.5%	
  of	
  GDP	
  in	
  2012	
  

              20%	
  
                              Consump8on	
  &	
  Gross	
  Investment	
  
                              Social	
  Benefits	
  
              15%	
  
percent	


                              Interest	
  Payments	


              10%	


               5%	
  
                                                                                  shaded	
  areas	
  denote	
  recession	
  

               0%	
  
                 1960	
   1965	
   1970	
   1975	
   1980	
   1985	
   1990	
   1995	
   2000	
   2005	
   2010	
  
                                        Source:	
  Bureau	
  of	
  Economic	
  Analysis	
  
                                        Produced	
  by	
  Keith	
  Hall	
  ,	
  Mercatus	
  Center	
  at	
  George	
  Mason	
  University.	
  
Slide	
  9:	
  	
  Changing	
  Role	
  of	
  Federal	
  Government	
  
                                                            (share	
  of	
  GDP)	
  
              15%	
  
                                                                          Consump8on	
  &	
  Gross	
  Investment	
  
                                                                          Social	
  Benefits	
  
                                                                          Interest	
  Payments	
  
                                                                          Grants-­‐in-­‐aid	
  to	
  state	
  and	
  local	
  governments	
  
              10%	
  
percent	


               5%	


                                                                                         shaded	
  areas	
  denote	
  recession	
  
               0%	
  
                 1960	
   1965	
   1970	
   1975	
   1980	
   1985	
   1990	
   1995	
   2000	
   2005	
   2010	
  
                                        Source:	
  Bureau	
  of	
  Economic	
  Analysis	
  
                                        Produced	
  by	
  Keith	
  Hall	
  ,	
  Mercatus	
  Center	
  at	
  George	
  Mason	
  University.	
  
Slide	
  10:	
  	
  Rise	
  of	
  Dependency	
  
                        Social	
  Benefit	
  as	
  Share	
  of	
  Personal	
  Income	
  	
  
              20%	
  
              18%	
  
              16%	
  
              14%	
  
              12%	
  
percent	


              10%	
  
               8%	
  
               6%	
  
               4%	
  
               2%	
     shaded	
  areas	
  denote	
  recession	
  

               0%	
  
                 1960	
   1965	
   1970	
   1975	
   1980	
   1985	
   1990	
   1995	
   2000	
   2005	
   2010	
  
                                               Source:	
  Bureau	
  of	
  Economic	
  Analysis	
  
                                               Produced	
  by	
  Keith	
  Hall	
  ,	
  Mercatus	
  Center	
  at	
  George	
  Mason	
  University.	
  
Slide	
  11:	
  Receipt	
  of	
  Social	
  Benefits	
  by	
  Type	
  
                                        15%	
      shaded	
  areas	
  denote	
  recession	
  
                                                                                                             Unemployment	
  Compensa8on	
  
                                                                                                             Other	
  Social	
  Benefits	
  
                                                                                                             Means	
  Tested	
  Spending	
  (approximate)	
  
share	
  of	
  personal	
  income	


                                        10%	


                                         5%	


                                         0%	
  
                                           1960	
   1965	
   1970	
   1975	
   1980	
   1985	
   1990	
   1995	
   2000	
   2005	
   2010	
  
                                                                          Source:	
  Bureau	
  of	
  Economic	
  Analysis	
  
                                                                          Produced	
  by	
  Keith	
  Hall	
  ,	
  Mercatus	
  Center	
  at	
  George	
  Mason	
  University.	
  
Slide 12: Programs Targeting the
Unemployed
1.  Unemployment Insurance
      •  Unemployment Compensation
      •  Trade Adjustment Assistance
      •  Disaster Unemployment Assistance
2.  Healthcare Assistance
      •  Health Coverage Tax Credit
      •  Consolidated Omnibus Budget Reconciliation Act of
          1985 (COBRA)
3.  Job Search and Training Assistance
      •  Workforce Investment Act of 1998
      •  Wagner-Peyser Act of 1933
Slide	
  13:	
  Unemployment	
  Compensa1on	
  	
  
                                            $180	
  

                                            $160	
  

                                            $140	
  
billlions	
  of	
  current	
  dollars	


                                                                                                                                         Emergency	
  
                                            $120	
                                                                                       Other	
  

                                            $100	
  

                                             $80	
  

                                             $60	
     shaded	
  areas	
  denote	
  recession	
  

                                             $40	
  

                                             $20	
  

                                               $0	
  
                                                 1960	
   1965	
   1970	
   1975	
   1980	
   1985	
   1990	
   1995	
   2000	
   2005	
   2010	
  
                                                                              Source:	
  Bureau	
  of	
  Economic	
  Analysis	
  
                                                                              Produced	
  by	
  Keith	
  Hall	
  ,	
  Mercatus	
  Center	
  at	
  George	
  Mason	
  University.	
  
Slide 14: Means-Tested Programs
•    Low income, available regardless of employment status
     •  126 different federal programs
•    Largest programs (billions)
     o    Medicaid	
  –	
  $417.3	
  
     o    Supplemental	
  Nutri8onal	
  Asst	
  Program	
  (SNAP)	
  –$74.6	
  
     o    Supplemental	
  Security	
  Income	
  –	
  $52.6	
  
     o    Earned	
  Income	
  Tax	
  Credit	
  -­‐-­‐	
  $56.6	
  
     o    Child	
  Tax	
  Credit	
  –	
  $28.3	
  
     o    Federal	
  Pell	
  Grants	
  -­‐	
  $41	
  
     o    Temporary	
  Assistance	
  for	
  Needy	
  Families	
  (TANF)	
  –	
  $21	
  
Slide	
  15:	
  Trends	
  in	
  Social	
  Benefits	
  	
  
                                                                  and	
  the	
  Jobless	
  Rate	
  
                                        25%	
                                                                                                                                  50%	


                                                                                                                                                                                         share	
  of	
  working	
  age	
  popula1on	
  
                                        20%	
                                                                                                                                  45%	
  
share	
  of	
  personal	
  income	


                                        15%	
                                                                                                                                  40%	


                                        10%	
                                                                                                                                  35%	
  
                                                                                                                                      Social	
  Benefits	
  
                                         5%	
                                                                                         Jobless	
  Rate	
  (right	
  axis)	
     30%	
  

                                                  shaded	
  areas	
  denote	
  recession	
  
                                         0%	
                                                                                                                                  25%	
  
                                           1960	
   1965	
   1970	
   1975	
   1980	
   1985	
   1990	
   1995	
   2000	
   2005	
   2010	
  
                                                                   Source:	
  Bureau	
  of	
  Economic	
  Analysis,	
  Bureau	
  of	
  Labor	
  Sta8s8cs	
  
                                                                   Produced	
  by	
  Keith	
  Hall	
  ,	
  Mercatus	
  Center	
  at	
  George	
  Mason	
  University.	
  
Slide	
  16:	
  	
  Trends	
  in	
  the	
  Poverty	
  	
  
                                                          and	
  Jobless	
  Rates	
  
                               25%	
                                                                                                                            50%	


                                                                                                                                                                          share	
  of	
  working	
  age	
  popula1on	
  
                               20%	
                                                                                                                            45%	
  
share	
  of	
  popula1on	


                               15%	
                                                                                                                            40%	


                               10%	
                                                                                                                            35%	
  

                                                   Poverty	
  Rate	
  
                                5%	
                                                                                                                            30%	
  
                                                   Jobless	
  Rate	
  (right	
  axis)	
  

                                0%	
                                                                                                                            25%	
  
                                     1960	
   1965	
   1970	
   1975	
   1980	
   1985	
   1990	
   1995	
   2000	
   2005	
   2010	
  
                                                       Source:	
  Census	
  Bureau,	
  Bureau	
  of	
  Labor	
  Sta8s8cs	
  
                                                       Produced	
  by	
  Keith	
  Hall	
  ,	
  Mercatus	
  Center	
  at	
  George	
  Mason	
  University.	
  

Weitere ähnliche Inhalte

Was ist angesagt?

US Retail Highlights Q3 2011
US Retail Highlights Q3 2011US Retail Highlights Q3 2011
US Retail Highlights Q3 2011
colliersohio
 
New Brunswick Vaughan Presentation
New Brunswick Vaughan PresentationNew Brunswick Vaughan Presentation
New Brunswick Vaughan Presentation
Livio Di Matteo
 
Skills Gap: Reality or Myth?
Skills Gap: Reality or Myth?Skills Gap: Reality or Myth?
Skills Gap: Reality or Myth?
Kathleen Baireuther
 
04 the keynesian model
 04 the keynesian model 04 the keynesian model
04 the keynesian model
NepDevWiki
 

Was ist angesagt? (9)

Migration Patterns within the United States
Migration Patterns within the United StatesMigration Patterns within the United States
Migration Patterns within the United States
 
Amy Liu | Metropolitan Business Planning | Global Cities Initiative
Amy Liu | Metropolitan Business Planning | Global Cities InitiativeAmy Liu | Metropolitan Business Planning | Global Cities Initiative
Amy Liu | Metropolitan Business Planning | Global Cities Initiative
 
US Retail Highlights Q3 2011
US Retail Highlights Q3 2011US Retail Highlights Q3 2011
US Retail Highlights Q3 2011
 
Our new-world - Mary Meeker and BOND report on COVID19
Our new-world - Mary Meeker and BOND report on COVID19Our new-world - Mary Meeker and BOND report on COVID19
Our new-world - Mary Meeker and BOND report on COVID19
 
New Brunswick Vaughan Presentation
New Brunswick Vaughan PresentationNew Brunswick Vaughan Presentation
New Brunswick Vaughan Presentation
 
Skills Gap: Reality or Myth?
Skills Gap: Reality or Myth?Skills Gap: Reality or Myth?
Skills Gap: Reality or Myth?
 
Dougbibby 100930085051 Phpapp02
Dougbibby 100930085051 Phpapp02Dougbibby 100930085051 Phpapp02
Dougbibby 100930085051 Phpapp02
 
The Walking Dead Zombie Firms and Productivity Performance in OECD Countries
The Walking Dead Zombie Firms and Productivity Performance in OECD CountriesThe Walking Dead Zombie Firms and Productivity Performance in OECD Countries
The Walking Dead Zombie Firms and Productivity Performance in OECD Countries
 
04 the keynesian model
 04 the keynesian model 04 the keynesian model
04 the keynesian model
 

Andere mochten auch

Effects of unemployment on economy
Effects of unemployment on economyEffects of unemployment on economy
Effects of unemployment on economy
Mahvesh Zahra
 
Causes & Effects of Unemployment
Causes & Effects of UnemploymentCauses & Effects of Unemployment
Causes & Effects of Unemployment
mattbentley34
 
Omanization of the private sector
Omanization of the private sectorOmanization of the private sector
Omanization of the private sector
Ayesha Makki
 
Managing Social Communities
Managing Social CommunitiesManaging Social Communities
Managing Social Communities
net2-project
 
Unemployment
UnemploymentUnemployment
Unemployment
Maha H
 
Unemployment economics assignment
Unemployment economics assignmentUnemployment economics assignment
Unemployment economics assignment
Maha H
 
Theories of social work — presentation transcript
Theories of social work — presentation transcriptTheories of social work — presentation transcript
Theories of social work — presentation transcript
Hassaan Qazi
 
Research problem, hypothesis & conceptual framework
Research problem, hypothesis & conceptual frameworkResearch problem, hypothesis & conceptual framework
Research problem, hypothesis & conceptual framework
Meghana Sudhir
 
Unemployment
UnemploymentUnemployment
Unemployment
channyb
 

Andere mochten auch (16)

Effects of unemployment on economy
Effects of unemployment on economyEffects of unemployment on economy
Effects of unemployment on economy
 
Causes & Effects of Unemployment
Causes & Effects of UnemploymentCauses & Effects of Unemployment
Causes & Effects of Unemployment
 
Unemployment
Unemployment Unemployment
Unemployment
 
Ppt on unemployment
Ppt on unemploymentPpt on unemployment
Ppt on unemployment
 
Omanization of the private sector
Omanization of the private sectorOmanization of the private sector
Omanization of the private sector
 
Managing Social Communities
Managing Social CommunitiesManaging Social Communities
Managing Social Communities
 
Unemployment
UnemploymentUnemployment
Unemployment
 
Economics presentation unemployment
Economics presentation unemploymentEconomics presentation unemployment
Economics presentation unemployment
 
Unemployment
UnemploymentUnemployment
Unemployment
 
Unemployment economics assignment
Unemployment economics assignmentUnemployment economics assignment
Unemployment economics assignment
 
Theories of social work — presentation transcript
Theories of social work — presentation transcriptTheories of social work — presentation transcript
Theories of social work — presentation transcript
 
Conceptualizing in research : an overview
Conceptualizing in research : an overviewConceptualizing in research : an overview
Conceptualizing in research : an overview
 
Policies to Reduce Unemployment
Policies to Reduce UnemploymentPolicies to Reduce Unemployment
Policies to Reduce Unemployment
 
Research problem, hypothesis & conceptual framework
Research problem, hypothesis & conceptual frameworkResearch problem, hypothesis & conceptual framework
Research problem, hypothesis & conceptual framework
 
Theories of Social Work
Theories of Social WorkTheories of Social Work
Theories of Social Work
 
Unemployment
UnemploymentUnemployment
Unemployment
 

Ähnlich wie What Does the Unemployment Rate Mean for Government Spending?

2. Impulsando el desarrollo a través de la atracción de IED en los sectores d...
2.	Impulsando el desarrollo a través de la atracción de IED en los sectores d...2.	Impulsando el desarrollo a través de la atracción de IED en los sectores d...
2. Impulsando el desarrollo a través de la atracción de IED en los sectores d...
comexcr
 
09 federal deficits and the national debt
 09 federal deficits and the national debt 09 federal deficits and the national debt
09 federal deficits and the national debt
NepDevWiki
 
Colm Mc Carthy Limerick Feb 2009
Colm Mc Carthy Limerick Feb 2009Colm Mc Carthy Limerick Feb 2009
Colm Mc Carthy Limerick Feb 2009
dpalcic
 
President's Dilemma
President's DilemmaPresident's Dilemma
President's Dilemma
evangelxoxo
 
Us policy economic_sfif_pres_jun_9_ver2
Us policy economic_sfif_pres_jun_9_ver2Us policy economic_sfif_pres_jun_9_ver2
Us policy economic_sfif_pres_jun_9_ver2
tapask7889
 

Ähnlich wie What Does the Unemployment Rate Mean for Government Spending? (20)

BLS Numbers on Jobs
BLS Numbers on JobsBLS Numbers on Jobs
BLS Numbers on Jobs
 
Daniel Mitchell: Free Market Road Show 2012
Daniel Mitchell: Free Market Road Show 2012Daniel Mitchell: Free Market Road Show 2012
Daniel Mitchell: Free Market Road Show 2012
 
Indian economy-7275
Indian economy-7275Indian economy-7275
Indian economy-7275
 
Unbalanced Mayhem Presentation (National Trends in Municipal Finance)
Unbalanced Mayhem Presentation (National Trends in Municipal Finance)Unbalanced Mayhem Presentation (National Trends in Municipal Finance)
Unbalanced Mayhem Presentation (National Trends in Municipal Finance)
 
Unbalanced Mayhem: Trends, Challenges & Failures in Local Government Budgeting
Unbalanced Mayhem: Trends, Challenges & Failures in Local Government BudgetingUnbalanced Mayhem: Trends, Challenges & Failures in Local Government Budgeting
Unbalanced Mayhem: Trends, Challenges & Failures in Local Government Budgeting
 
Indian Economy
Indian EconomyIndian Economy
Indian Economy
 
How to Fix America’s Fiscal Crisis: Reform Lessons from Canada - Chris Edward...
How to Fix America’s Fiscal Crisis: Reform Lessons from Canada - Chris Edward...How to Fix America’s Fiscal Crisis: Reform Lessons from Canada - Chris Edward...
How to Fix America’s Fiscal Crisis: Reform Lessons from Canada - Chris Edward...
 
2. Impulsando el desarrollo a través de la atracción de IED en los sectores d...
2.	Impulsando el desarrollo a través de la atracción de IED en los sectores d...2.	Impulsando el desarrollo a través de la atracción de IED en los sectores d...
2. Impulsando el desarrollo a través de la atracción de IED en los sectores d...
 
1ª conferência - James S Henry
1ª conferência - James S Henry 1ª conferência - James S Henry
1ª conferência - James S Henry
 
SANTANDER ARGENTINA-SANTANDER INVESTOR DAY
SANTANDER ARGENTINA-SANTANDER INVESTOR DAYSANTANDER ARGENTINA-SANTANDER INVESTOR DAY
SANTANDER ARGENTINA-SANTANDER INVESTOR DAY
 
Explaining the Great Recession and Anemic Job Recovery: The Role of Falterin...
Explaining the Great Recession and Anemic  Job Recovery: The Role of Falterin...Explaining the Great Recession and Anemic  Job Recovery: The Role of Falterin...
Explaining the Great Recession and Anemic Job Recovery: The Role of Falterin...
 
Electrolux Presentation SEB Enskilda Capital Goods Seminar 2011
Electrolux Presentation SEB Enskilda Capital Goods Seminar 2011Electrolux Presentation SEB Enskilda Capital Goods Seminar 2011
Electrolux Presentation SEB Enskilda Capital Goods Seminar 2011
 
09 federal deficits and the national debt
 09 federal deficits and the national debt 09 federal deficits and the national debt
09 federal deficits and the national debt
 
Proexport
ProexportProexport
Proexport
 
Sample 1
Sample 1Sample 1
Sample 1
 
Development strategies: middle income countries
Development strategies: middle income countriesDevelopment strategies: middle income countries
Development strategies: middle income countries
 
Colm Mc Carthy Limerick Feb 2009
Colm Mc Carthy Limerick Feb 2009Colm Mc Carthy Limerick Feb 2009
Colm Mc Carthy Limerick Feb 2009
 
Economics Slideshow
Economics SlideshowEconomics Slideshow
Economics Slideshow
 
President's Dilemma
President's DilemmaPresident's Dilemma
President's Dilemma
 
Us policy economic_sfif_pres_jun_9_ver2
Us policy economic_sfif_pres_jun_9_ver2Us policy economic_sfif_pres_jun_9_ver2
Us policy economic_sfif_pres_jun_9_ver2
 

Mehr von Mercatus Center

Mehr von Mercatus Center (20)

ACA Has Worsened Medicaid's Structural Problems
ACA Has Worsened Medicaid's Structural ProblemsACA Has Worsened Medicaid's Structural Problems
ACA Has Worsened Medicaid's Structural Problems
 
Evaluating a Sluggish Economy with Bruce Yandle
Evaluating a Sluggish Economy with Bruce YandleEvaluating a Sluggish Economy with Bruce Yandle
Evaluating a Sluggish Economy with Bruce Yandle
 
Affordable Care Act's 6 Year Anniversary
Affordable Care Act's 6 Year AnniversaryAffordable Care Act's 6 Year Anniversary
Affordable Care Act's 6 Year Anniversary
 
Capitol Hill Campis March 2016
Capitol Hill Campis March 2016Capitol Hill Campis March 2016
Capitol Hill Campis March 2016
 
Nominal GDP Targeting
Nominal GDP TargetingNominal GDP Targeting
Nominal GDP Targeting
 
Understanding the U.S. Health Care System
Understanding the U.S. Health Care SystemUnderstanding the U.S. Health Care System
Understanding the U.S. Health Care System
 
Wireless Spectrum in 2016: A Policy Update
Wireless Spectrum in 2016: A Policy UpdateWireless Spectrum in 2016: A Policy Update
Wireless Spectrum in 2016: A Policy Update
 
Buchanan Speaker Series: Education, Inequality, and Incentives
Buchanan Speaker Series: Education, Inequality, and IncentivesBuchanan Speaker Series: Education, Inequality, and Incentives
Buchanan Speaker Series: Education, Inequality, and Incentives
 
Modernizing Freight Rail Regulation: Recommendations from the TRB Study
Modernizing Freight Rail Regulation: Recommendations from the TRB StudyModernizing Freight Rail Regulation: Recommendations from the TRB Study
Modernizing Freight Rail Regulation: Recommendations from the TRB Study
 
Modernizing the SSDI Eligibility Criteria: Trends in Demographics and Labor M...
Modernizing the SSDI Eligibility Criteria: Trends in Demographics and Labor M...Modernizing the SSDI Eligibility Criteria: Trends in Demographics and Labor M...
Modernizing the SSDI Eligibility Criteria: Trends in Demographics and Labor M...
 
An Economic Situation Update with Bruce Yandle
An Economic Situation Update with Bruce YandleAn Economic Situation Update with Bruce Yandle
An Economic Situation Update with Bruce Yandle
 
How Can Policymakers and Regulators Better Engage the Internet of Things?
How Can Policymakers and Regulators Better Engage the Internet of Things? How Can Policymakers and Regulators Better Engage the Internet of Things?
How Can Policymakers and Regulators Better Engage the Internet of Things?
 
What Should We Do about Cyber Attacks?
What Should We Do about Cyber Attacks?What Should We Do about Cyber Attacks?
What Should We Do about Cyber Attacks?
 
Tools for Tracking the Economic Impact of Legislation
Tools for Tracking the Economic Impact of LegislationTools for Tracking the Economic Impact of Legislation
Tools for Tracking the Economic Impact of Legislation
 
The Sharing Economy: Perspectives on Policies in the New Economy
The Sharing Economy: Perspectives on Policies in the New EconomyThe Sharing Economy: Perspectives on Policies in the New Economy
The Sharing Economy: Perspectives on Policies in the New Economy
 
Sustaining Surface Transportation: Overview of the Highway Trust Fund and Ide...
Sustaining Surface Transportation: Overview of the Highway Trust Fund and Ide...Sustaining Surface Transportation: Overview of the Highway Trust Fund and Ide...
Sustaining Surface Transportation: Overview of the Highway Trust Fund and Ide...
 
Bootleggers and Baptists in the Garden of Good and Evil: Understanding Americ...
Bootleggers and Baptists in the Garden of Good and Evil: Understanding Americ...Bootleggers and Baptists in the Garden of Good and Evil: Understanding Americ...
Bootleggers and Baptists in the Garden of Good and Evil: Understanding Americ...
 
Stephen C. Goss Presentation for Mercatus Center SSDI Panel
Stephen C. Goss Presentation for Mercatus Center SSDI PanelStephen C. Goss Presentation for Mercatus Center SSDI Panel
Stephen C. Goss Presentation for Mercatus Center SSDI Panel
 
David Stapleton Presentation for Mercatus Center SSDI Panel
David Stapleton Presentation for Mercatus Center SSDI PanelDavid Stapleton Presentation for Mercatus Center SSDI Panel
David Stapleton Presentation for Mercatus Center SSDI Panel
 
Jason J. Fichtner Presentation for Mercatus Center SSDI Panel
Jason J. Fichtner Presentation for Mercatus Center SSDI PanelJason J. Fichtner Presentation for Mercatus Center SSDI Panel
Jason J. Fichtner Presentation for Mercatus Center SSDI Panel
 

What Does the Unemployment Rate Mean for Government Spending?

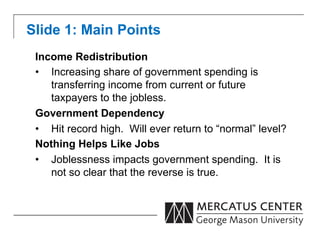
  • 1. Slide 1: Main Points Income Redistribution •  Increasing share of government spending is transferring income from current or future taxpayers to the jobless. Government Dependency •  Hit record high. Will ever return to “normal” level? Nothing Helps Like Jobs •  Joblessness impacts government spending. It is not so clear that the reverse is true.
  • 2. Slide  2:  Employment  Ra1o   66%   64%   share  of  working  age  popula1on   10.5  million  jobs   62%   60%   58%   shaded  areas  denote  recession   56%   1990   1995   2000   2005   2010   Source:  Bureau  of  Labor  Sta8s8cs   Produced  by  Keith  Hall  ,  Mercatus  Center  at  George  Mason  University.  
  • 3. Slide 3: Unemployment Impact on Government Three types of effects: 1.  Slower growth of income slows tax revenue 2.  Government spending on unemployed Increases 3.  Government spending on low-income families increases
  • 4. Slide  4:    Loss  of  Na1onal  Income   $18   $16   $14   Poten8al  GDP   trillions  of  2012  dollars   $12   GDP   $10   $8   Loss  =  $1  trillion/year   $6   $4   $2   shaded  areas  denote  recession   $0   1960   1965   1970   1975   1980   1985   1990   1995   2000   2005   2010   Source:  Bureau  of  Economic  Analysis,  Congressional  Budget  Office   Produced  by  Keith  Hall  ,  Mercatus  Center  at  George  Mason  University.  
  • 5. Slide  5:  Current  Gov’t  Receipts  &  Expenditures   (share  of  GDP)   40%   35%   30%   25%   Percent   20%   Current  expenditures   15%   Current  receipts   10%   shaded  areas  denote  recession   5%   0%   1950   1955   1960   1965   1970   1975   1980   1985   1990   1995   2000   2005   2010   Source:  Bureau  of  Economic  Analysis,   Produced  by  Keith  Hall  ,  Mercatus  Center  at  George  Mason  University.  
  • 6. Slide 6: How Does Government Spending Enter Into GDP? Four Main Types of Government Spending 1.  *Government Consumption (46%) 2.  *Government Investment (8%) 3.  Transfer Payments (43%) 4.  Interest Payments (8%) *part of GDP
  • 7. Slide 7: Federal Government Spending and GDP Four Main Types of Government Spending 1.  *Government Consumption (27%) 2.  *Government Investment (4%) 3.  Grants-In-Aid to S&L Govt (12%) 4.  Other Transfer Payments (47%) 5.  Interest Payments (8%)
  • 8. Slide  8:    Government  Spending  by  Type   (share  of  GDP)   25%   19.5%  of  GDP  in  2012   20%   Consump8on  &  Gross  Investment   Social  Benefits   15%   percent   Interest  Payments   10%   5%   shaded  areas  denote  recession   0%   1960   1965   1970   1975   1980   1985   1990   1995   2000   2005   2010   Source:  Bureau  of  Economic  Analysis   Produced  by  Keith  Hall  ,  Mercatus  Center  at  George  Mason  University.  
  • 9. Slide  9:    Changing  Role  of  Federal  Government   (share  of  GDP)   15%   Consump8on  &  Gross  Investment   Social  Benefits   Interest  Payments   Grants-­‐in-­‐aid  to  state  and  local  governments   10%   percent   5%   shaded  areas  denote  recession   0%   1960   1965   1970   1975   1980   1985   1990   1995   2000   2005   2010   Source:  Bureau  of  Economic  Analysis   Produced  by  Keith  Hall  ,  Mercatus  Center  at  George  Mason  University.  
  • 10. Slide  10:    Rise  of  Dependency   Social  Benefit  as  Share  of  Personal  Income     20%   18%   16%   14%   12%   percent   10%   8%   6%   4%   2%   shaded  areas  denote  recession   0%   1960   1965   1970   1975   1980   1985   1990   1995   2000   2005   2010   Source:  Bureau  of  Economic  Analysis   Produced  by  Keith  Hall  ,  Mercatus  Center  at  George  Mason  University.  
  • 11. Slide  11:  Receipt  of  Social  Benefits  by  Type   15%   shaded  areas  denote  recession   Unemployment  Compensa8on   Other  Social  Benefits   Means  Tested  Spending  (approximate)   share  of  personal  income   10%   5%   0%   1960   1965   1970   1975   1980   1985   1990   1995   2000   2005   2010   Source:  Bureau  of  Economic  Analysis   Produced  by  Keith  Hall  ,  Mercatus  Center  at  George  Mason  University.  
  • 12. Slide 12: Programs Targeting the Unemployed 1.  Unemployment Insurance •  Unemployment Compensation •  Trade Adjustment Assistance •  Disaster Unemployment Assistance 2.  Healthcare Assistance •  Health Coverage Tax Credit •  Consolidated Omnibus Budget Reconciliation Act of 1985 (COBRA) 3.  Job Search and Training Assistance •  Workforce Investment Act of 1998 •  Wagner-Peyser Act of 1933
  • 13. Slide  13:  Unemployment  Compensa1on     $180   $160   $140   billlions  of  current  dollars   Emergency   $120   Other   $100   $80   $60   shaded  areas  denote  recession   $40   $20   $0   1960   1965   1970   1975   1980   1985   1990   1995   2000   2005   2010   Source:  Bureau  of  Economic  Analysis   Produced  by  Keith  Hall  ,  Mercatus  Center  at  George  Mason  University.  
  • 14. Slide 14: Means-Tested Programs •  Low income, available regardless of employment status •  126 different federal programs •  Largest programs (billions) o  Medicaid  –  $417.3   o  Supplemental  Nutri8onal  Asst  Program  (SNAP)  –$74.6   o  Supplemental  Security  Income  –  $52.6   o  Earned  Income  Tax  Credit  -­‐-­‐  $56.6   o  Child  Tax  Credit  –  $28.3   o  Federal  Pell  Grants  -­‐  $41   o  Temporary  Assistance  for  Needy  Families  (TANF)  –  $21  
  • 15. Slide  15:  Trends  in  Social  Benefits     and  the  Jobless  Rate   25%   50%   share  of  working  age  popula1on   20%   45%   share  of  personal  income   15%   40%   10%   35%   Social  Benefits   5%   Jobless  Rate  (right  axis)   30%   shaded  areas  denote  recession   0%   25%   1960   1965   1970   1975   1980   1985   1990   1995   2000   2005   2010   Source:  Bureau  of  Economic  Analysis,  Bureau  of  Labor  Sta8s8cs   Produced  by  Keith  Hall  ,  Mercatus  Center  at  George  Mason  University.  
  • 16. Slide  16:    Trends  in  the  Poverty     and  Jobless  Rates   25%   50%   share  of  working  age  popula1on   20%   45%   share  of  popula1on   15%   40%   10%   35%   Poverty  Rate   5%   30%   Jobless  Rate  (right  axis)   0%   25%   1960   1965   1970   1975   1980   1985   1990   1995   2000   2005   2010   Source:  Census  Bureau,  Bureau  of  Labor  Sta8s8cs   Produced  by  Keith  Hall  ,  Mercatus  Center  at  George  Mason  University.