More Related Content
More from Mekko Graphics (20)
Segmented Email Campaign Analysis
- 1. Copyright 2012 © Knowledge Management Associates, LLC. All rights reserved.
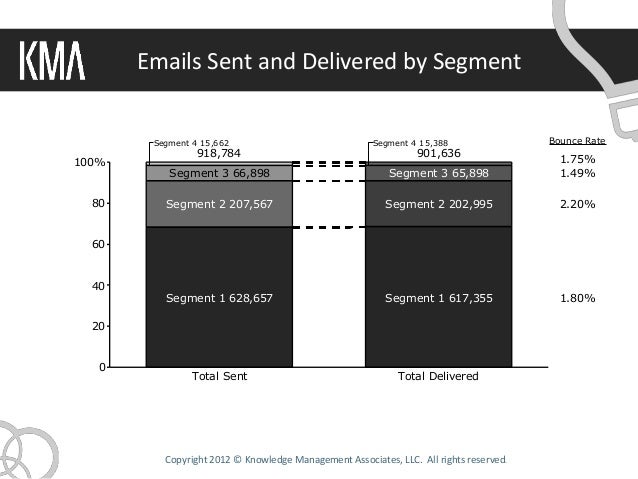
Emails Sent and Delivered by Segment
0
20
40
60
80
100%
Total Sent
Segment 1 628,657
Segment 2 207,567
Segment 3 66,898
Segment 4 15,662
918,784
Total Delivered
Segment 1 617,355
Segment 2 202,995
Segment 3 65,898
Segment 4 15,388
901,636
1.80%
2.20%
1.49%
1.75%
Bounce Rate
- 2. Copyright 2012 © Knowledge Management Associates, LLC. All rights reserved.
Bounce Rate by Segment
0.0
0.5
1.0
1.5
2.0
2.5%
Segment 2
2.20%
Segment 1
1.80%
Segment 4
1.75%
Segment 3
1.49%
- 3. Copyright 2012 © Knowledge Management Associates, LLC. All rights reserved.
• The first chart provides a summary of a segmented
email campaign. It presents the relative size of each
segment and its corresponding bounce rate.
• The second chart is a simpler way of displaying
bounce rate, but does not capture segment size
information.
• For more details see my blog post:
http://www.mekkographics.com/measuring-the-…email-campaign/
Notes