SlideShare ist ein Scribd-Unternehmen logo
1 von 4
0
20
40
60
80
100%
2010 IT Spend by Vertical Market
IT Spend in Millions of Dollars
Financial Services $515,927M
Public Sector $459,969M
Manufacturing $436,024M
Communications $206,386M
Retail $214,161M
Services $175,046M
Utilities $118,218M
Transporation $101,711M
Healthcare $82,207M
$2,335,454M
Agriculture, Mining and Construction $25,805M
IT Spend by Vertical Market
Use a 100% stacked bar chart to break down IT spend by vertical market. With 10
verticals, some of the segments are very small.
0
20
40
60
80
100%
2010 IT Spend by Vertical Market
IT Spend in Millions of Dollars
Financial Services $515,927M
Public Sector $459,969M
Manufacturing $436,024M
Communications $206,386M
Retail $214,161M
Services $175,046M
Other Verticals $327,941M
$2,335,454M
IT Spend by Vertical Market--Summary
You can group the smaller segments into an “Other” series. This function is in
“Format Series -> Other Series.”
0
20
40
60
80
100%
2010 IT Spend by Vertical Market
IT Spend in Millions of Dollars
Financial Services $515,927M
Public Sector $459,969M
Manufacturing $436,024M
Communications $206,386M
Retail $214,161M
Services $175,046M
Other Verticals $327,941M
$2,335,454M
Other Verticals
Utilities $118,218M
Transporation $101,711M
Healthcare $82,207M
Agriculture, Mining and Construction
$25,805M
$327,941M
IT Spend by Vertical Market--Summary
If you need to see the details of the Other Series, use an second (exploding) bar.
Notes
• These three charts can be used as part of a
presentation on IT Spend.
The data come from Gartner:
http://www.financialexecutives.org/eweb/upload/FEI/Gartner.pdf
• For more details see my blog post:
http://www.mekkographics.com/show-it-spend-by-vertical-market-in-a-
100-stacked-bar-chart/

Weitere ähnliche Inhalte

Was ist angesagt?

The latest Canadian US Patent Competitive Intelligence Database (2018/8/7)
The latest Canadian US Patent Competitive Intelligence Database (2018/8/7)The latest Canadian US Patent Competitive Intelligence Database (2018/8/7)
The latest Canadian US Patent Competitive Intelligence Database (2018/8/7)Muchiu (Henry) Chang, PhD. Cantab
 
The latest Canadian US Patent Competitive Intelligence Database (2018/9/4)
The latest Canadian US Patent Competitive Intelligence Database (2018/9/4)The latest Canadian US Patent Competitive Intelligence Database (2018/9/4)
The latest Canadian US Patent Competitive Intelligence Database (2018/9/4)Muchiu (Henry) Chang, PhD. Cantab
 
[Infographic] Emerging Mobility Trends in Field Services
[Infographic] Emerging Mobility Trends in Field Services[Infographic] Emerging Mobility Trends in Field Services
[Infographic] Emerging Mobility Trends in Field ServicesTSIA
 
AT&S Annual Report 2019/20
AT&S Annual Report 2019/20AT&S Annual Report 2019/20
AT&S Annual Report 2019/20AT&S_IR
 
TIM - Meeting with Investors - October 2015
TIM - Meeting with Investors - October 2015TIM - Meeting with Investors - October 2015
TIM - Meeting with Investors - October 2015TIM RI
 
Meeting with Investors - June 2015
Meeting with Investors - June 2015Meeting with Investors - June 2015
Meeting with Investors - June 2015TIM RI
 

Was ist angesagt? (6)

The latest Canadian US Patent Competitive Intelligence Database (2018/8/7)
The latest Canadian US Patent Competitive Intelligence Database (2018/8/7)The latest Canadian US Patent Competitive Intelligence Database (2018/8/7)
The latest Canadian US Patent Competitive Intelligence Database (2018/8/7)
 
The latest Canadian US Patent Competitive Intelligence Database (2018/9/4)
The latest Canadian US Patent Competitive Intelligence Database (2018/9/4)The latest Canadian US Patent Competitive Intelligence Database (2018/9/4)
The latest Canadian US Patent Competitive Intelligence Database (2018/9/4)
 
[Infographic] Emerging Mobility Trends in Field Services
[Infographic] Emerging Mobility Trends in Field Services[Infographic] Emerging Mobility Trends in Field Services
[Infographic] Emerging Mobility Trends in Field Services
 
AT&S Annual Report 2019/20
AT&S Annual Report 2019/20AT&S Annual Report 2019/20
AT&S Annual Report 2019/20
 
TIM - Meeting with Investors - October 2015
TIM - Meeting with Investors - October 2015TIM - Meeting with Investors - October 2015
TIM - Meeting with Investors - October 2015
 
Meeting with Investors - June 2015
Meeting with Investors - June 2015Meeting with Investors - June 2015
Meeting with Investors - June 2015
 

Ähnlich wie Mapping IT Spend in Mekko Graphics

texas instruments Earnings Release 2008 4th
texas instruments Earnings Release 2008 4thtexas instruments Earnings Release 2008 4th
texas instruments Earnings Release 2008 4thfinance19
 
Seminario CoreaArgentina Sep09
Seminario CoreaArgentina Sep09Seminario CoreaArgentina Sep09
Seminario CoreaArgentina Sep09Alejandro Prince
 
240 clearchanne
240  clearchanne240  clearchanne
240 clearchannefinance31
 
KDD capabilities 2016 v1.0
KDD capabilities 2016 v1.0KDD capabilities 2016 v1.0
KDD capabilities 2016 v1.0KDDanalytics
 
The Power conversion component market in India2008
The Power conversion component market in India2008The Power conversion component market in India2008
The Power conversion component market in India2008Soumya Dhar
 
IT Enabled Services
IT Enabled ServicesIT Enabled Services
IT Enabled ServicesAnurag Dua
 
Go99 highlights Technology impacting Supply Chain - Tech Trends
Go99 highlights Technology impacting Supply Chain - Tech TrendsGo99 highlights Technology impacting Supply Chain - Tech Trends
Go99 highlights Technology impacting Supply Chain - Tech TrendsArch Engineers
 
Tracxn - 3D Printing - Industry Applications - Top Business Models - Jun 2021
Tracxn - 3D Printing - Industry Applications - Top Business Models - Jun 2021Tracxn - 3D Printing - Industry Applications - Top Business Models - Jun 2021
Tracxn - 3D Printing - Industry Applications - Top Business Models - Jun 2021Tracxn
 
Q3 2001 Earnings Release
Q3 2001 Earnings ReleaseQ3 2001 Earnings Release
Q3 2001 Earnings Releasefinance7
 
Financial Projection PowerPoint Presentation Slides
Financial Projection PowerPoint Presentation Slides Financial Projection PowerPoint Presentation Slides
Financial Projection PowerPoint Presentation Slides SlideTeam
 
Q4 2007 Earnings Press Release and Financial Tables
Q4 2007 Earnings Press Release and Financial TablesQ4 2007 Earnings Press Release and Financial Tables
Q4 2007 Earnings Press Release and Financial Tablesfinance7
 
Internet Of Things Market Analysis Powerpoint Presentation Slides
Internet Of Things Market Analysis Powerpoint Presentation SlidesInternet Of Things Market Analysis Powerpoint Presentation Slides
Internet Of Things Market Analysis Powerpoint Presentation SlidesSlideTeam
 
Business Case_DEM_Mohan_05042019.pptx
Business Case_DEM_Mohan_05042019.pptxBusiness Case_DEM_Mohan_05042019.pptx
Business Case_DEM_Mohan_05042019.pptxMohan Guntupalli
 
Tracxn - Industrial Internet of Things Startup Landscape
Tracxn - Industrial Internet of Things Startup LandscapeTracxn - Industrial Internet of Things Startup Landscape
Tracxn - Industrial Internet of Things Startup LandscapeAmar Christy
 
Tracxn - B2B E-Commerce Startup Landscape
Tracxn - B2B E-Commerce Startup LandscapeTracxn - B2B E-Commerce Startup Landscape
Tracxn - B2B E-Commerce Startup LandscapeTracxn
 
Technology Economics: Economics of Computing - The Internal Combustion Mainframe
Technology Economics: Economics of Computing - The Internal Combustion MainframeTechnology Economics: Economics of Computing - The Internal Combustion Mainframe
Technology Economics: Economics of Computing - The Internal Combustion MainframeIBM India Smarter Computing
 
alltel 01 atar
alltel 01 ataralltel 01 atar
alltel 01 atarfinance27
 
Tracxn - Top Business Models - France Tech - Mar 2022
Tracxn  - Top Business Models - France Tech - Mar 2022Tracxn  - Top Business Models - France Tech - Mar 2022
Tracxn - Top Business Models - France Tech - Mar 2022Tracxn
 

Ähnlich wie Mapping IT Spend in Mekko Graphics (20)

texas instruments Earnings Release 2008 4th
texas instruments Earnings Release 2008 4thtexas instruments Earnings Release 2008 4th
texas instruments Earnings Release 2008 4th
 
Salestech Market Size
Salestech Market SizeSalestech Market Size
Salestech Market Size
 
Seminario CoreaArgentina Sep09
Seminario CoreaArgentina Sep09Seminario CoreaArgentina Sep09
Seminario CoreaArgentina Sep09
 
240 clearchanne
240  clearchanne240  clearchanne
240 clearchanne
 
KDD capabilities 2016 v1.0
KDD capabilities 2016 v1.0KDD capabilities 2016 v1.0
KDD capabilities 2016 v1.0
 
The Power conversion component market in India2008
The Power conversion component market in India2008The Power conversion component market in India2008
The Power conversion component market in India2008
 
IT Enabled Services
IT Enabled ServicesIT Enabled Services
IT Enabled Services
 
Go99 highlights Technology impacting Supply Chain - Tech Trends
Go99 highlights Technology impacting Supply Chain - Tech TrendsGo99 highlights Technology impacting Supply Chain - Tech Trends
Go99 highlights Technology impacting Supply Chain - Tech Trends
 
Tracxn - 3D Printing - Industry Applications - Top Business Models - Jun 2021
Tracxn - 3D Printing - Industry Applications - Top Business Models - Jun 2021Tracxn - 3D Printing - Industry Applications - Top Business Models - Jun 2021
Tracxn - 3D Printing - Industry Applications - Top Business Models - Jun 2021
 
Q3 2001 Earnings Release
Q3 2001 Earnings ReleaseQ3 2001 Earnings Release
Q3 2001 Earnings Release
 
Financial Projection PowerPoint Presentation Slides
Financial Projection PowerPoint Presentation Slides Financial Projection PowerPoint Presentation Slides
Financial Projection PowerPoint Presentation Slides
 
Q4 2007 Earnings Press Release and Financial Tables
Q4 2007 Earnings Press Release and Financial TablesQ4 2007 Earnings Press Release and Financial Tables
Q4 2007 Earnings Press Release and Financial Tables
 
Internet Of Things Market Analysis Powerpoint Presentation Slides
Internet Of Things Market Analysis Powerpoint Presentation SlidesInternet Of Things Market Analysis Powerpoint Presentation Slides
Internet Of Things Market Analysis Powerpoint Presentation Slides
 
Business Case_DEM_Mohan_05042019.pptx
Business Case_DEM_Mohan_05042019.pptxBusiness Case_DEM_Mohan_05042019.pptx
Business Case_DEM_Mohan_05042019.pptx
 
Tracxn - Industrial Internet of Things Startup Landscape
Tracxn - Industrial Internet of Things Startup LandscapeTracxn - Industrial Internet of Things Startup Landscape
Tracxn - Industrial Internet of Things Startup Landscape
 
Tracxn - B2B E-Commerce Startup Landscape
Tracxn - B2B E-Commerce Startup LandscapeTracxn - B2B E-Commerce Startup Landscape
Tracxn - B2B E-Commerce Startup Landscape
 
Technology Economics: Economics of Computing - The Internal Combustion Mainframe
Technology Economics: Economics of Computing - The Internal Combustion MainframeTechnology Economics: Economics of Computing - The Internal Combustion Mainframe
Technology Economics: Economics of Computing - The Internal Combustion Mainframe
 
Goodwill & Impairments Study
Goodwill & Impairments StudyGoodwill & Impairments Study
Goodwill & Impairments Study
 
alltel 01 atar
alltel 01 ataralltel 01 atar
alltel 01 atar
 
Tracxn - Top Business Models - France Tech - Mar 2022
Tracxn  - Top Business Models - France Tech - Mar 2022Tracxn  - Top Business Models - France Tech - Mar 2022
Tracxn - Top Business Models - France Tech - Mar 2022
 

Mehr von Mekko Graphics

US Covid-19 Deaths in Long-Term Care
US Covid-19 Deaths in Long-Term CareUS Covid-19 Deaths in Long-Term Care
US Covid-19 Deaths in Long-Term CareMekko Graphics
 
COVID-19 Cases by Country
COVID-19 Cases by CountryCOVID-19 Cases by Country
COVID-19 Cases by CountryMekko Graphics
 
CARES Act $2T Stimulus Bill
CARES Act $2T Stimulus BillCARES Act $2T Stimulus Bill
CARES Act $2T Stimulus BillMekko Graphics
 
Global Entertainment Market
Global Entertainment MarketGlobal Entertainment Market
Global Entertainment MarketMekko Graphics
 
Child Malnutrition Worldwide
Child Malnutrition WorldwideChild Malnutrition Worldwide
Child Malnutrition WorldwideMekko Graphics
 
Billionaires and Their Wealth
Billionaires and Their WealthBillionaires and Their Wealth
Billionaires and Their WealthMekko Graphics
 
Ask the Expert webinar February 2019
Ask the Expert webinar February 2019Ask the Expert webinar February 2019
Ask the Expert webinar February 2019Mekko Graphics
 
Profile of America's Homeless
Profile of America's HomelessProfile of America's Homeless
Profile of America's HomelessMekko Graphics
 
Ten Worst US Traffic Corridors
Ten Worst US Traffic CorridorsTen Worst US Traffic Corridors
Ten Worst US Traffic CorridorsMekko Graphics
 
Netflix Q1 2018 Results
Netflix Q1 2018 ResultsNetflix Q1 2018 Results
Netflix Q1 2018 ResultsMekko Graphics
 
Smartphone Sales Growth
Smartphone Sales GrowthSmartphone Sales Growth
Smartphone Sales GrowthMekko Graphics
 
Amazon's Record Revenue Quarter
Amazon's Record Revenue QuarterAmazon's Record Revenue Quarter
Amazon's Record Revenue QuarterMekko Graphics
 
Automating Your Charts
Automating Your ChartsAutomating Your Charts
Automating Your ChartsMekko Graphics
 
Mastering Chart Selection
Mastering Chart SelectionMastering Chart Selection
Mastering Chart SelectionMekko Graphics
 
June 2017 Webinar: Tips and Tricks
June 2017 Webinar: Tips and TricksJune 2017 Webinar: Tips and Tricks
June 2017 Webinar: Tips and TricksMekko Graphics
 
Choosing the Right Chart: Strategies for Effectively Presenting Data
Choosing the Right Chart: Strategies for Effectively Presenting DataChoosing the Right Chart: Strategies for Effectively Presenting Data
Choosing the Right Chart: Strategies for Effectively Presenting DataMekko Graphics
 

Mehr von Mekko Graphics (20)

US Covid-19 Deaths in Long-Term Care
US Covid-19 Deaths in Long-Term CareUS Covid-19 Deaths in Long-Term Care
US Covid-19 Deaths in Long-Term Care
 
COVID-19 Deaths
COVID-19 DeathsCOVID-19 Deaths
COVID-19 Deaths
 
COVID-19 Cases by Country
COVID-19 Cases by CountryCOVID-19 Cases by Country
COVID-19 Cases by Country
 
CARES Act $2T Stimulus Bill
CARES Act $2T Stimulus BillCARES Act $2T Stimulus Bill
CARES Act $2T Stimulus Bill
 
Global Entertainment Market
Global Entertainment MarketGlobal Entertainment Market
Global Entertainment Market
 
Child Malnutrition Worldwide
Child Malnutrition WorldwideChild Malnutrition Worldwide
Child Malnutrition Worldwide
 
Vehicle Buyers by Age
Vehicle Buyers by AgeVehicle Buyers by Age
Vehicle Buyers by Age
 
Billionaires and Their Wealth
Billionaires and Their WealthBillionaires and Their Wealth
Billionaires and Their Wealth
 
Ask the Expert webinar February 2019
Ask the Expert webinar February 2019Ask the Expert webinar February 2019
Ask the Expert webinar February 2019
 
Start-Up Funding
Start-Up FundingStart-Up Funding
Start-Up Funding
 
Profile of America's Homeless
Profile of America's HomelessProfile of America's Homeless
Profile of America's Homeless
 
Ten Worst US Traffic Corridors
Ten Worst US Traffic CorridorsTen Worst US Traffic Corridors
Ten Worst US Traffic Corridors
 
Netflix Q1 2018 Results
Netflix Q1 2018 ResultsNetflix Q1 2018 Results
Netflix Q1 2018 Results
 
Smartphone Sales Growth
Smartphone Sales GrowthSmartphone Sales Growth
Smartphone Sales Growth
 
Analyzing Amazon
Analyzing AmazonAnalyzing Amazon
Analyzing Amazon
 
Amazon's Record Revenue Quarter
Amazon's Record Revenue QuarterAmazon's Record Revenue Quarter
Amazon's Record Revenue Quarter
 
Automating Your Charts
Automating Your ChartsAutomating Your Charts
Automating Your Charts
 
Mastering Chart Selection
Mastering Chart SelectionMastering Chart Selection
Mastering Chart Selection
 
June 2017 Webinar: Tips and Tricks
June 2017 Webinar: Tips and TricksJune 2017 Webinar: Tips and Tricks
June 2017 Webinar: Tips and Tricks
 
Choosing the Right Chart: Strategies for Effectively Presenting Data
Choosing the Right Chart: Strategies for Effectively Presenting DataChoosing the Right Chart: Strategies for Effectively Presenting Data
Choosing the Right Chart: Strategies for Effectively Presenting Data
 

Mapping IT Spend in Mekko Graphics

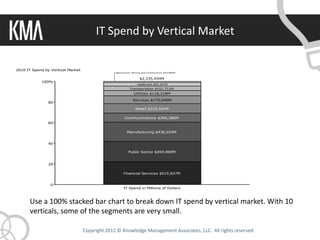
  • 1. 0 20 40 60 80 100% 2010 IT Spend by Vertical Market IT Spend in Millions of Dollars Financial Services $515,927M Public Sector $459,969M Manufacturing $436,024M Communications $206,386M Retail $214,161M Services $175,046M Utilities $118,218M Transporation $101,711M Healthcare $82,207M $2,335,454M Agriculture, Mining and Construction $25,805M IT Spend by Vertical Market Use a 100% stacked bar chart to break down IT spend by vertical market. With 10 verticals, some of the segments are very small.
  • 2. 0 20 40 60 80 100% 2010 IT Spend by Vertical Market IT Spend in Millions of Dollars Financial Services $515,927M Public Sector $459,969M Manufacturing $436,024M Communications $206,386M Retail $214,161M Services $175,046M Other Verticals $327,941M $2,335,454M IT Spend by Vertical Market--Summary You can group the smaller segments into an “Other” series. This function is in “Format Series -> Other Series.”
  • 3. 0 20 40 60 80 100% 2010 IT Spend by Vertical Market IT Spend in Millions of Dollars Financial Services $515,927M Public Sector $459,969M Manufacturing $436,024M Communications $206,386M Retail $214,161M Services $175,046M Other Verticals $327,941M $2,335,454M Other Verticals Utilities $118,218M Transporation $101,711M Healthcare $82,207M Agriculture, Mining and Construction $25,805M $327,941M IT Spend by Vertical Market--Summary If you need to see the details of the Other Series, use an second (exploding) bar.
  • 4. Notes • These three charts can be used as part of a presentation on IT Spend. The data come from Gartner: http://www.financialexecutives.org/eweb/upload/FEI/Gartner.pdf • For more details see my blog post: http://www.mekkographics.com/show-it-spend-by-vertical-market-in-a- 100-stacked-bar-chart/