8 quadratic vertexformsliders
•
1 like•584 views

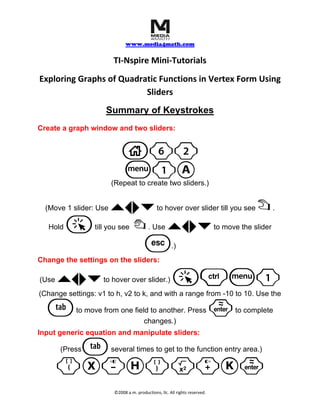
This document provides instructions for creating a graph of a quadratic function using sliders in TI-Nspire. It describes how to create a graph window and two sliders, set the sliders to manipulate the h and k values in the equation y=(x-h)2+k, and input the generic quadratic equation to link it to the sliders. Moving the sliders then dynamically graphs the quadratic with the adjusted h and k values.

Recommended
More Related Content
What's hot
What's hot (20)
Viewers also liked
Viewers also liked (20)
Similar to 8 quadratic vertexformsliders
Similar to 8 quadratic vertexformsliders (16)
More from Media4math
More from Media4math (20)
Recently uploaded
Recently uploaded (20)
8 quadratic vertexformsliders
- 1. www.media4math.com TI‐Nspire Mini‐Tutorials Exploring Graphs of Quadratic Functions in Vertex Form Using Sliders Summary of Keystrokes Create a graph window and two sliders: c62 b1A (Repeat to create two sliders.) `¡¢¤ (Move 1 slider: Use to hover over slider till you see ÷ . Hold a { `¡¢¤ till you see . Use to move the slider d .) Change the settings on the sliders: (Use `¡¢¤ to hover over slider.) a/b1 (Change settings: v1 to h, v2 to k, and with a range from -10 to 10. Use the e to move from one field to another. Press · to complete changes.) Input generic equation and manipulate sliders: e (Press several times to get to the function entry area.) (X-H)q+K· ©2008 a.m. productions, llc. All rights reserved.