SlideShare ist ein Scribd-Unternehmen logo
1 von 6
Downloaden Sie, um offline zu lesen
National Assessment of Oil and Gas

Assessment of Undiscovered Oil and Gas Resources of the
Ordovician Utica Shale of the Appalachian Basin Province,
2012
Introduction                                                                         significant hydrocarbons within the matrix and adsorbed
                                                                                     to organic matter of the shale. These are potentially
      The U.S. Geological Survey (USGS) assessed uncon-                              technically recoverable resources that can be exploited by
ventional oil and gas resources of the Upper Ordovician                              using horizontal drilling combined with hydraulic fractur-
Utica Shale and adjacent units in the Appalachian Basin                              ing techniques.
Province. The assessment covers parts of Maryland, New
York, Ohio, Pennsylvania, Virginia, and West Virginia
(fig. 1). The geologic concept is that black shale of the
                                                                                     Utica Shale Self-Sourced Reservoirs
Utica Shale and adjacent units generated hydrocarbons                                     The Utica Shale and Late Ordovician age equivalents
from Type II organic material in areas that are thermally                            are the primary source rocks in the Utica–Lower Paleo-
mature for oil and gas. The source rocks generated petro-                            zoic Total Petroleum System (TPS) of Milici and others
leum that migrated into adjacent units, but also retained                            (2003). The shales are mainly present in New York, Ohio,
                      84°                 82°                 80°                        78°                76°            74°


                                       LAKE
                                       HURON                                       LAKE ONTARIO                                          VT
                            MI
                   UNITED STATES       CANADA
                                                                                               NY

                                                LAKE ERIE                                                                               MA

            42°


                                                                                                                                        CT


                     OH
                                                                                                       PA                         ATLANTIC
                                                                                                                        NJ
            40°
                                                                                                                                   OCEAN

                                                                                                                        EXPLANATION
                                                                                                                         Utica Shale Gas AU
                                                                                                                         Utica Shale Oil AU
                                                                                                       MD         DE

                                                     WV


                                                                                    VA                                            Assessment
            38°          KY                                         0        50            100 MILES                                Units
                                                                                                                                 Appalachian
                                                                    0   50        100 KILOMETERS
                                                                                                                                 Basin
                                                                                                                                 Province


                  Figure 1.  Location of the oil and gas assessment units (AU) for the Utica Shale in the Appalachian Basin Province.

U.S. Department of the Interior                                                                                                        Fact Sheet 2012–3116
U.S. Geological Survey                                                                                                                      September 2012
Pennsylvania, and West Virginia. For this assessment,                             mature Utica source rocks underlies most of the TPS. The
black shale facies of the Utica are combined with equiva-                         Utica source rocks are within a thermal region that gener-
lent units — Antes Shale in central Pennsylvania and                              ates oil between a CAI of 1 to 2 and generates gas above 2
the Point Pleasant Formation in Ohio and Pennsylvania                             (fig. 3; Ryder, 2008).
(Patchen and others, 2006). Thickness of the black shale
facies is as much as 700 ft in southwestern Pennsylvania                          Geologic Model for Assessment
(Patchen and others, 2006) and New York (Ryder, 2008),
                                                                                       The geologic model used in the assessment of the
but typically ranges from 150 to 350 ft (Ryder, 2008).
                                                                                  Utica Shale and adjacent organic-rich shale is that oil
     The facies consist of calcareous to clay-rich mudrock
                                                                                  and gas were generated in the organic-rich shale and
with total organic carbon (TOC) values commonly in                                occupies matrix porosity as well as organic porosity in
excess of 1 weight percent (wt %) (fig. 2). There is a                            the same shale. A TOC lower cutoff of 1 wt % was used
broad northeast-southwest-trending area that extends                              for potential source rocks. The thermal window for oil
across western and southern Pennsylvania, eastern Ohio,                           was based on a CAI greater than 1, and the window for
northern West Virginia, and southeastern New York where                           gas and oil cracking to gas used a CAI of 2. A comparison
TOC values are in the 2 to 3 wt % range (fig. 2; Wallace                          of preliminary production from the Utica in southeastern
and Roen, 1989; Ryder and others, 1998). The Utica is an                          Ohio confirmed that a CAI of 2 approximates the oil/ gas
oil-prone source rock containing Type II kerogen (Ryder                           boundary in eastern Ohio with some degree of confidence;
and others, 1998). Conodont color alteration index (CAI)                          however, all contour lines are subject to geologic uncer-
isograds (fig. 3), based on samples from the Ordovician                           tainty. The oil/gas boundary is based on a gas-to-oil ratio
rocks (Repetski and others, 2008), indicate that a pod of                         of 20,000 cubic feet of natural gas per barrel of oil. The

              84°                 82°                   80°                         78°               76°                 74°

                              LAKE
                              HURON
                                                                              LAKE ONTARIO                                                  VT
                    MI

         UNITED STATES         CANADA


                                        LAKE ERIE                                                                        NY              MA

  42°                                                                                             2
                                                              1
                                                                                                                                         CT


          1

                                             3
                                                                                                       PA              NJ
  40°                                                                                                                            ATLANTIC
                                                                                                                                  OCEAN
               1                         2
                                                                                                 MD

                     OH                                                                                            EXPLANATION
                                                       WV                                                   DE
                                                                                                                    Utica Shale extent

                                                                                                                    Point Pleasant
                                                                               VA
                                                                                                                    Formation extent
  38°           KY                                        0            50            100 MILES
                                                                                                                    TOC in weight percent

                                                          0       50        100 KILOMETERS


        Figure 2.  Map of total organic carbon (TOC) in weight percent from Ryder (2008), and mapped southern limit of Utica Shale (blue
        line) and mapped northern extent of the Point Pleasant Formation (purple line) from Patchen and others (2006).
84°                    82°                    80°                      78°                    76°                          74°


                                LAKE                                                   LAKE
                                HURON                                                 ONTARIO                                  NY                  VT

                   MI

          UNITED STATES          CANADA

                                           LAKE ERIE                                                                                               MA

   42°                                                                              3 4
                                                                                                      5                                            CT


                     1
             OH
                                           2                                                                      PA              NJ
   40°
                                                                                                                                              ATLANTIC
                                                                                                                                               OCEAN


                                                                                                      MD
                                                                                                                   DE

                                                                                                                 EXPLANATION
                                                                               VA                                Area of combined AUs

   38°                                                       0           50               100 MILES              CAI
                                               WV
              KY                                             0      50        100 KILOMETERS


         Figure 3.  Map of conodont alteration index (CAI) for the Utica Oil and Gas Assessment Units (AU) after Repetski and others
         (2008, their fig. 5). The 1+ isograd is used to estimate the generation threshold for oil; the 2 isograd is used to estimate the gas
         threshold.


Utica has little history of production, therefore produc-                            The Utica Shale Gas AU “sweet spot” is defined as
tion data were supplemented with analog data from the                           an area in which Utica Shale and equivalents contain TOC
Devonian Marcellus Shale, Cretaceous Eagle Ford Shale,                          greater than 2 wt % and also is underlain by the black
and Cretaceous Niobrara Formation. The Marcellus is                             shale facies of the Point Pleasant Formation (fig. 4). A
an analog mainly for its proximity and similar geologic                         possible limiting factor for the sweet spot is whether the
setting, and the Cretaceous units for their facies similarity.                  Point Pleasant in Ohio and Pennsylvania forms a continu-
Analog data include estimated ultimate recoveries (EUR),                        ous accumulation with the lower part of the Utica Shale
mean drainage areas of wells, and ranges of well success                        (Flat Creek Member) in New York. A further limiting
ratios. Key assessment input data are listed in table 1.                        factor is the possible degradation of reservoir quality in
                                                                                both the deeper and shallower parts of the AU. The sweet
Assessment Units                                                                spot has been modified to encompass current drilling in
     The Utica Shale Gas Assessment Unit (AU) is defined                        the AU where EURs are greater than the minimum cutoff
where the thermal maturity of the organic matter is greater                     of 0.02 billion cubic feet of gas (BCFG).
than a CAI of 2 (fig. 3) and by several constraints that                             The Utica Shale Oil AU (fig. 1) is defined by the
determine the boundaries: total organic carbon (TOC) of                         presence of the Utica Shale and equivalents based on
greater than 1 wt % (fig. 2), the Allegheny structural front                    Ryder (2008) and Patchen and others (2006). It is limited
to the southeast, the outcrop of the Utica in New York to                       to an area of the Utica that has a thermal maturity greater
the east, and where the unit changes facies into carbonates                     than a CAI of 1 (Repetski and others, 2008) and TOC
to the south (see Patchen and others, 2006) (fig. 1).                           content greater than 1 wt% (Wallace and Roen, 1989;
Table 1.  Key assessment input data for shale oil and shale gas assessment units for the Utica Shale in the Appalachian Basin.
[EUR (estimated ultimate recovery per well), well drainage area, and success ratios are from U.S. shale oil and shale gas analogs. MMBO, million barrels of oil; BCFG,
billion cubic feet of gas; AU, assessment unit; %, percent. The average EUR input is the minimum, median, maximum, and calculated mean]

                                                        Utica Shale Oil AU                                                              Utica Shale Gas AU
     Assessment input data         Minimum            Mode               Maximum             Calculated           Minimum              Mode         Maximum            Calculated
                                                                                               mean                                                                      mean
  Potential production area of   13,500,000        15,000,000       16,500,000             15,000,000           25,800,000       31,600,000       37,400,000         31,600,000
    AU (acres)
  Average drainage area of              150               250                 350                  250                120                150               180             150
    wells (acres)
  Percentage of AU in sweet                 7              14                  22                   14                     9              21                50                 27
    spots (%)
                                                                          Input data for sweet spots
  Average EUR (MMBO, oil;                   0.04            0.08                0.2                      .086              0.2             0.6                1.1               0.619
    BCFG, gas)
  Success ratios (%)                     70                80                  90                   80                    75              85                95                 85
                                                                         Input data for nonsweet spots
  Average EUR (MMBO, oil;                   0.01            0.03                0.1                  0.034                0.04             0.10               0.60              0.128
    BCFG, gas)
  Success ratios (%)                        5              20                  35                   20                    10              40                70                 40


              84°                     82°                          80°                             78°                           76°                        74°

                                 LAKE
                                 HURON
                                                                                             LAKE ONTARIO                                                                VT
                    MI

           UNITED STATES          CANADA                                                                        NY

                                                                                                                                                                         MA

    42°                              LAKE ERIE

                                                                                                                                                                         CT


                OH                                                                                              PA

                                                                                                                                                       NJ
    40°                                                                                                                                                             ATLANTIC
                                                                                                                                                                     OCEAN


                                                                                                                     MD
                                                     WV                                                                                 DE


                                                                                              VA                                 EXPLANATION
                                                                                                                                  Gas maximum sweet spot
    38°         KY                                                   0                50             100 MILES
                                                                                                                                  Oil maximum sweet spot
                                                                     0         50          100 KILOMETERS


          Figure 4.  Map of maximum extent of the oil and gas sweet spots. The boundaries are based on total organic carbon, extent of
          Point Pleasant Formation, and current (2012) understanding of well completions. See table 1 for percentages.
Ryder, 2008) (fig. 2). The downdip limit is placed at a                               wells at the mean to be drilled in the nonsweet spot to
thermal maturity greater than a CAI of 2 (fig. 3). The AU                             extract the resource.
boundary also ends at the United States–Canadian border                                    The Utica Shale Oil AU is an area of about
and where the shale changes facies into carbonates to the                             15,000,000 acres at the mean and is divided into a sweet
south (fig. 1).                                                                       spot and a nonsweet spot. The estimated mean resource
     The Utica Shale Oil AU “sweet spot” encompasses                                  volumes are 940 MMBO (range from 590 to 1,386
an area of Utica Shale and equivalents and the underlying                             MMBO), 939 BCF of associated gas (range from 505
Point Pleasant Formation (fig. 4), where TOC is consis-                               to 1,517 BCF), and 9 MMBNGL (range from 4 to
tently greater than 2 wt% (fig. 2; Repetski and others, 2008;                         16 MMBNGL). Estimates of average drainage area for
Riley and others, 2012). The sweet spot also includes                                 the AU and separate estimates of average EUR and suc-
current wells where EURs are considered to be greater                                 cess ratio are made for the sweet and nonsweet spots
than the minimum of 0.002 million barrels of oil (MMBO).                              (table 1). Because there is a limited amount of existing oil
                                                                                      production from the Utica, EUR distributions for sweet
Resource Summary                                                                      and nonsweet spots are estimated from distributions of
     The USGS assessed technically recoverable continu-                               other shale oil assessment units (U.S. Geological Survey
ous (unconventional) oil and gas resources for the two                                Oil and Gas Assessment Team, 2012, their fig. 4). Based
AUs of the Ordovician Utica and Point Pleasant black                                  on these input parameters, recovery of the resource would
shale of the Appalachian Basin Province, resulting in                                 require at the mean about 7,000 wells to be drilled within
estimated means of 940 MMBO, 38.2 trillion cubic feet of                              the sweet spot and an additional 10,500 wells at the mean
gas (TCFG), and 208 million barrels of natural gas liquids                            to be drilled in the nonsweet spot to extract this potential
(MMBNGL) (table 2).                                                                   resource.

Table 2.  Assessment results for potential unconventional oil and gas resources of Utica Shale in the Appalachian Basin.

[MMBO, million barrels of oil; BCFG, billion cubic feet of gas; MMBNGL, million barrels of natural gas liquids. Results shown are fully risked estimates. For
gas accumulations, all liquids are included under the NGL (natural gas liquids) category. Undiscovered gas resources are the sum of nonassociated and associ-
ated gas. F95 represents a 95 percent chance of at least the amount tabulated–other fractiles are defined similarly. Fractiles are additive under the assumption
of perfect positive correlation. AU probability is the chance of at least one well within the AU having a production capacity of the minimum estimated ultimate
recovery. Gray shading indicates not applicable]

           Provinces,                          Accu-                                         Total undiscovered resources
                                      AU
    Total petroleum systems                    mula-             Oil (MMBO)                           Gas (BCFG)                        NGL (MMBNGL)
                                     prob-
              (TPS),                            tion
                                     ability             F95     F50    F5        Mean       F95     F50      F5     Mean           F95  F50   F5    Mean
   and Assessment Units (AU)                    type
                                                                       Utica-Lower Paleozoic TPS
  Utica Shale Gas AU                   1.0      Gas                                        20,601    35,659    59,415    37,273     71      183      382      199
  Utica Shale Oil AU                   1.0      Oil      590     911      1,386    940        505       897      1,517      939      4         9      16           9
  Total unconventional                                   590     911      1,386    940     21,106    36,556    60,932    38,212     75       192     398      208
  resources


     The Utica Shale Gas AU is an area of about                                       References Cited
31,600,000 acres at the mean and is divided into sweet
                                                                                      Milici, R.C., Ryder, R.T., Swezey, C.S., Charpentier, R.R.,
spot and nonsweet spot areas. The estimated mean
                                                                                       Cook, T.A., Crovelli, R.A., Klett, T.R., Pollastro, R.M.,
resource volumes are 37,273 BCFG (range from 20,601
                                                                                       and Schenk, C.J., 2003, Assessment of undiscovered oil
to 59,415 BCFG) and 199 MMBNGL (range from 71 to
                                                                                       and gas resources of the Appalachian Basin Province,
382 MMBNGL). Estimates of average drainage area are
                                                                                       2002: U.S. Geological Survey Fact Sheet 009-03, 2 p.
made for the AU, and separate estimates of average EUR
and success ratio are made for the sweet and nonsweet                                 Patchen, D.G., Hickman, J.B., Harris, D.C., Drahovzal,
spots (table 1). Because there is a limited amount of                                   J.A., Lake, P.D., Smith, L.B., Nyahay, R., Schulze,
existing gas production from the Utica, EUR distributions                               R., Riley, R.A., Baranoski, M.T., Wickstrom, L.H.,
for sweet spot and nonsweet spots are estimated from                                    Laughrey, C.D., Kostelnik, J., Harper, J.A., Avary, K.L.,
distributions of other shale gas AUs (U.S. Geological                                   Bocan, J., Hohn, M.E., and McDowell, R., 2006, A
Survey Oil and Gas Assessment Team, 2012, their fig. 1).                                geologic play book for Trenton-Black River Appala-
Based on these input parameters, recovery of the potential                              chian Basin exploration: U.S. Department of Energy
resource would require at the mean about 48,000 wells to                                Report, Morgantown, W. Va., DOE Award Number
be drilled within the sweet spot and an additional 62,000                               DE-FC26-03NT41856, 582 p., 30 pls.
Repetski, J.E., Ryder, R.T., Weary, D.J., Harris, A.G., and           U.S. Geological Survey Oil and Gas Assessment Team,
  Trippi, M.H., 2008, Thermal maturity patterns (CAI                    2012, Variability of distributions of well-scale estimated
  and %Ro) in Upper Ordovician and Devonian rocks of                    ultimate recovery for continuous (unconventional) oil
  the Appalachian Basin: A major revision of USGS Map                   and gas resources in the United States: U.S. Geological
  I-917-E using new subsurface collections: U.S. Geo-                   Survey Open-File Report 2012–1118, 18 p.
  logical Survey Scientific Investigations Map 3006,
  41 p., 3 sheets.                                                    Wallace, L.G., and Roen, J.B., 1989, Petroleum source
                                                                       rock potential of the Upper Ordovician black shale
Riley, R.A., Erenpreiss, M.S., and Wells, J.G., 2012, Data             sequence, northern Appalachian Basin: U.S. Geological
  compilation and source rock mapping of the Upper                     Survey Open-File Report 89–488, 66 p.
  Ordovician black shale interval in Ohio: Ohio Depart-
  ment of Natural Resources, Division of Geological
  Survey, contract report funded by U.S. Geological                   Utica Shale Assessment Team
  Survey (00200003512), 29 p.                                             Mark A. Kirschbaum, Christopher J. Schenk (project
Ryder, R.T., 2008, Assessment of Appalachian Basin oil                chief, schenk@usgs.gov), Troy A. Cook, Robert T. Ryder,
  and gas resources: Utica-Lower Paleozoic Total Petro-               Ronald R. Charpentier, Timothy R. Klett, Stephanie B.
  leum System: U.S. Geological Survey Open-File Report                Gaswirth, Marilyn E. Tennyson, Katherine J. Whidden.
  2008–1287, 29 p.
                                                                      For Additional Information
Ryder, R.T., Burruss, R.C., and Hatch, J.R., 1998, Black
  shale source rocks and oil generation in the Cambrian                   Supporting geologic studies of Utica Shale and
  and Ordovician of the central Appalachian Basin, USA:               Assessment Units, and reports on the assessment method-
  American Association of Petroleum Geologists Bulletin,              ology used in the assessment can be found at the USGS
  v. 82, no. 3, p. 412–441.                                           Energy Resources Program website (http://energy.usgs.gov).


                  Hand-tinted photo of Ordovician Utica Shale with interbedded sandstone of the Ordovician
                  Lorraine Shale above, Jefferson County, New York. Photograph 1889 by C.D. Wolcott, third Director
                  of the USGS. http://library photo.cr.usgs.gov.

Weitere ähnliche Inhalte

Mehr von Marcellus Drilling News

Quarterly legislative action update: Marcellus and Utica shale region (4Q16)
Quarterly legislative action update: Marcellus and Utica shale region (4Q16)Quarterly legislative action update: Marcellus and Utica shale region (4Q16)
Quarterly legislative action update: Marcellus and Utica shale region (4Q16)Marcellus Drilling News
 
Access Northeast Pipeline Project - Dec 2016 Update
Access Northeast Pipeline Project - Dec 2016 UpdateAccess Northeast Pipeline Project - Dec 2016 Update
Access Northeast Pipeline Project - Dec 2016 UpdateMarcellus Drilling News
 
Rover Pipeline Letter to FERC Requesting Final Certificate
Rover Pipeline Letter to FERC Requesting Final CertificateRover Pipeline Letter to FERC Requesting Final Certificate
Rover Pipeline Letter to FERC Requesting Final CertificateMarcellus Drilling News
 
DOE Order Granting Elba Island LNG Right to Export to Non-FTA Countries
DOE Order Granting Elba Island LNG Right to Export to Non-FTA CountriesDOE Order Granting Elba Island LNG Right to Export to Non-FTA Countries
DOE Order Granting Elba Island LNG Right to Export to Non-FTA CountriesMarcellus Drilling News
 
LSE Study: Fracking is Revitalizing U.S. Manufacturing
LSE Study: Fracking is Revitalizing U.S. ManufacturingLSE Study: Fracking is Revitalizing U.S. Manufacturing
LSE Study: Fracking is Revitalizing U.S. ManufacturingMarcellus Drilling News
 
Letter From 24 States Asking Trump & Congress to Withdraw the Unlawful Clean ...
Letter From 24 States Asking Trump & Congress to Withdraw the Unlawful Clean ...Letter From 24 States Asking Trump & Congress to Withdraw the Unlawful Clean ...
Letter From 24 States Asking Trump & Congress to Withdraw the Unlawful Clean ...Marcellus Drilling News
 
Report: New U.S. Power Costs: by County, with Environmental Externalities
Report: New U.S. Power Costs: by County, with Environmental ExternalitiesReport: New U.S. Power Costs: by County, with Environmental Externalities
Report: New U.S. Power Costs: by County, with Environmental ExternalitiesMarcellus Drilling News
 
U.S. Crude Oil and Natural Gas Proved Reserves, Year-end 2015
U.S. Crude Oil and Natural Gas Proved Reserves, Year-end 2015U.S. Crude Oil and Natural Gas Proved Reserves, Year-end 2015
U.S. Crude Oil and Natural Gas Proved Reserves, Year-end 2015Marcellus Drilling News
 
U.S. EIA's Drilling Productivity Report - December 2015
U.S. EIA's Drilling Productivity Report - December 2015U.S. EIA's Drilling Productivity Report - December 2015
U.S. EIA's Drilling Productivity Report - December 2015Marcellus Drilling News
 
Velocys Plan to "Build the Business" - Gas-to-Liquids Plants
Velocys Plan to "Build the Business" - Gas-to-Liquids PlantsVelocys Plan to "Build the Business" - Gas-to-Liquids Plants
Velocys Plan to "Build the Business" - Gas-to-Liquids PlantsMarcellus Drilling News
 
PA DEP Revised Permit for Natural Gas Compression Stations, Processing Plants...
PA DEP Revised Permit for Natural Gas Compression Stations, Processing Plants...PA DEP Revised Permit for Natural Gas Compression Stations, Processing Plants...
PA DEP Revised Permit for Natural Gas Compression Stations, Processing Plants...Marcellus Drilling News
 
PA DEP Permit for Unconventional NatGas Well Site Operations and Remote Piggi...
PA DEP Permit for Unconventional NatGas Well Site Operations and Remote Piggi...PA DEP Permit for Unconventional NatGas Well Site Operations and Remote Piggi...
PA DEP Permit for Unconventional NatGas Well Site Operations and Remote Piggi...Marcellus Drilling News
 
PA DEP: Methane Reduction Strategies for Natural Gas Operations
PA DEP: Methane Reduction Strategies for Natural Gas OperationsPA DEP: Methane Reduction Strategies for Natural Gas Operations
PA DEP: Methane Reduction Strategies for Natural Gas OperationsMarcellus Drilling News
 
US EIA's December 2016 Short-Term Energy Outlook
US EIA's December 2016 Short-Term Energy OutlookUS EIA's December 2016 Short-Term Energy Outlook
US EIA's December 2016 Short-Term Energy OutlookMarcellus Drilling News
 
Northeast Gas Association's 2016 Statistical Guide
Northeast Gas Association's 2016 Statistical GuideNortheast Gas Association's 2016 Statistical Guide
Northeast Gas Association's 2016 Statistical GuideMarcellus Drilling News
 
PA PUC Responses to Auditor General's Act 13 Impact Fee Audit
PA PUC Responses to Auditor General's Act 13 Impact Fee AuditPA PUC Responses to Auditor General's Act 13 Impact Fee Audit
PA PUC Responses to Auditor General's Act 13 Impact Fee AuditMarcellus Drilling News
 
Pennsylvania Public Utility Commission Act 13/Impact Fees Audit by PA Auditor...
Pennsylvania Public Utility Commission Act 13/Impact Fees Audit by PA Auditor...Pennsylvania Public Utility Commission Act 13/Impact Fees Audit by PA Auditor...
Pennsylvania Public Utility Commission Act 13/Impact Fees Audit by PA Auditor...Marcellus Drilling News
 
Clyde Mine Discharge/Tenmile Creek Water Quality Final Report
Clyde Mine Discharge/Tenmile Creek Water Quality Final ReportClyde Mine Discharge/Tenmile Creek Water Quality Final Report
Clyde Mine Discharge/Tenmile Creek Water Quality Final ReportMarcellus Drilling News
 
FERC Order Denying Stay of Kinder Morgan's Broad Run Expansion Project
FERC Order Denying Stay of Kinder Morgan's Broad Run Expansion ProjectFERC Order Denying Stay of Kinder Morgan's Broad Run Expansion Project
FERC Order Denying Stay of Kinder Morgan's Broad Run Expansion ProjectMarcellus Drilling News
 
Sixth Circuit Court of Appeals Decision in Harper v Muskingum Watershed Conse...
Sixth Circuit Court of Appeals Decision in Harper v Muskingum Watershed Conse...Sixth Circuit Court of Appeals Decision in Harper v Muskingum Watershed Conse...
Sixth Circuit Court of Appeals Decision in Harper v Muskingum Watershed Conse...Marcellus Drilling News
 

Mehr von Marcellus Drilling News (20)

Quarterly legislative action update: Marcellus and Utica shale region (4Q16)
Quarterly legislative action update: Marcellus and Utica shale region (4Q16)Quarterly legislative action update: Marcellus and Utica shale region (4Q16)
Quarterly legislative action update: Marcellus and Utica shale region (4Q16)
 
Access Northeast Pipeline Project - Dec 2016 Update
Access Northeast Pipeline Project - Dec 2016 UpdateAccess Northeast Pipeline Project - Dec 2016 Update
Access Northeast Pipeline Project - Dec 2016 Update
 
Rover Pipeline Letter to FERC Requesting Final Certificate
Rover Pipeline Letter to FERC Requesting Final CertificateRover Pipeline Letter to FERC Requesting Final Certificate
Rover Pipeline Letter to FERC Requesting Final Certificate
 
DOE Order Granting Elba Island LNG Right to Export to Non-FTA Countries
DOE Order Granting Elba Island LNG Right to Export to Non-FTA CountriesDOE Order Granting Elba Island LNG Right to Export to Non-FTA Countries
DOE Order Granting Elba Island LNG Right to Export to Non-FTA Countries
 
LSE Study: Fracking is Revitalizing U.S. Manufacturing
LSE Study: Fracking is Revitalizing U.S. ManufacturingLSE Study: Fracking is Revitalizing U.S. Manufacturing
LSE Study: Fracking is Revitalizing U.S. Manufacturing
 
Letter From 24 States Asking Trump & Congress to Withdraw the Unlawful Clean ...
Letter From 24 States Asking Trump & Congress to Withdraw the Unlawful Clean ...Letter From 24 States Asking Trump & Congress to Withdraw the Unlawful Clean ...
Letter From 24 States Asking Trump & Congress to Withdraw the Unlawful Clean ...
 
Report: New U.S. Power Costs: by County, with Environmental Externalities
Report: New U.S. Power Costs: by County, with Environmental ExternalitiesReport: New U.S. Power Costs: by County, with Environmental Externalities
Report: New U.S. Power Costs: by County, with Environmental Externalities
 
U.S. Crude Oil and Natural Gas Proved Reserves, Year-end 2015
U.S. Crude Oil and Natural Gas Proved Reserves, Year-end 2015U.S. Crude Oil and Natural Gas Proved Reserves, Year-end 2015
U.S. Crude Oil and Natural Gas Proved Reserves, Year-end 2015
 
U.S. EIA's Drilling Productivity Report - December 2015
U.S. EIA's Drilling Productivity Report - December 2015U.S. EIA's Drilling Productivity Report - December 2015
U.S. EIA's Drilling Productivity Report - December 2015
 
Velocys Plan to "Build the Business" - Gas-to-Liquids Plants
Velocys Plan to "Build the Business" - Gas-to-Liquids PlantsVelocys Plan to "Build the Business" - Gas-to-Liquids Plants
Velocys Plan to "Build the Business" - Gas-to-Liquids Plants
 
PA DEP Revised Permit for Natural Gas Compression Stations, Processing Plants...
PA DEP Revised Permit for Natural Gas Compression Stations, Processing Plants...PA DEP Revised Permit for Natural Gas Compression Stations, Processing Plants...
PA DEP Revised Permit for Natural Gas Compression Stations, Processing Plants...
 
PA DEP Permit for Unconventional NatGas Well Site Operations and Remote Piggi...
PA DEP Permit for Unconventional NatGas Well Site Operations and Remote Piggi...PA DEP Permit for Unconventional NatGas Well Site Operations and Remote Piggi...
PA DEP Permit for Unconventional NatGas Well Site Operations and Remote Piggi...
 
PA DEP: Methane Reduction Strategies for Natural Gas Operations
PA DEP: Methane Reduction Strategies for Natural Gas OperationsPA DEP: Methane Reduction Strategies for Natural Gas Operations
PA DEP: Methane Reduction Strategies for Natural Gas Operations
 
US EIA's December 2016 Short-Term Energy Outlook
US EIA's December 2016 Short-Term Energy OutlookUS EIA's December 2016 Short-Term Energy Outlook
US EIA's December 2016 Short-Term Energy Outlook
 
Northeast Gas Association's 2016 Statistical Guide
Northeast Gas Association's 2016 Statistical GuideNortheast Gas Association's 2016 Statistical Guide
Northeast Gas Association's 2016 Statistical Guide
 
PA PUC Responses to Auditor General's Act 13 Impact Fee Audit
PA PUC Responses to Auditor General's Act 13 Impact Fee AuditPA PUC Responses to Auditor General's Act 13 Impact Fee Audit
PA PUC Responses to Auditor General's Act 13 Impact Fee Audit
 
Pennsylvania Public Utility Commission Act 13/Impact Fees Audit by PA Auditor...
Pennsylvania Public Utility Commission Act 13/Impact Fees Audit by PA Auditor...Pennsylvania Public Utility Commission Act 13/Impact Fees Audit by PA Auditor...
Pennsylvania Public Utility Commission Act 13/Impact Fees Audit by PA Auditor...
 
Clyde Mine Discharge/Tenmile Creek Water Quality Final Report
Clyde Mine Discharge/Tenmile Creek Water Quality Final ReportClyde Mine Discharge/Tenmile Creek Water Quality Final Report
Clyde Mine Discharge/Tenmile Creek Water Quality Final Report
 
FERC Order Denying Stay of Kinder Morgan's Broad Run Expansion Project
FERC Order Denying Stay of Kinder Morgan's Broad Run Expansion ProjectFERC Order Denying Stay of Kinder Morgan's Broad Run Expansion Project
FERC Order Denying Stay of Kinder Morgan's Broad Run Expansion Project
 
Sixth Circuit Court of Appeals Decision in Harper v Muskingum Watershed Conse...
Sixth Circuit Court of Appeals Decision in Harper v Muskingum Watershed Conse...Sixth Circuit Court of Appeals Decision in Harper v Muskingum Watershed Conse...
Sixth Circuit Court of Appeals Decision in Harper v Muskingum Watershed Conse...
 

Kürzlich hochgeladen

15042024_First India Newspaper Jaipur.pdf
15042024_First India Newspaper Jaipur.pdf15042024_First India Newspaper Jaipur.pdf
15042024_First India Newspaper Jaipur.pdfFIRST INDIA
 
lok sabha Elections in india- 2024 .pptx
lok sabha Elections in india- 2024 .pptxlok sabha Elections in india- 2024 .pptx
lok sabha Elections in india- 2024 .pptxdigiyvbmrkt
 
Power in International Relations (Pol 5)
Power in International Relations (Pol 5)Power in International Relations (Pol 5)
Power in International Relations (Pol 5)ssuser583c35
 
Political-Ideologies-and-The-Movements.pptx
Political-Ideologies-and-The-Movements.pptxPolitical-Ideologies-and-The-Movements.pptx
Political-Ideologies-and-The-Movements.pptxSasikiranMarri
 
16042024_First India Newspaper Jaipur.pdf
16042024_First India Newspaper Jaipur.pdf16042024_First India Newspaper Jaipur.pdf
16042024_First India Newspaper Jaipur.pdfFIRST INDIA
 
12042024_First India Newspaper Jaipur.pdf
12042024_First India Newspaper Jaipur.pdf12042024_First India Newspaper Jaipur.pdf
12042024_First India Newspaper Jaipur.pdfFIRST INDIA
 
Geostrategic significance of South Asian countries.ppt
Geostrategic significance of South Asian countries.pptGeostrategic significance of South Asian countries.ppt
Geostrategic significance of South Asian countries.pptUsmanKaran
 
Emerging issues in migration policies.ppt
Emerging issues in migration policies.pptEmerging issues in migration policies.ppt
Emerging issues in migration policies.pptNandinituteja1
 
13042024_First India Newspaper Jaipur.pdf
13042024_First India Newspaper Jaipur.pdf13042024_First India Newspaper Jaipur.pdf
13042024_First India Newspaper Jaipur.pdfFIRST INDIA
 
11042024_First India Newspaper Jaipur.pdf
11042024_First India Newspaper Jaipur.pdf11042024_First India Newspaper Jaipur.pdf
11042024_First India Newspaper Jaipur.pdfFIRST INDIA
 
Mitochondrial Fusion Vital for Adult Brain Function and Disease Understanding...
Mitochondrial Fusion Vital for Adult Brain Function and Disease Understanding...Mitochondrial Fusion Vital for Adult Brain Function and Disease Understanding...
Mitochondrial Fusion Vital for Adult Brain Function and Disease Understanding...The Lifesciences Magazine
 

Kürzlich hochgeladen (12)

15042024_First India Newspaper Jaipur.pdf
15042024_First India Newspaper Jaipur.pdf15042024_First India Newspaper Jaipur.pdf
15042024_First India Newspaper Jaipur.pdf
 
lok sabha Elections in india- 2024 .pptx
lok sabha Elections in india- 2024 .pptxlok sabha Elections in india- 2024 .pptx
lok sabha Elections in india- 2024 .pptx
 
Power in International Relations (Pol 5)
Power in International Relations (Pol 5)Power in International Relations (Pol 5)
Power in International Relations (Pol 5)
 
Political-Ideologies-and-The-Movements.pptx
Political-Ideologies-and-The-Movements.pptxPolitical-Ideologies-and-The-Movements.pptx
Political-Ideologies-and-The-Movements.pptx
 
World Economic Forum : The Global Risks Report 2024
World Economic Forum : The Global Risks Report 2024World Economic Forum : The Global Risks Report 2024
World Economic Forum : The Global Risks Report 2024
 
16042024_First India Newspaper Jaipur.pdf
16042024_First India Newspaper Jaipur.pdf16042024_First India Newspaper Jaipur.pdf
16042024_First India Newspaper Jaipur.pdf
 
12042024_First India Newspaper Jaipur.pdf
12042024_First India Newspaper Jaipur.pdf12042024_First India Newspaper Jaipur.pdf
12042024_First India Newspaper Jaipur.pdf
 
Geostrategic significance of South Asian countries.ppt
Geostrategic significance of South Asian countries.pptGeostrategic significance of South Asian countries.ppt
Geostrategic significance of South Asian countries.ppt
 
Emerging issues in migration policies.ppt
Emerging issues in migration policies.pptEmerging issues in migration policies.ppt
Emerging issues in migration policies.ppt
 
13042024_First India Newspaper Jaipur.pdf
13042024_First India Newspaper Jaipur.pdf13042024_First India Newspaper Jaipur.pdf
13042024_First India Newspaper Jaipur.pdf
 
11042024_First India Newspaper Jaipur.pdf
11042024_First India Newspaper Jaipur.pdf11042024_First India Newspaper Jaipur.pdf
11042024_First India Newspaper Jaipur.pdf
 
Mitochondrial Fusion Vital for Adult Brain Function and Disease Understanding...
Mitochondrial Fusion Vital for Adult Brain Function and Disease Understanding...Mitochondrial Fusion Vital for Adult Brain Function and Disease Understanding...
Mitochondrial Fusion Vital for Adult Brain Function and Disease Understanding...
 

USGS Assessment for Size of Utica Shale

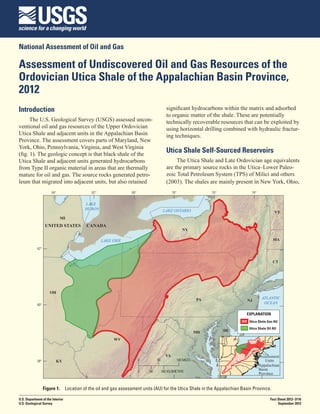
  • 1. National Assessment of Oil and Gas Assessment of Undiscovered Oil and Gas Resources of the Ordovician Utica Shale of the Appalachian Basin Province, 2012 Introduction significant hydrocarbons within the matrix and adsorbed to organic matter of the shale. These are potentially The U.S. Geological Survey (USGS) assessed uncon- technically recoverable resources that can be exploited by ventional oil and gas resources of the Upper Ordovician using horizontal drilling combined with hydraulic fractur- Utica Shale and adjacent units in the Appalachian Basin ing techniques. Province. The assessment covers parts of Maryland, New York, Ohio, Pennsylvania, Virginia, and West Virginia (fig. 1). The geologic concept is that black shale of the Utica Shale Self-Sourced Reservoirs Utica Shale and adjacent units generated hydrocarbons The Utica Shale and Late Ordovician age equivalents from Type II organic material in areas that are thermally are the primary source rocks in the Utica–Lower Paleo- mature for oil and gas. The source rocks generated petro- zoic Total Petroleum System (TPS) of Milici and others leum that migrated into adjacent units, but also retained (2003). The shales are mainly present in New York, Ohio, 84° 82° 80° 78° 76° 74° LAKE HURON LAKE ONTARIO VT MI UNITED STATES CANADA NY LAKE ERIE MA 42° CT OH PA ATLANTIC NJ 40° OCEAN EXPLANATION Utica Shale Gas AU Utica Shale Oil AU MD DE WV VA Assessment 38° KY 0 50 100 MILES Units Appalachian 0 50 100 KILOMETERS Basin Province Figure 1.  Location of the oil and gas assessment units (AU) for the Utica Shale in the Appalachian Basin Province. U.S. Department of the Interior Fact Sheet 2012–3116 U.S. Geological Survey September 2012
  • 2. Pennsylvania, and West Virginia. For this assessment, mature Utica source rocks underlies most of the TPS. The black shale facies of the Utica are combined with equiva- Utica source rocks are within a thermal region that gener- lent units — Antes Shale in central Pennsylvania and ates oil between a CAI of 1 to 2 and generates gas above 2 the Point Pleasant Formation in Ohio and Pennsylvania (fig. 3; Ryder, 2008). (Patchen and others, 2006). Thickness of the black shale facies is as much as 700 ft in southwestern Pennsylvania Geologic Model for Assessment (Patchen and others, 2006) and New York (Ryder, 2008), The geologic model used in the assessment of the but typically ranges from 150 to 350 ft (Ryder, 2008). Utica Shale and adjacent organic-rich shale is that oil The facies consist of calcareous to clay-rich mudrock and gas were generated in the organic-rich shale and with total organic carbon (TOC) values commonly in occupies matrix porosity as well as organic porosity in excess of 1 weight percent (wt %) (fig. 2). There is a the same shale. A TOC lower cutoff of 1 wt % was used broad northeast-southwest-trending area that extends for potential source rocks. The thermal window for oil across western and southern Pennsylvania, eastern Ohio, was based on a CAI greater than 1, and the window for northern West Virginia, and southeastern New York where gas and oil cracking to gas used a CAI of 2. A comparison TOC values are in the 2 to 3 wt % range (fig. 2; Wallace of preliminary production from the Utica in southeastern and Roen, 1989; Ryder and others, 1998). The Utica is an Ohio confirmed that a CAI of 2 approximates the oil/ gas oil-prone source rock containing Type II kerogen (Ryder boundary in eastern Ohio with some degree of confidence; and others, 1998). Conodont color alteration index (CAI) however, all contour lines are subject to geologic uncer- isograds (fig. 3), based on samples from the Ordovician tainty. The oil/gas boundary is based on a gas-to-oil ratio rocks (Repetski and others, 2008), indicate that a pod of of 20,000 cubic feet of natural gas per barrel of oil. The 84° 82° 80° 78° 76° 74° LAKE HURON LAKE ONTARIO VT MI UNITED STATES CANADA LAKE ERIE NY MA 42° 2 1 CT 1 3 PA NJ 40° ATLANTIC OCEAN 1 2 MD OH EXPLANATION WV DE Utica Shale extent Point Pleasant VA Formation extent 38° KY 0 50 100 MILES TOC in weight percent 0 50 100 KILOMETERS Figure 2.  Map of total organic carbon (TOC) in weight percent from Ryder (2008), and mapped southern limit of Utica Shale (blue line) and mapped northern extent of the Point Pleasant Formation (purple line) from Patchen and others (2006).
  • 3. 84° 82° 80° 78° 76° 74° LAKE LAKE HURON ONTARIO NY VT MI UNITED STATES CANADA LAKE ERIE MA 42° 3 4 5 CT 1 OH 2 PA NJ 40° ATLANTIC OCEAN MD DE EXPLANATION VA Area of combined AUs 38° 0 50 100 MILES CAI WV KY 0 50 100 KILOMETERS Figure 3.  Map of conodont alteration index (CAI) for the Utica Oil and Gas Assessment Units (AU) after Repetski and others (2008, their fig. 5). The 1+ isograd is used to estimate the generation threshold for oil; the 2 isograd is used to estimate the gas threshold. Utica has little history of production, therefore produc- The Utica Shale Gas AU “sweet spot” is defined as tion data were supplemented with analog data from the an area in which Utica Shale and equivalents contain TOC Devonian Marcellus Shale, Cretaceous Eagle Ford Shale, greater than 2 wt % and also is underlain by the black and Cretaceous Niobrara Formation. The Marcellus is shale facies of the Point Pleasant Formation (fig. 4). A an analog mainly for its proximity and similar geologic possible limiting factor for the sweet spot is whether the setting, and the Cretaceous units for their facies similarity. Point Pleasant in Ohio and Pennsylvania forms a continu- Analog data include estimated ultimate recoveries (EUR), ous accumulation with the lower part of the Utica Shale mean drainage areas of wells, and ranges of well success (Flat Creek Member) in New York. A further limiting ratios. Key assessment input data are listed in table 1. factor is the possible degradation of reservoir quality in both the deeper and shallower parts of the AU. The sweet Assessment Units spot has been modified to encompass current drilling in The Utica Shale Gas Assessment Unit (AU) is defined the AU where EURs are greater than the minimum cutoff where the thermal maturity of the organic matter is greater of 0.02 billion cubic feet of gas (BCFG). than a CAI of 2 (fig. 3) and by several constraints that The Utica Shale Oil AU (fig. 1) is defined by the determine the boundaries: total organic carbon (TOC) of presence of the Utica Shale and equivalents based on greater than 1 wt % (fig. 2), the Allegheny structural front Ryder (2008) and Patchen and others (2006). It is limited to the southeast, the outcrop of the Utica in New York to to an area of the Utica that has a thermal maturity greater the east, and where the unit changes facies into carbonates than a CAI of 1 (Repetski and others, 2008) and TOC to the south (see Patchen and others, 2006) (fig. 1). content greater than 1 wt% (Wallace and Roen, 1989;
  • 4. Table 1.  Key assessment input data for shale oil and shale gas assessment units for the Utica Shale in the Appalachian Basin. [EUR (estimated ultimate recovery per well), well drainage area, and success ratios are from U.S. shale oil and shale gas analogs. MMBO, million barrels of oil; BCFG, billion cubic feet of gas; AU, assessment unit; %, percent. The average EUR input is the minimum, median, maximum, and calculated mean] Utica Shale Oil AU Utica Shale Gas AU Assessment input data Minimum Mode Maximum Calculated Minimum Mode Maximum Calculated mean mean Potential production area of 13,500,000 15,000,000 16,500,000 15,000,000 25,800,000 31,600,000 37,400,000 31,600,000 AU (acres) Average drainage area of 150 250 350 250 120 150 180 150 wells (acres) Percentage of AU in sweet 7 14 22 14 9 21 50 27 spots (%) Input data for sweet spots Average EUR (MMBO, oil; 0.04 0.08 0.2 .086 0.2 0.6 1.1 0.619 BCFG, gas) Success ratios (%) 70 80 90 80 75 85 95 85 Input data for nonsweet spots Average EUR (MMBO, oil; 0.01 0.03 0.1 0.034 0.04 0.10 0.60 0.128 BCFG, gas) Success ratios (%) 5 20 35 20 10 40 70 40 84° 82° 80° 78° 76° 74° LAKE HURON LAKE ONTARIO VT MI UNITED STATES CANADA NY MA 42° LAKE ERIE CT OH PA NJ 40° ATLANTIC OCEAN MD WV DE VA EXPLANATION Gas maximum sweet spot 38° KY 0 50 100 MILES Oil maximum sweet spot 0 50 100 KILOMETERS Figure 4.  Map of maximum extent of the oil and gas sweet spots. The boundaries are based on total organic carbon, extent of Point Pleasant Formation, and current (2012) understanding of well completions. See table 1 for percentages.
  • 5. Ryder, 2008) (fig. 2). The downdip limit is placed at a wells at the mean to be drilled in the nonsweet spot to thermal maturity greater than a CAI of 2 (fig. 3). The AU extract the resource. boundary also ends at the United States–Canadian border The Utica Shale Oil AU is an area of about and where the shale changes facies into carbonates to the 15,000,000 acres at the mean and is divided into a sweet south (fig. 1). spot and a nonsweet spot. The estimated mean resource The Utica Shale Oil AU “sweet spot” encompasses volumes are 940 MMBO (range from 590 to 1,386 an area of Utica Shale and equivalents and the underlying MMBO), 939 BCF of associated gas (range from 505 Point Pleasant Formation (fig. 4), where TOC is consis- to 1,517 BCF), and 9 MMBNGL (range from 4 to tently greater than 2 wt% (fig. 2; Repetski and others, 2008; 16 MMBNGL). Estimates of average drainage area for Riley and others, 2012). The sweet spot also includes the AU and separate estimates of average EUR and suc- current wells where EURs are considered to be greater cess ratio are made for the sweet and nonsweet spots than the minimum of 0.002 million barrels of oil (MMBO). (table 1). Because there is a limited amount of existing oil production from the Utica, EUR distributions for sweet Resource Summary and nonsweet spots are estimated from distributions of The USGS assessed technically recoverable continu- other shale oil assessment units (U.S. Geological Survey ous (unconventional) oil and gas resources for the two Oil and Gas Assessment Team, 2012, their fig. 4). Based AUs of the Ordovician Utica and Point Pleasant black on these input parameters, recovery of the resource would shale of the Appalachian Basin Province, resulting in require at the mean about 7,000 wells to be drilled within estimated means of 940 MMBO, 38.2 trillion cubic feet of the sweet spot and an additional 10,500 wells at the mean gas (TCFG), and 208 million barrels of natural gas liquids to be drilled in the nonsweet spot to extract this potential (MMBNGL) (table 2). resource. Table 2.  Assessment results for potential unconventional oil and gas resources of Utica Shale in the Appalachian Basin. [MMBO, million barrels of oil; BCFG, billion cubic feet of gas; MMBNGL, million barrels of natural gas liquids. Results shown are fully risked estimates. For gas accumulations, all liquids are included under the NGL (natural gas liquids) category. Undiscovered gas resources are the sum of nonassociated and associ- ated gas. F95 represents a 95 percent chance of at least the amount tabulated–other fractiles are defined similarly. Fractiles are additive under the assumption of perfect positive correlation. AU probability is the chance of at least one well within the AU having a production capacity of the minimum estimated ultimate recovery. Gray shading indicates not applicable] Provinces, Accu- Total undiscovered resources AU Total petroleum systems mula- Oil (MMBO) Gas (BCFG) NGL (MMBNGL) prob- (TPS), tion ability F95 F50 F5 Mean F95 F50 F5 Mean F95 F50 F5 Mean and Assessment Units (AU) type Utica-Lower Paleozoic TPS Utica Shale Gas AU 1.0 Gas 20,601 35,659 59,415 37,273 71 183 382 199 Utica Shale Oil AU 1.0 Oil 590 911 1,386 940 505 897 1,517 939 4 9 16 9 Total unconventional 590 911 1,386 940 21,106 36,556 60,932 38,212 75 192 398 208 resources The Utica Shale Gas AU is an area of about References Cited 31,600,000 acres at the mean and is divided into sweet Milici, R.C., Ryder, R.T., Swezey, C.S., Charpentier, R.R., spot and nonsweet spot areas. The estimated mean Cook, T.A., Crovelli, R.A., Klett, T.R., Pollastro, R.M., resource volumes are 37,273 BCFG (range from 20,601 and Schenk, C.J., 2003, Assessment of undiscovered oil to 59,415 BCFG) and 199 MMBNGL (range from 71 to and gas resources of the Appalachian Basin Province, 382 MMBNGL). Estimates of average drainage area are 2002: U.S. Geological Survey Fact Sheet 009-03, 2 p. made for the AU, and separate estimates of average EUR and success ratio are made for the sweet and nonsweet Patchen, D.G., Hickman, J.B., Harris, D.C., Drahovzal, spots (table 1). Because there is a limited amount of J.A., Lake, P.D., Smith, L.B., Nyahay, R., Schulze, existing gas production from the Utica, EUR distributions R., Riley, R.A., Baranoski, M.T., Wickstrom, L.H., for sweet spot and nonsweet spots are estimated from Laughrey, C.D., Kostelnik, J., Harper, J.A., Avary, K.L., distributions of other shale gas AUs (U.S. Geological Bocan, J., Hohn, M.E., and McDowell, R., 2006, A Survey Oil and Gas Assessment Team, 2012, their fig. 1). geologic play book for Trenton-Black River Appala- Based on these input parameters, recovery of the potential chian Basin exploration: U.S. Department of Energy resource would require at the mean about 48,000 wells to Report, Morgantown, W. Va., DOE Award Number be drilled within the sweet spot and an additional 62,000 DE-FC26-03NT41856, 582 p., 30 pls.
  • 6. Repetski, J.E., Ryder, R.T., Weary, D.J., Harris, A.G., and U.S. Geological Survey Oil and Gas Assessment Team, Trippi, M.H., 2008, Thermal maturity patterns (CAI 2012, Variability of distributions of well-scale estimated and %Ro) in Upper Ordovician and Devonian rocks of ultimate recovery for continuous (unconventional) oil the Appalachian Basin: A major revision of USGS Map and gas resources in the United States: U.S. Geological I-917-E using new subsurface collections: U.S. Geo- Survey Open-File Report 2012–1118, 18 p. logical Survey Scientific Investigations Map 3006, 41 p., 3 sheets. Wallace, L.G., and Roen, J.B., 1989, Petroleum source rock potential of the Upper Ordovician black shale Riley, R.A., Erenpreiss, M.S., and Wells, J.G., 2012, Data sequence, northern Appalachian Basin: U.S. Geological compilation and source rock mapping of the Upper Survey Open-File Report 89–488, 66 p. Ordovician black shale interval in Ohio: Ohio Depart- ment of Natural Resources, Division of Geological Survey, contract report funded by U.S. Geological Utica Shale Assessment Team Survey (00200003512), 29 p. Mark A. Kirschbaum, Christopher J. Schenk (project Ryder, R.T., 2008, Assessment of Appalachian Basin oil chief, schenk@usgs.gov), Troy A. Cook, Robert T. Ryder, and gas resources: Utica-Lower Paleozoic Total Petro- Ronald R. Charpentier, Timothy R. Klett, Stephanie B. leum System: U.S. Geological Survey Open-File Report Gaswirth, Marilyn E. Tennyson, Katherine J. Whidden. 2008–1287, 29 p. For Additional Information Ryder, R.T., Burruss, R.C., and Hatch, J.R., 1998, Black shale source rocks and oil generation in the Cambrian Supporting geologic studies of Utica Shale and and Ordovician of the central Appalachian Basin, USA: Assessment Units, and reports on the assessment method- American Association of Petroleum Geologists Bulletin, ology used in the assessment can be found at the USGS v. 82, no. 3, p. 412–441. Energy Resources Program website (http://energy.usgs.gov). Hand-tinted photo of Ordovician Utica Shale with interbedded sandstone of the Ordovician Lorraine Shale above, Jefferson County, New York. Photograph 1889 by C.D. Wolcott, third Director of the USGS. http://library photo.cr.usgs.gov.