SlideShare ist ein Scribd-Unternehmen logo
1 von 11
Downloaden Sie, um offline zu lesen
I watched the evidence given by the Supply Directors of some of the major energy companies,
usually referred to as the "Big Six" before the Energy & Climate Change Select Committee at the
House of Commons in the run-up to Christmas. They presented a uniform story of low returns which
no-one could consider were exhibiting evidence of monopoly or oligopoly profit.
I started work to investigate whether or not what they had said was true.
Scottish & Southern Energy show that their Supply business - their retail arm selling electricity to
customers was earning low returns. This position is illustrated in the graph below:
SSE EBITDA Yo return on Supply Sales
6.00% ,
5.OO% l
l
4.OO% l
3.00% i'
2.00%
1..OO%
O.OO% i
https:,//www ofgem,gov
I was struck by the phrase "in our retail business" which was repeatedly used. I wondered what we'd
encounter if we looked at the rest of their business. Each of the "Big Six" is split into a Supply
business and a Generation business. The returns earned by the Generation business which produces
the electricity is shown below:
trL
=o
G,
0)
@
(!
x
o
E
lo
lr.l
c
f
o)
4,
obrO
G
x
a
E
to
UJ
7O.OO% 1
i
60.00% 1
50.00%
4o.oo% ,
10.00% l
o.oo%
https://www ofgem
SSE EBITDA Y" return on Generation Sales
^f'* T 2oo9 .zot2 ^ud,. #
_v''r- -__;Jr*
^?€"
2009 20L0 207L 2012
gov. u k/o-fg-eh-p u b lications/7 4l 64/energyco m pa n ies pu blis h2012conso lidatedsegm e nta lstatements. pdf
Although returns have fallen in recent years SSE still earns over 50% on Generation Sales. Of every
f l earned from sales, over 50p is profit. No mention was made of this.
SSE Sales
l+1?.OOo/"
i*E! -oo
I ^(o'
to.oo% i-- -6I--
IcL
=o
OE
o
bo
.!
x
o
E
ro
tr,t
2.OO%
o.oo%
I https://www.ofgem.gov.u(
l-'_'*__-
Rather than the SYo return claimed SSE earn a 10% return on their business when Generation and
Supply are looked at in the round. So much for SSE, what about the others?
Centrica EBITDA% return on Supply Sales
1"' 2009 -20L2
fi 6.00% -,
oaI
* s.oo%
t!
;s 4.00% +-*,
P :.ooz
ro
t! 2.OOYI
! o.oox i* |
tlI https://www.ofgem.
I
Centrica earn a good return of 7o/o on their supply business making them the most profitable of the
"Big Six" from this side of their operations.
Centrica's Generation arm performance is illustrated in the diagram below. This shows that they
have earned a 35.Ot% rate of return on EBITDA divided by sales in the most recent year for which
figures are available.
Centrica EBITDA Ys reiurn on Generation Sales I
?l0r
-_29!2 ___s
5.OO%
o.00%
2009 20to 2077 20L2
https://www.ofgem.gov.uldofgem-pqblications/74764/ enerryc:ompa niespublish20l2consolidatedsegmentalstatements.pdf
Profits from Generation are on the up and have increased ever quicker in 20L2.
Centrica EBITDA% return on Total Sales
2009 -20t2
12.OO%
10.oo%
The overall position for Centrica is very similar to that of SSE with a return being earned at just a
fraction less than 10%.
E
E 8.oo%
t
o
H 6.00%
s
e 4.oo%
to
t!
2.OO%
E.On EBITDA Yo return on Supply Sales
trL
5
o
E
o
EO
(!
>s
oF
6
ET
5.00%
450%
4.OO%
350%
3.O0%
2.5O/"
2.00%
7.50%
7-OOo/"
o50%
o.oo%
https://www.ofgem.gov. uk/ofgem-publicationsf 4764/enerWcompaniespublish20l2consolidatedseEmentalstatements. pdf
2009 2010 20Lt
E.On's return on Supply Sales to retail customers was 3.O9o/o in the most recent year for which we
have figures. This is as reported to the Energy & Climate Change Committee.
t--
I f.On EBITDA% rl
L2 I
ents.pdf I
_ __.-- , l
E.On's return on Generation Sales is 22.69%. This is clearly a lot more than the 3.O9% quoted.
E.On EBITDA Yt return on Total Sales
cL
P
o
d,
o
bo
G
s
o
toEI
LO.00%
9.OO%
a.oo%
7.OO%
6.00%
5.Otr/o
4.00%
3.00%
2.OA%
LA}%
a.ooYo
i zoog 2ato 2o7t 2oL2
t httpS://www.ofgem.gov.uklofgem-pu blicatio ns/7 4764/ener1ycompa niespublish20l2consolidatedsegmentalstatements.pdf
L___-__._*
E.On's overall performance is a return of 6,72% on their business taken as a whole.
2.OO%
-I
i
l
I
I
I
I
I
l
trL
t
o
d.
o
ao
tg
s
a
tot!
EDF EBITDA Yo return on Supply Sales
2009 -20L2
7.50%
t.o0%
o.so%
0.oo%
-o.50%
-L.OO%
oo
/$.'
p'
https://www.ofgem.gov.uldofgem-publications/74764/enetWcompaniespublish2O12consolidatedsegmentalstatements'pdf
EDF's Supply business is the worst performing of the "Big Six" and has made almost no profit in the
last four years. Before you start to weep for them, we'll move along to the next diagram...'
rI
I
I
I
I
I
I
45.OO%
40.oo%
tr 35.00%
E, zo.oor"
E
$ 2s.00%
I zo.ooz
? ts.aoot
o
- ro.ao%
5.OO%
EDF earned a whopping 40.63% return from their Generation arm in 2Ot2.They've kept the profit in
the part of the business which isn't exposed to much public scrutiny. Smart move!
t -r
1 EDF EBITDA% return on Total Sales i
I
I zooe -2c i
i ra.oos6 i
l_-i
I zoos 2oro 2oLz i
I https://www,ofgem.gov.uk/ofgem-pu blicatio ns/74764lenet1Yc tements'pdf I
- -'----l
EDF's EBITDA return on Total Sales is over 16%. And to think we were near to tears after the first
graph. We're not crying now.....
EDF EBITDA ?6 re:turn on Generation Sales
RWE npower EBITDA %o return on Supply Sales
https://rvww.ofgem.gov.uk/ofgem-pu blicationslT4T64lefietWcompa niespublish20l2consolidatedsegmentalstatements'pdf
Bravo RWE npower, a year-on-year improvement in the performance of the Supply business has
seen it return to profit, posting a return of 3.92%in2012.
50.00%
45.OO%
40.oo%
tr
=
3s.oo%
P
0,
E 30.OAy
o
H zs.oox
x
3 2o.o0%
i ts.oox
lrJ
10.00%
5.00/6
o.oo%
2017 2012
-T::1:y*:t:1',:'::1
ry"':'*:y:::yT:r::l:1":T"':::1':::::T',T:':':1:l'*" --l
RWE suffered a smalldrop in profit percentage in Generation sales in 2012. At43.35% it remains
disgustingly healthy.
RWE npower EBITDA Yo return on Total Sales
2009 -20L2
C
o
E,
o
oo
ooo
o
E
to
u,l
9.OO%
8.OO%
7.00%
6.OU/"
s.00%
4.OO%
3.OO%
2.OO%
L.OO%
o.ooa/,
2049 201.7 2072
https://www.ofgem.gov.u k/ofgem-pu blications/74764/energycompa niespublish20l2consolidatedsegmentalstatements'pdf
RWE's profits in their UK business are rising steadily reaching 8.L5o/o EBITDA over Sales in 201-2. This
is at marked variance from the protestations of doom usually heard from the company.
Sc Power EBITDA% return on Supply Sales
450%
4.OO%
3.50%
3.OOo/o
2.50%
2.OO%
1..50%
1..DO%
o.s0%
o.oo%
2009 2070 2011 2072
https:.//www.ofgem.gov.uk/ofgem-publications/74764/energycompaniespu blish20L2conso]idatedsegmentalstatements. pdf
Scottish Power made a 3.OLYo return on Supply sales in 2012.
--t
I
trL
o
E
o
ho
ood
o
E
6
lrJ
2AO9
i
I
I
I
L8,OO%
I
L7.oo% +
201.0 20LL 20!2
I https://www.ofgem.gov,uk/ofgem-pubticati ons/74764/energycompan iespublish20l2consolidatedsegmenta lstatements.pdf
i
L*-.'*.'-- - ^.-_--]
Scottish Power saw a big decline in profit percentage in 2OL2, this is possibly due to the run-down at
Cockenzie.
Sc Power EBITDA% return on Total Sales
2009 -20L2
LO.OO%
9.OA%
8.OO%
7.O0%
6.OO%
s.00%
4.OA%
3.OO%
2.00/o
L.O0%
o.oo%
2009 20LO 20L7
https://www.ofgem.gov. uk/ofgem-publications/74764/energycom paniespublish2Ol2consolidatedsegmenta lstatements.pdf
Scottish Power has shown a decline in the return on Total Sales in each of the last four years. lt is the
worst performing firm in the "Big Six" in this regard.
trL
o
d.
(,
brO
(!
x
a
E
oUI
10.o0%
8.O0%
6.OO%
SSE
-2.OO%
-4.00%
' https://www.ofgem.gov.u k/ofgem-pu blications/74764/energycompa niespublish20l2consolidatedsegmentalstatements.pdf
Looking at all of the firms together gives us a slightly different perspective. ln terms of the Supply
Business dealing with retail sales to customers returns don't look abnormal and the market seems to
be competitive.
EBITDA Yo return on Generation Sales
o
.o st
A"1
a6<
c.i
EBITDA Yo ret Ies
2oe
10
o Ns
1-1-
:
N >R ?Hu tz $
d;>R E
-$3
>s-;(nlfl
q
OJ
ro
no.
ScPower E.On
o
rO
og.
rl
4.OO%
2.OO%
o.00%
c
0,
t
o
uo
G
s
o
E
to
IJJ
2009-2
>s >e
l-. C.,l .o
o nn$
>< q 55r
r.{O st
Centrica RWE
764/energycompan consol datedsegmentalsta
ffi 2012
>R
clt o
co st
fiil$x R *$rncnclm N
^
6'.t c..l Oi N
Fl
E'On
ofg m-publications/74
, 2009
,:.2010
201_1_
70.00%
60.oo%
! so.oo,z
(l,
T, qo.oov"
h0
(!
0
a 30.00%<'
o
6 20.OO%
lrJ
10.oo%
o.00%
https://www.
When we look at the Generation Sales the position is markedly different with SSE earning a 50%
return, RWE a 43%o return and EDF a 40% return. These show clear evidence of abnormal returns
above what would be expected in a competitive market.
The position shown above pre-dates the "Dash for Coal" which has now overtaken us. Returns for
2013 will be very much higher. lt also doesn't consider whether input costs for raw materials are
being adjusted by any of the players through intra-company trading (central group buying)'
EBITDA Yo return on Total Sales
2OO9-2OL2 X H 2oos
L8.00% Q :?
I S m2o1o
L8.00% s) 3h D m 2o1o.oHd
1.6.00% ts
oo 2017
N
c L4'00% N o =" o,2orz I! ro NoN
fitz.oou" NX >R 388 x 3
&._^^^. nBN H s=a; t H
ScPower E.On Centrica EDF RWE SSE
https://www.ofgem.gov.u k/ofgem-pu blications/747 64/ene'8ycom pa niespublish20l2consolidatedsegmenta lstatements. pdf
What we have discovered for all of the companies is that their overall percentage return is much
higher than the retail profit percentages shared with the Energy and Climate Change Select
Committee. The Generation business is where the money is being made. This year's manoeuvres
mean that a much higher return will be made in 2013 than was made in2012.
Returns of over 50% make a mockery of the evidence given to the committee. These have gone up in
2013. Will anything be done?

Weitere ähnliche Inhalte

Was ist angesagt? (7)

JLL Columbus Industrial Outlook - Q4 2020
JLL Columbus Industrial Outlook - Q4 2020JLL Columbus Industrial Outlook - Q4 2020
JLL Columbus Industrial Outlook - Q4 2020
 
AT&S Annual Report 2011/12
AT&S Annual Report 2011/12AT&S Annual Report 2011/12
AT&S Annual Report 2011/12
 
Imperial Capital - Daimler - Final
Imperial Capital - Daimler - FinalImperial Capital - Daimler - Final
Imperial Capital - Daimler - Final
 
Deloitte Christmas Retail Results 2015
Deloitte Christmas Retail Results 2015Deloitte Christmas Retail Results 2015
Deloitte Christmas Retail Results 2015
 
Colgate ru2 qfy2011-281010
Colgate  ru2 qfy2011-281010Colgate  ru2 qfy2011-281010
Colgate ru2 qfy2011-281010
 
Before the Open May 5 2017
Before the Open May 5 2017Before the Open May 5 2017
Before the Open May 5 2017
 
Net Lease Marker Report Q2 2013
Net Lease Marker Report Q2 2013Net Lease Marker Report Q2 2013
Net Lease Marker Report Q2 2013
 

Andere mochten auch

Tim Stone. 28th January
Tim Stone. 28th JanuaryTim Stone. 28th January
Tim Stone. 28th January
UKTI2014
 
Why The Us Wants War
Why The Us Wants WarWhy The Us Wants War
Why The Us Wants War
tranceking
 
Search Presentation
Search  PresentationSearch  Presentation
Search Presentation
Doug Green
 

Andere mochten auch (9)

Energy Saving
Energy SavingEnergy Saving
Energy Saving
 
Iraq Energy Outlook Special Report
Iraq Energy Outlook Special ReportIraq Energy Outlook Special Report
Iraq Energy Outlook Special Report
 
Tim Stone. 28th January
Tim Stone. 28th JanuaryTim Stone. 28th January
Tim Stone. 28th January
 
Southeast Asia Energy Outlook
Southeast Asia Energy OutlookSoutheast Asia Energy Outlook
Southeast Asia Energy Outlook
 
Why The Us Wants War
Why The Us Wants WarWhy The Us Wants War
Why The Us Wants War
 
Adapting to the UK Energy Market as a Responsible & Reliable Large Electricit...
Adapting to the UK Energy Market as a Responsible & Reliable Large Electricit...Adapting to the UK Energy Market as a Responsible & Reliable Large Electricit...
Adapting to the UK Energy Market as a Responsible & Reliable Large Electricit...
 
Search Presentation
Search  PresentationSearch  Presentation
Search Presentation
 
World Energy Outlook 2014 by Dr. Fatih Birol, Chief Economist of the the Inte...
World Energy Outlook 2014 by Dr. Fatih Birol, Chief Economist of the the Inte...World Energy Outlook 2014 by Dr. Fatih Birol, Chief Economist of the the Inte...
World Energy Outlook 2014 by Dr. Fatih Birol, Chief Economist of the the Inte...
 
Medium-Term Oil Market Report 2016
Medium-Term Oil Market Report 2016Medium-Term Oil Market Report 2016
Medium-Term Oil Market Report 2016
 

Ähnlich wie UK electricity profits from Generation

Fm11 ch 13 analysis of financial statements
Fm11 ch 13 analysis of financial statementsFm11 ch 13 analysis of financial statements
Fm11 ch 13 analysis of financial statements
Nhu Tuyet Tran
 
Bajaj electricals ru2 qfy2011-271010
Bajaj electricals ru2 qfy2011-271010Bajaj electricals ru2 qfy2011-271010
Bajaj electricals ru2 qfy2011-271010
Angel Broking
 
Acc ru3 qcy2010-211010
Acc ru3 qcy2010-211010Acc ru3 qcy2010-211010
Acc ru3 qcy2010-211010
Angel Broking
 
Final LEG project copy
Final LEG project copyFinal LEG project copy
Final LEG project copy
Eric Nielsen
 
Example of Business Operations Analysis
Example of Business Operations AnalysisExample of Business Operations Analysis
Example of Business Operations Analysis
Bojan Mitrovic, M.A.
 
Fast Company Identified General Electric Co As One Of Its 50 Most Innovative ...
Fast Company Identified General Electric Co As One Of Its 50 Most Innovative ...Fast Company Identified General Electric Co As One Of Its 50 Most Innovative ...
Fast Company Identified General Electric Co As One Of Its 50 Most Innovative ...
cfarver
 
5208 Equity Insight Issue 484
5208 Equity Insight   Issue 4845208 Equity Insight   Issue 484
5208 Equity Insight Issue 484
Charlie1972
 
eastman chemical annual reports 2005
eastman chemical  annual reports 2005eastman chemical  annual reports 2005
eastman chemical annual reports 2005
finance31
 

Ähnlich wie UK electricity profits from Generation (20)

Analysis of 2013 UK Electricity Margins
Analysis of 2013 UK Electricity MarginsAnalysis of 2013 UK Electricity Margins
Analysis of 2013 UK Electricity Margins
 
DL analysis of electricity profits 201116
DL analysis of electricity profits 201116DL analysis of electricity profits 201116
DL analysis of electricity profits 201116
 
DL Analysis of Electricity Profits 310322.pdf
DL Analysis of Electricity Profits 310322.pdfDL Analysis of Electricity Profits 310322.pdf
DL Analysis of Electricity Profits 310322.pdf
 
analysis of financial statements
analysis of financial statements analysis of financial statements
analysis of financial statements
 
Fm11 ch 13 analysis of financial statements
Fm11 ch 13 analysis of financial statementsFm11 ch 13 analysis of financial statements
Fm11 ch 13 analysis of financial statements
 
Mytilineos (OW, TP_ €46.0_sh)_ Strong organic progress 14-03-2024.pdf
Mytilineos (OW, TP_ €46.0_sh)_ Strong organic progress 14-03-2024.pdfMytilineos (OW, TP_ €46.0_sh)_ Strong organic progress 14-03-2024.pdf
Mytilineos (OW, TP_ €46.0_sh)_ Strong organic progress 14-03-2024.pdf
 
Ch13S.ppt
Ch13S.pptCh13S.ppt
Ch13S.ppt
 
Ch13S.ppt
Ch13S.pptCh13S.ppt
Ch13S.ppt
 
Ch13S.ppt
Ch13S.pptCh13S.ppt
Ch13S.ppt
 
Bajaj electricals ru2 qfy2011-271010
Bajaj electricals ru2 qfy2011-271010Bajaj electricals ru2 qfy2011-271010
Bajaj electricals ru2 qfy2011-271010
 
Douglas Arent - Energy Issues and Implications for Macrostability Workshop
Douglas Arent - Energy Issues and Implications for Macrostability WorkshopDouglas Arent - Energy Issues and Implications for Macrostability Workshop
Douglas Arent - Energy Issues and Implications for Macrostability Workshop
 
Acc ru3 qcy2010-211010
Acc ru3 qcy2010-211010Acc ru3 qcy2010-211010
Acc ru3 qcy2010-211010
 
Final LEG project copy
Final LEG project copyFinal LEG project copy
Final LEG project copy
 
Example of Business Operations Analysis
Example of Business Operations AnalysisExample of Business Operations Analysis
Example of Business Operations Analysis
 
Operations performance analysis that facilitates an informed decision making ...
Operations performance analysis that facilitates an informed decision making ...Operations performance analysis that facilitates an informed decision making ...
Operations performance analysis that facilitates an informed decision making ...
 
Fast Company Identified General Electric Co As One Of Its 50 Most Innovative ...
Fast Company Identified General Electric Co As One Of Its 50 Most Innovative ...Fast Company Identified General Electric Co As One Of Its 50 Most Innovative ...
Fast Company Identified General Electric Co As One Of Its 50 Most Innovative ...
 
Q1 2014 Investor Presentation
Q1 2014 Investor PresentationQ1 2014 Investor Presentation
Q1 2014 Investor Presentation
 
Tricumen / Capital Markets Profit drivers Nov-13
Tricumen / Capital Markets Profit drivers Nov-13Tricumen / Capital Markets Profit drivers Nov-13
Tricumen / Capital Markets Profit drivers Nov-13
 
5208 Equity Insight Issue 484
5208 Equity Insight   Issue 4845208 Equity Insight   Issue 484
5208 Equity Insight Issue 484
 
eastman chemical annual reports 2005
eastman chemical  annual reports 2005eastman chemical  annual reports 2005
eastman chemical annual reports 2005
 

Mehr von Derek Louden

Mehr von Derek Louden (20)

Highland Council SNP Group - Manifesto 22 FINAL SlideShare.pdf
Highland Council SNP Group - Manifesto 22 FINAL SlideShare.pdfHighland Council SNP Group - Manifesto 22 FINAL SlideShare.pdf
Highland Council SNP Group - Manifesto 22 FINAL SlideShare.pdf
 
Highland Council SNP Group - Manifesto 22 FINAL single - Highlighted for Firs...
Highland Council SNP Group - Manifesto 22 FINAL single - Highlighted for Firs...Highland Council SNP Group - Manifesto 22 FINAL single - Highlighted for Firs...
Highland Council SNP Group - Manifesto 22 FINAL single - Highlighted for Firs...
 
Th tbusinessplan v2
Th tbusinessplan v2Th tbusinessplan v2
Th tbusinessplan v2
 
Dl brexit plan v2a 300719
Dl   brexit plan v2a 300719Dl   brexit plan v2a 300719
Dl brexit plan v2a 300719
 
Ochil and south perthshire eu grants lost
Ochil and south perthshire eu grants lostOchil and south perthshire eu grants lost
Ochil and south perthshire eu grants lost
 
Pockled farm support
Pockled farm supportPockled farm support
Pockled farm support
 
A Ray of Sunshine - The West Coast Fishery Post-Brexit
A Ray of Sunshine - The West Coast Fishery Post-Brexit A Ray of Sunshine - The West Coast Fishery Post-Brexit
A Ray of Sunshine - The West Coast Fishery Post-Brexit
 
Your Plaice or Mine? - Fishing Quotas in the North Sea
Your Plaice or Mine? - Fishing Quotas in the North SeaYour Plaice or Mine? - Fishing Quotas in the North Sea
Your Plaice or Mine? - Fishing Quotas in the North Sea
 
UKCS Upstream Oil & Gas 2017
UKCS Upstream Oil & Gas 2017UKCS Upstream Oil & Gas 2017
UKCS Upstream Oil & Gas 2017
 
Current pancreatic cancer research 10 May 16
Current pancreatic cancer research 10 May 16Current pancreatic cancer research 10 May 16
Current pancreatic cancer research 10 May 16
 
UKCS Upstream Oil & Gas Report 2016 Edition
UKCS Upstream Oil & Gas Report 2016 EditionUKCS Upstream Oil & Gas Report 2016 Edition
UKCS Upstream Oil & Gas Report 2016 Edition
 
So what has the EU ever done for us?
So what has the EU ever done for us?So what has the EU ever done for us?
So what has the EU ever done for us?
 
Motor fuel markets prices & taxes
Motor fuel markets prices & taxesMotor fuel markets prices & taxes
Motor fuel markets prices & taxes
 
UKCS Upstream Oil & Gas 2015 Edition
UKCS Upstream Oil & Gas 2015 EditionUKCS Upstream Oil & Gas 2015 Edition
UKCS Upstream Oil & Gas 2015 Edition
 
Budget changes july 2015
Budget changes july 2015Budget changes july 2015
Budget changes july 2015
 
Scotland enduring the scotland bill
Scotland   enduring the scotland billScotland   enduring the scotland bill
Scotland enduring the scotland bill
 
Scotland enduring the settlement
Scotland enduring the settlementScotland enduring the settlement
Scotland enduring the settlement
 
Scotland - Enduring the Settlement
Scotland  - Enduring the SettlementScotland  - Enduring the Settlement
Scotland - Enduring the Settlement
 
The Missing Oil Millions
The Missing Oil MillionsThe Missing Oil Millions
The Missing Oil Millions
 
World oil exporters 2004-2013
World oil exporters 2004-2013World oil exporters 2004-2013
World oil exporters 2004-2013
 

Kürzlich hochgeladen

Powerful Love Spells in Phoenix, AZ (310) 882-6330 Bring Back Lost Lover
Powerful Love Spells in Phoenix, AZ (310) 882-6330 Bring Back Lost LoverPowerful Love Spells in Phoenix, AZ (310) 882-6330 Bring Back Lost Lover
Powerful Love Spells in Phoenix, AZ (310) 882-6330 Bring Back Lost Lover
PsychicRuben LoveSpells
 
THE OBSTACLES THAT IMPEDE THE DEVELOPMENT OF BRAZIL IN THE CONTEMPORARY ERA A...
THE OBSTACLES THAT IMPEDE THE DEVELOPMENT OF BRAZIL IN THE CONTEMPORARY ERA A...THE OBSTACLES THAT IMPEDE THE DEVELOPMENT OF BRAZIL IN THE CONTEMPORARY ERA A...
THE OBSTACLES THAT IMPEDE THE DEVELOPMENT OF BRAZIL IN THE CONTEMPORARY ERA A...
Faga1939
 

Kürzlich hochgeladen (20)

Gujarat-SEBCs.pdf pfpkoopapriorjfperjreie
Gujarat-SEBCs.pdf pfpkoopapriorjfperjreieGujarat-SEBCs.pdf pfpkoopapriorjfperjreie
Gujarat-SEBCs.pdf pfpkoopapriorjfperjreie
 
06052024_First India Newspaper Jaipur.pdf
06052024_First India Newspaper Jaipur.pdf06052024_First India Newspaper Jaipur.pdf
06052024_First India Newspaper Jaipur.pdf
 
Kishan Reddy Report To People (2019-24).pdf
Kishan Reddy Report To People (2019-24).pdfKishan Reddy Report To People (2019-24).pdf
Kishan Reddy Report To People (2019-24).pdf
 
Enjoy Night ≽ 8448380779 ≼ Call Girls In Gurgaon Sector 48 (Gurgaon)
Enjoy Night ≽ 8448380779 ≼ Call Girls In Gurgaon Sector 48 (Gurgaon)Enjoy Night ≽ 8448380779 ≼ Call Girls In Gurgaon Sector 48 (Gurgaon)
Enjoy Night ≽ 8448380779 ≼ Call Girls In Gurgaon Sector 48 (Gurgaon)
 
BDSM⚡Call Girls in Sector 143 Noida Escorts >༒8448380779 Escort Service
BDSM⚡Call Girls in Sector 143 Noida Escorts >༒8448380779 Escort ServiceBDSM⚡Call Girls in Sector 143 Noida Escorts >༒8448380779 Escort Service
BDSM⚡Call Girls in Sector 143 Noida Escorts >༒8448380779 Escort Service
 
Enjoy Night ≽ 8448380779 ≼ Call Girls In Palam Vihar (Gurgaon)
Enjoy Night ≽ 8448380779 ≼ Call Girls In Palam Vihar (Gurgaon)Enjoy Night ≽ 8448380779 ≼ Call Girls In Palam Vihar (Gurgaon)
Enjoy Night ≽ 8448380779 ≼ Call Girls In Palam Vihar (Gurgaon)
 
05052024_First India Newspaper Jaipur.pdf
05052024_First India Newspaper Jaipur.pdf05052024_First India Newspaper Jaipur.pdf
05052024_First India Newspaper Jaipur.pdf
 
AI as Research Assistant: Upscaling Content Analysis to Identify Patterns of ...
AI as Research Assistant: Upscaling Content Analysis to Identify Patterns of ...AI as Research Assistant: Upscaling Content Analysis to Identify Patterns of ...
AI as Research Assistant: Upscaling Content Analysis to Identify Patterns of ...
 
Nara Chandrababu Naidu's Visionary Policies For Andhra Pradesh's Development
Nara Chandrababu Naidu's Visionary Policies For Andhra Pradesh's DevelopmentNara Chandrababu Naidu's Visionary Policies For Andhra Pradesh's Development
Nara Chandrababu Naidu's Visionary Policies For Andhra Pradesh's Development
 
declarationleaders_sd_re_greens_theleft_5.pdf
declarationleaders_sd_re_greens_theleft_5.pdfdeclarationleaders_sd_re_greens_theleft_5.pdf
declarationleaders_sd_re_greens_theleft_5.pdf
 
Embed-2 (1).pdfb[k[k[[k[kkkpkdpokkdpkopko
Embed-2 (1).pdfb[k[k[[k[kkkpkdpokkdpkopkoEmbed-2 (1).pdfb[k[k[[k[kkkpkdpokkdpkopko
Embed-2 (1).pdfb[k[k[[k[kkkpkdpokkdpkopko
 
Group_5_US-China Trade War to understand the trade
Group_5_US-China Trade War to understand the tradeGroup_5_US-China Trade War to understand the trade
Group_5_US-China Trade War to understand the trade
 
Verified Love Spells in Little Rock, AR (310) 882-6330 Get My Ex-Lover Back
Verified Love Spells in Little Rock, AR (310) 882-6330 Get My Ex-Lover BackVerified Love Spells in Little Rock, AR (310) 882-6330 Get My Ex-Lover Back
Verified Love Spells in Little Rock, AR (310) 882-6330 Get My Ex-Lover Back
 
BDSM⚡Call Girls in Sector 135 Noida Escorts >༒8448380779 Escort Service
BDSM⚡Call Girls in Sector 135 Noida Escorts >༒8448380779 Escort ServiceBDSM⚡Call Girls in Sector 135 Noida Escorts >༒8448380779 Escort Service
BDSM⚡Call Girls in Sector 135 Noida Escorts >༒8448380779 Escort Service
 
Powerful Love Spells in Phoenix, AZ (310) 882-6330 Bring Back Lost Lover
Powerful Love Spells in Phoenix, AZ (310) 882-6330 Bring Back Lost LoverPowerful Love Spells in Phoenix, AZ (310) 882-6330 Bring Back Lost Lover
Powerful Love Spells in Phoenix, AZ (310) 882-6330 Bring Back Lost Lover
 
Julius Randle's Injury Status: Surgery Not Off the Table
Julius Randle's Injury Status: Surgery Not Off the TableJulius Randle's Injury Status: Surgery Not Off the Table
Julius Randle's Injury Status: Surgery Not Off the Table
 
Enjoy Night ≽ 8448380779 ≼ Call Girls In Gurgaon Sector 46 (Gurgaon)
Enjoy Night ≽ 8448380779 ≼ Call Girls In Gurgaon Sector 46 (Gurgaon)Enjoy Night ≽ 8448380779 ≼ Call Girls In Gurgaon Sector 46 (Gurgaon)
Enjoy Night ≽ 8448380779 ≼ Call Girls In Gurgaon Sector 46 (Gurgaon)
 
THE OBSTACLES THAT IMPEDE THE DEVELOPMENT OF BRAZIL IN THE CONTEMPORARY ERA A...
THE OBSTACLES THAT IMPEDE THE DEVELOPMENT OF BRAZIL IN THE CONTEMPORARY ERA A...THE OBSTACLES THAT IMPEDE THE DEVELOPMENT OF BRAZIL IN THE CONTEMPORARY ERA A...
THE OBSTACLES THAT IMPEDE THE DEVELOPMENT OF BRAZIL IN THE CONTEMPORARY ERA A...
 
BDSM⚡Call Girls in Indirapuram Escorts >༒8448380779 Escort Service
BDSM⚡Call Girls in Indirapuram Escorts >༒8448380779 Escort ServiceBDSM⚡Call Girls in Indirapuram Escorts >༒8448380779 Escort Service
BDSM⚡Call Girls in Indirapuram Escorts >༒8448380779 Escort Service
 
Transformative Leadership: N Chandrababu Naidu and TDP's Vision for Innovatio...
Transformative Leadership: N Chandrababu Naidu and TDP's Vision for Innovatio...Transformative Leadership: N Chandrababu Naidu and TDP's Vision for Innovatio...
Transformative Leadership: N Chandrababu Naidu and TDP's Vision for Innovatio...
 

UK electricity profits from Generation

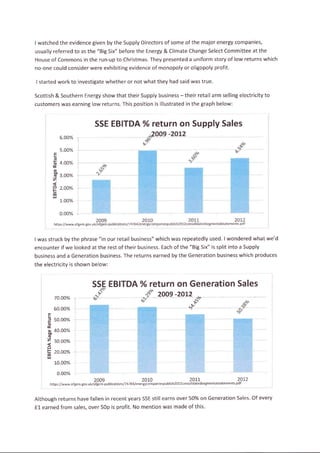
  • 1. I watched the evidence given by the Supply Directors of some of the major energy companies, usually referred to as the "Big Six" before the Energy & Climate Change Select Committee at the House of Commons in the run-up to Christmas. They presented a uniform story of low returns which no-one could consider were exhibiting evidence of monopoly or oligopoly profit. I started work to investigate whether or not what they had said was true. Scottish & Southern Energy show that their Supply business - their retail arm selling electricity to customers was earning low returns. This position is illustrated in the graph below: SSE EBITDA Yo return on Supply Sales 6.00% , 5.OO% l l 4.OO% l 3.00% i' 2.00% 1..OO% O.OO% i https:,//www ofgem,gov I was struck by the phrase "in our retail business" which was repeatedly used. I wondered what we'd encounter if we looked at the rest of their business. Each of the "Big Six" is split into a Supply business and a Generation business. The returns earned by the Generation business which produces the electricity is shown below: trL =o G, 0) @ (! x o E lo lr.l c f o) 4, obrO G x a E to UJ 7O.OO% 1 i 60.00% 1 50.00% 4o.oo% , 10.00% l o.oo% https://www ofgem SSE EBITDA Y" return on Generation Sales ^f'* T 2oo9 .zot2 ^ud,. # _v''r- -__;Jr* ^?€" 2009 20L0 207L 2012 gov. u k/o-fg-eh-p u b lications/7 4l 64/energyco m pa n ies pu blis h2012conso lidatedsegm e nta lstatements. pdf Although returns have fallen in recent years SSE still earns over 50% on Generation Sales. Of every f l earned from sales, over 50p is profit. No mention was made of this.
  • 2. SSE Sales l+1?.OOo/" i*E! -oo I ^(o' to.oo% i-- -6I-- IcL =o OE o bo .! x o E ro tr,t 2.OO% o.oo% I https://www.ofgem.gov.u( l-'_'*__- Rather than the SYo return claimed SSE earn a 10% return on their business when Generation and Supply are looked at in the round. So much for SSE, what about the others? Centrica EBITDA% return on Supply Sales 1"' 2009 -20L2 fi 6.00% -, oaI * s.oo% t! ;s 4.00% +-*, P :.ooz ro t! 2.OOYI ! o.oox i* | tlI https://www.ofgem. I Centrica earn a good return of 7o/o on their supply business making them the most profitable of the "Big Six" from this side of their operations. Centrica's Generation arm performance is illustrated in the diagram below. This shows that they have earned a 35.Ot% rate of return on EBITDA divided by sales in the most recent year for which figures are available.
  • 3. Centrica EBITDA Ys reiurn on Generation Sales I ?l0r -_29!2 ___s 5.OO% o.00% 2009 20to 2077 20L2 https://www.ofgem.gov.uldofgem-pqblications/74764/ enerryc:ompa niespublish20l2consolidatedsegmentalstatements.pdf Profits from Generation are on the up and have increased ever quicker in 20L2. Centrica EBITDA% return on Total Sales 2009 -20t2 12.OO% 10.oo% The overall position for Centrica is very similar to that of SSE with a return being earned at just a fraction less than 10%. E E 8.oo% t o H 6.00% s e 4.oo% to t! 2.OO%
  • 4. E.On EBITDA Yo return on Supply Sales trL 5 o E o EO (! >s oF 6 ET 5.00% 450% 4.OO% 350% 3.O0% 2.5O/" 2.00% 7.50% 7-OOo/" o50% o.oo% https://www.ofgem.gov. uk/ofgem-publicationsf 4764/enerWcompaniespublish20l2consolidatedseEmentalstatements. pdf 2009 2010 20Lt E.On's return on Supply Sales to retail customers was 3.O9o/o in the most recent year for which we have figures. This is as reported to the Energy & Climate Change Committee. t-- I f.On EBITDA% rl L2 I ents.pdf I _ __.-- , l E.On's return on Generation Sales is 22.69%. This is clearly a lot more than the 3.O9% quoted.
  • 5. E.On EBITDA Yt return on Total Sales cL P o d, o bo G s o toEI LO.00% 9.OO% a.oo% 7.OO% 6.00% 5.Otr/o 4.00% 3.00% 2.OA% LA}% a.ooYo i zoog 2ato 2o7t 2oL2 t httpS://www.ofgem.gov.uklofgem-pu blicatio ns/7 4764/ener1ycompa niespublish20l2consolidatedsegmentalstatements.pdf L___-__._* E.On's overall performance is a return of 6,72% on their business taken as a whole. 2.OO% -I i l I I I I I l trL t o d. o ao tg s a tot! EDF EBITDA Yo return on Supply Sales 2009 -20L2 7.50% t.o0% o.so% 0.oo% -o.50% -L.OO% oo /$.' p' https://www.ofgem.gov.uldofgem-publications/74764/enetWcompaniespublish2O12consolidatedsegmentalstatements'pdf EDF's Supply business is the worst performing of the "Big Six" and has made almost no profit in the last four years. Before you start to weep for them, we'll move along to the next diagram...'
  • 6. rI I I I I I I 45.OO% 40.oo% tr 35.00% E, zo.oor" E $ 2s.00% I zo.ooz ? ts.aoot o - ro.ao% 5.OO% EDF earned a whopping 40.63% return from their Generation arm in 2Ot2.They've kept the profit in the part of the business which isn't exposed to much public scrutiny. Smart move! t -r 1 EDF EBITDA% return on Total Sales i I I zooe -2c i i ra.oos6 i l_-i I zoos 2oro 2oLz i I https://www,ofgem.gov.uk/ofgem-pu blicatio ns/74764lenet1Yc tements'pdf I - -'----l EDF's EBITDA return on Total Sales is over 16%. And to think we were near to tears after the first graph. We're not crying now..... EDF EBITDA ?6 re:turn on Generation Sales
  • 7. RWE npower EBITDA %o return on Supply Sales https://rvww.ofgem.gov.uk/ofgem-pu blicationslT4T64lefietWcompa niespublish20l2consolidatedsegmentalstatements'pdf Bravo RWE npower, a year-on-year improvement in the performance of the Supply business has seen it return to profit, posting a return of 3.92%in2012. 50.00% 45.OO% 40.oo% tr = 3s.oo% P 0, E 30.OAy o H zs.oox x 3 2o.o0% i ts.oox lrJ 10.00% 5.00/6 o.oo% 2017 2012 -T::1:y*:t:1',:'::1 ry"':'*:y:::yT:r::l:1":T"':::1':::::T',T:':':1:l'*" --l RWE suffered a smalldrop in profit percentage in Generation sales in 2012. At43.35% it remains disgustingly healthy.
  • 8. RWE npower EBITDA Yo return on Total Sales 2009 -20L2 C o E, o oo ooo o E to u,l 9.OO% 8.OO% 7.00% 6.OU/" s.00% 4.OO% 3.OO% 2.OO% L.OO% o.ooa/, 2049 201.7 2072 https://www.ofgem.gov.u k/ofgem-pu blications/74764/energycompa niespublish20l2consolidatedsegmentalstatements'pdf RWE's profits in their UK business are rising steadily reaching 8.L5o/o EBITDA over Sales in 201-2. This is at marked variance from the protestations of doom usually heard from the company. Sc Power EBITDA% return on Supply Sales 450% 4.OO% 3.50% 3.OOo/o 2.50% 2.OO% 1..50% 1..DO% o.s0% o.oo% 2009 2070 2011 2072 https:.//www.ofgem.gov.uk/ofgem-publications/74764/energycompaniespu blish20L2conso]idatedsegmentalstatements. pdf Scottish Power made a 3.OLYo return on Supply sales in 2012. --t I trL o E o ho ood o E 6 lrJ
  • 9. 2AO9 i I I I L8,OO% I L7.oo% + 201.0 20LL 20!2 I https://www.ofgem.gov,uk/ofgem-pubticati ons/74764/energycompan iespublish20l2consolidatedsegmenta lstatements.pdf i L*-.'*.'-- - ^.-_--] Scottish Power saw a big decline in profit percentage in 2OL2, this is possibly due to the run-down at Cockenzie. Sc Power EBITDA% return on Total Sales 2009 -20L2 LO.OO% 9.OA% 8.OO% 7.O0% 6.OO% s.00% 4.OA% 3.OO% 2.00/o L.O0% o.oo% 2009 20LO 20L7 https://www.ofgem.gov. uk/ofgem-publications/74764/energycom paniespublish2Ol2consolidatedsegmenta lstatements.pdf Scottish Power has shown a decline in the return on Total Sales in each of the last four years. lt is the worst performing firm in the "Big Six" in this regard. trL o d. (, brO (! x a E oUI
  • 10. 10.o0% 8.O0% 6.OO% SSE -2.OO% -4.00% ' https://www.ofgem.gov.u k/ofgem-pu blications/74764/energycompa niespublish20l2consolidatedsegmentalstatements.pdf Looking at all of the firms together gives us a slightly different perspective. ln terms of the Supply Business dealing with retail sales to customers returns don't look abnormal and the market seems to be competitive. EBITDA Yo return on Generation Sales o .o st A"1 a6< c.i EBITDA Yo ret Ies 2oe 10 o Ns 1-1- : N >R ?Hu tz $ d;>R E -$3 >s-;(nlfl q OJ ro no. ScPower E.On o rO og. rl 4.OO% 2.OO% o.00% c 0, t o uo G s o E to IJJ 2009-2 >s >e l-. C.,l .o o nn$ >< q 55r r.{O st Centrica RWE 764/energycompan consol datedsegmentalsta ffi 2012 >R clt o co st fiil$x R *$rncnclm N ^ 6'.t c..l Oi N Fl E'On ofg m-publications/74 , 2009 ,:.2010 201_1_ 70.00% 60.oo% ! so.oo,z (l, T, qo.oov" h0 (! 0 a 30.00%<' o 6 20.OO% lrJ 10.oo% o.00% https://www. When we look at the Generation Sales the position is markedly different with SSE earning a 50% return, RWE a 43%o return and EDF a 40% return. These show clear evidence of abnormal returns above what would be expected in a competitive market. The position shown above pre-dates the "Dash for Coal" which has now overtaken us. Returns for 2013 will be very much higher. lt also doesn't consider whether input costs for raw materials are being adjusted by any of the players through intra-company trading (central group buying)'
  • 11. EBITDA Yo return on Total Sales 2OO9-2OL2 X H 2oos L8.00% Q :? I S m2o1o L8.00% s) 3h D m 2o1o.oHd 1.6.00% ts oo 2017 N c L4'00% N o =" o,2orz I! ro NoN fitz.oou" NX >R 388 x 3 &._^^^. nBN H s=a; t H ScPower E.On Centrica EDF RWE SSE https://www.ofgem.gov.u k/ofgem-pu blications/747 64/ene'8ycom pa niespublish20l2consolidatedsegmenta lstatements. pdf What we have discovered for all of the companies is that their overall percentage return is much higher than the retail profit percentages shared with the Energy and Climate Change Select Committee. The Generation business is where the money is being made. This year's manoeuvres mean that a much higher return will be made in 2013 than was made in2012. Returns of over 50% make a mockery of the evidence given to the committee. These have gone up in 2013. Will anything be done?