SlideShare ist ein Scribd-Unternehmen logo
1 von 12
Downloaden Sie, um offline zu lesen
Table 3.1 Mean, SD, median and percentile values of food group intakes (g/d) in the total
population
                                                            Total Population (n=441)
     Food group                                   Mean       SD      Median        Percentiles
                                                                                 5th       95th
 1   Rice & pasta, flours, grains & starches       39        61        26          0        122
 2   Savouries (e.g. pizzas)                       47        51        32          0        147
 3   White breads & rolls                          63        43        60          4        143
 4   Wholemeal & brown breads & rolls              20        39         0          0        84
 5   Other breads (e.g. scones, croissants)         9        16         0          0         44
 6   quot;Ready-to-eatquot; breakfast cereals              31        32        22          0        93
 7   Other breakfast cereals (e.g. porridge)       16        56         0          0        125
 8   Biscuits                                      12        17         6          0        43
 9   Cakes, pastries & buns                        12        22         0          0        51
10   Wholemilk                                     206       232       155         0        617
11   Low fat, skimmed & fortified milks            42        122        0          0        299
12   Other milks (e.g. processed milks)             9        33         0          0        80
13   Creams                                         1         2         0          0          4
14   Cheeses                                       11        17         5          0         47
15   Yoghurts                                      22        36         0          0         96
16   Icecreams                                     10        17         0          0         43
17   Puddings & chilled desserts                    9        23         0          0        47
18   Milk puddings (e.g. rice pudding)              2         9         0          0          6
19   Eggs & egg dishes                              8        14         0          0        38
20   Butter                                         2         7         0          0         18
21   Low fat spreads                                2         6         0          0         14
22   Other spreading fats                           7        11         3          0        28
23   Oils                                           0         0         0          0          0
24   Hard cooking fats                              0         0         0          0          0
25   Potatoes (e.g. boiled, mashed, baked)         70        63        57          0        189
26   Processed & homemade potato products           7        16         0          0        41
27   Chipped, fried & roasted potatoes             62        50        53          0        158
28   Vegetable & pulse dishes                       7        18         0          0        42
29   Peas, beans & lentils                         16        23         6          0         60
30   Green vegetables                               8        13         0          0        34
31   Carrots                                       10        14         3          0         38
32   Salad vegetables (e.g. lettuce)                7        14         0          0        34
33   Other vegetables (e.g. onions)                13        22         3          0         58
34   Tinned or jarred vegetables                    1         3         0          0          7
35   Fruit juices                                  86        116       43          0        324
36   Bananas                                       17        39         0          0         96
37   Other fruits (e.g. apples, pears)             36        78        14          0        150
38   Citrus fruit                                   8        27         0          0        57
39   Tinned fruit                                   1         7         0          0          6
Table 3.1 (continued) Mean, SD, median and percentile values of food group intakes (g/d) in the
total population
                                                           Total Population (n=441)
     Food group                                                                   Percentiles
                                                 Mean       SD      Median      5th       95th
40   Nuts & seeds, herbs & spices                   1        4         0          0         6
41   Fish & fish products                          9        15         0          0        41
42   Fish dishes                                   2        11         0          0         0
43   Bacon & ham                                   13       16         7          0        50
44   Beef & veal                                   11       18         0          0        48
45   Lamb                                          3        11         0          0        25
46   Pork                                          5        10         0          0        28
47   Chicken, turkey & game (e.g. pheasant)        25       28        18          0        79
48   Offal & offal dishes                           0        0         0          0         0
49   Beef & veal dishes                            30       44        14          0       103
50   Lamb, pork & bacon dishes                     4        17         0          0        43
51   Poultry & game dishes                         19       31         0          0        84
52   Burgers (beef & pork)                         13       20         0          0        53
53   Sausages                                      10       13         6          0        35
54   Meat pies & pastries                          5        16         0          0        33
55   Meat products (e.g. processed meats)          28       50        18          0        81
56   Alcoholic beverages                           9        71         0          0         0
57   Sugars, syrups, preserves & sweeteners        8        12         3          0        32
58   Chocolate confectionery                       21       20        15          0        65
59   Non-chocolate confectionery                   11       18         4          0        45
60   Savoury snacks                                13       14         8          0        43
61   Soups, sauces & miscellaneous foods           43       45        30          0       133
63   Teas                                         110       189       31          0       499
64   Coffees                                       7        33         0          0        37
65   Other beverages (e.g. water)                 418       388       317         0       1196
66   Carbonated beverages                         185       189       129         0       588
67   Diet carbonated beverages                     21       65         0          0       133
68   Squashes, cordials & fruit juice drinks       34       66         0          0       156

Food group 62 = Nutritional supplements
Table 3.2 Mean, SD, median and percentile values of food group intakes (g/d) in consumers only
                                                                   Consumers only
     Food group                                    n       %     Mean   SD Median           Percentiles
                                                                                           5th    95th
 1   Rice & pasta, flours, grains & starches      284      64      61       67      46      12     141
 2   Savouries (e.g. pizzas)                      337      76      62       50      50       7     160
 3   White breads & rolls                         422      96      66       42      61      10     144
 4   Wholemeal & brown breads & rolls             210      48      41       48      27       5     128
 5   Other breads (e.g. scones, croissants)       180      41      23       19      17       5      65
 6   quot;Ready-to-eatquot; breakfast cereals             358      81      38       32      30       6     103
 7   Other breakfast cereals (e.g. porridge)       65      15     110      106      79      10     356
 8   Biscuits                                     304      69      17       18      12       2      50
 9   Cakes, pastries & buns                       213      48      25       27      17       4      73
10   Wholemilk                                    360      82     253      232     196      16     686
11   Low fat, skimmed & fortified milks           106      24     176      197     109       7     583
12   Other milks (e.g. processed milks)            53      12      79       61     57       23     241
13   Creams                                        48      11       5        4      4        1      16
14   Cheeses                                      272      62      18       18     12        2      54
15   Yoghurts                                     191      43      51       39     43        9     130
16   Icecreams                                    213      48      22       19     17        7      62
17   Puddings & chilled desserts                  136      31      31       34     20        6      79
18   Milk puddings (e.g. rice pudding)             23       5      29       25     21        4      98
19   Eggs & egg dishes                            181      41      20       16     17        7      54
20   Butter                                       115      26       9       12      5        1      37
21   Low fat spreads                              109      25       9       10      7        1      29
22   Other spreading fats                         300      68      10       11      6        1      36
23   Oils                                          26       6       1        1      1        0       2
24   Hard cooking fats                              0       0       0        0      0        0       0
25   Potatoes (e.g. boiled, mashed, baked)        367      83      84       60     69       20     196
26   Processed & homemade potato products         108      24      27       23     19        6      74
27   Chipped, fried & roasted potatoes            409      93      67       49     57       13     160
28   Vegetable & pulse dishes                     116      26      26       28     15        4      70
29   Peas, beans & lentils                        241      55      29       24     21        6      86
30   Green vegetables                             181      41      19       14     14        4      46
31   Carrots                                      226      51      19       15     13        4      48
32   Salad vegetables (e.g. lettuce)              192      44      17       17     11        2      60
33   Other vegetables (e.g. onions)               247      56      23       25     18        2      74
34   Tinned or jarred vegetables                   37       8     10        7       8        2      29
35   Fruit juices                                 272      62     140      120     94       27     374
36   Bananas                                      148      34     52       52      39       10     142
37   Other fruits (e.g. apples, pears)            249      56     64       94      39       10     183
38   Citrus fruit                                 78       18     47       47      31       6      171
39   Tinned fruit                                 28       6      17       23      10       4      93
Table 3.2 (continued) Mean, SD, median and percentile values of food group intakes (g/d) in consumers
only
                                                                   Consumers only
     Food group                                    n      %      Mean   SD Median           Percentiles
                                                                                           5th    95th
40   Nuts & seeds, herbs & spices                  69     16        6       9        3       0      29
41   Fish & fish products                         164     37       23      17       19       6      58
42   Fish dishes                                   14      3       48      41       32       9     135
43   Bacon & ham                                  290     66       19      16       13       3      57
44   Beef & veal                                  180     41       27      20       20       6      70
45   Lamb                                          68     15       22      18       17       6      56
46   Pork                                         104     24       21      12       17       8      48
47   Chicken, turkey & game (e.g. pheasant)       312     71       35      27       28       7      90
48   Offal & offal dishes                           0      0        0       0        0       0       0
49   Beef & veal dishes                           229     52       57      46       43      19     137
50   Lamb, pork & bacon dishes                     46     10       43      32       38       4      90
51   Poultry & game dishes                        159     36       52      31       44      16     120
52   Burgers (beef & pork)                        197     45       29      20       24      10      71
53   Sausages                                     251     57       17      13       13       4      46
54   Meat pies & pastries                          72     16       30      28       21       5      87
55   Meat products (e.g. processed meats)         337     76       37      54       24       4      84
56   Alcoholic beverages                           22      5      172     278      102       0    1174
57   Sugars, syrups, preserves & sweeteners       289     66       12      14        7       1      41
58   Chocolate confectionery                      369     84       25      20       18       5      68
59   Non-chocolate confectionery                  293     66       17      19       11       1      58
60   Savoury snacks                               331     75       17      14       13       3      46
61   Soups, sauces & miscellaneous foods          402     91       47      45       34       4     135
63   Teas                                         238     54      203     218      129      29     677
64   Coffees                                       37      8       86      79      43       21    281
65   Other beverages (e.g. water)                 405     92      455     384      357      60    1222
66   Carbonated beverages                         362     82      225     186      179      36    612
67   Diet carbonated beverages                     78     18      121     108      75       27    341
68   Squashes, cordials & fruit juice drinks      198     45      76      80       57       6     236

Food group 62 = Nutritional supplements
Table 3.3 Mean, SD, median and percentile values of food group intakes (g/d) for all males and by age group in the total population
                                                   All males 13-17y (n =224)                13-14y (n= 95)                     15-17y (n= 129)
     Food group                                 Mean SD Median Percentiles          Mean SD Median Percentiles          Mean SD Median Percentiles
                                                               5th 95th                            5th 95th                            5th 95th
 1   Rice & pasta , flours, grains & starches     45    76      31     0    123       44   103      31     0    113       45    48     34   0    145
 2   Savouries (e.g. pizzas)                      52    54      37     0    155       48    50      36     0    158       55    57     37   0    157
 3   White breads & rolls                         76    47      68     9    154       80    50      73    10    185       73    44     63   3    151
 4   Wholemeal & brown breads & rolls             23    49       0     0    122       15    25       0     0     71       30    60      0   0    172
 5   Other breads (e.g. scones, croissants)        7    13       0     0     34        6    12       0     0     34        8    14      0   0     37
 6   quot;Ready-to-eatquot; breakfast cereals             40    37      34     0    121       38    38      29     0    106       42    35     38   0    123
 7   Other breakfast cereals (e.g. porridge)      24    72       0     0    192       16    46       0     0    116       30    86      0   0    236
 8   Biscuits                                     13    19       7     0     47       12    18       6     0     51       14    20      8   0     46
 9   Cakes, pastries & buns                       13    27       0     0     59        9    17       0     0     36       16    32      0   0     73
10   Wholemilk                                   266   253     210     0    738      276   259     200     0    831      259   250    221   0    699
11   Low fat, skimmed &fortified milks            48   148       0     0    379       34    97       0     0    315       58   176      0   0    489
12   Other milks (e.g. processed milks)            9    33       0     0     81        7    25       0     0     86       10    38      0   0     81
13   Creams                                        0     2       0     0      4        0     2       0     0      4        0     1      0   0      4
14   Cheeses                                      13    19       6     0     53       11    15       5     0     50       14    21      7   0     70
15   Yoghurts                                     24    38       0     0    100       18    33       0     0     80       28    42      0   0    109
16   Icecreams                                    10    19       0     0     40        9    14       0     0     34       11    22      0   0     46
17   Puddings & chilled desserts                  11    26       0     0     48       12    23       0     0     60        9    27      0   0     47
18   Milk puddings (e.g. rice pudding)             2     8       0     0     10        1     7       0     0      9        2     9      0   0     27
19   Eggs & egg dishes                            11    17       0     0     48       12    20       0     0     58       10    14      0   0     40
20   Butter                                        3     9       0     0     24        3     9       0     0     25        3     9      0   0     22
21   Low fat spreads                               2     7       0     0     15        3     8       0     0     19        2     5      0   0     14
22   Other spreading fats                          8    12       3     0     37        8    12       3     0     33        9    13      2   0     39
23   Oils                                          0     0       0     0      1        0     0       0     0      1        0     0      0   0      1
24   Hard cooking fats                             0     0       0     0      0        0     0       0     0      0        0     0      0   0      0
25   Potatoes (e.g. boiled, mashed, baked)        82    71      68     0    217       88    72      77     0    218       78    70     63   0    219
26   Processed & homemade potato products          8    18       0     0     45        7    14       0     0     42        9    21      0   0     58
27   Chipped, fried & roasted potatoes            67    54      55     0    166       66    53      55     0    163       67    56     54   0    182
28   Vegetable & pulse dishes                      5    15       0     0     33        2     6       0     0     15        7    19      0   0     62
29   Peas, beans & lentils                        19    25      10     0     76       18    25      10     0     87       19    26     10   0     71
30   Green vegetables                              8    14       0     0     34       10    15       0     0     42        8    12      0   0     34
31   Carrots                                      11    16       5     0     42       11    13       6     0     36       11    18      4   0     48
32   Salad vegetables (e.g. lettuce)               7    14       0     0     33        6    11       0     0     32        7    16      0   0     47
33   Other vegetables (e.g. onions)               14    25       2     0     63       15    27       0     0     68       14    24      3   0     67
34   Tinned or jarred vegetables                   1     4       0     0      6        1     4       0     0     12        1     4      0   0      5
35   Fruit juices                                 87   124      36     0    333       83   110      43     0    304       90   133     32   0    377
Table 3.3 (continued) Mean, SD, median and percentile values of food group intakes (g/d) for all males and by age group in the total population
                                                  All males 13-17y (n =224)              13-14y (n= 95)                     15-17y (n= 129)
     Food group                                 Mean SD Median Percentiles         Mean SD Median Percentiles          Mean SD Median Percentiles
                                                                     5th 95th                        5th 95th                           5th 95th
36   Bananas                                      21    47      0      0    106      16     41      0     0     100      25     51      0     0    107
37   Other fruits (e.g. apples, pears)            37    98      2      0    163      30     49     11     0     145      41    122      0     0    192
38   Citrus fruit                                 10    33      0      0     80       7     27      0     0      55      12     37      0     0    110
39   Tinned fruit                                  1     7      0      0      0       0      2      0     0       0       1      9      0     0      0
40   Nuts & seeds, herbs & spices                  1     6      0      0     11       1      4      0     0       5       2      7      0     0     13
41   Fish & fish products                         10    17      0      0     44      10     16      0     0      46      10     18      0     0     44
42   Fish dishes                                   2    12      0      0      0       3     16      0     0       0       1      9      0     0      0
43   Bacon & ham                                  16    18     10      0     56      15     15     10     0      46      16     19     10     0     60
44   Beef & veal                                  15    22      0      0     67      17     24      0     0      72      13     20      0     0     54
45   Lamb                                          4    11      0      0     32       5     12      0     0      38       4     10      0     0     29
46   Pork                                          5    11      0      0     27       4      9      0     0      21       6     12      0     0     30
47   Chicken, turkey & game (e.g. pheasant)       29    31     21      0     92      27     31     18     0      96      30     31     24     0     91
48   Offal & offal dishes                          0     0      0      0      0       0      0      0     0       0       0      0      0     0      0
49   Beef & veal dishes                           34    52     15      0    109      38     67     15     0     161      31     38     14     0    104
50   Lamb, pork & bacon dishes                     5    19      0      0     44       6     22      0     0      44       5     16      0     0     47
51   Poultry & game dishes                        20    36      0      0     91      15     30      0     0      78      25     39      0     0    116
52   Burgers (beef & pork)                        14    23      0      0     64      11     18      0     0      62      17     25      0     0     73
53   Sausages                                     11    15      7      0     42      13     16      9     0      45      10     14      6     0     41
54   Meat pies & pastries                          6    19      0      0     49       8     23      0     0      45       5     16      0     0     52
55   Meat products (e.g. processed meats)         33    46     22      0     88      28     25     21     0      85      36     57     23     0    133
56   Alcoholic beverages                          12    96      0      0      0       0      0      0     0       0      22    125      0     0    137
57   Sugars, syrups, preserves & sweeteners        9    14      5      0     37       8     12      4     0      37      10     16      6     0     38
58   Chocolate confectionery                      23    22     16      0     68      21     21     15     0      69      24     23     17     0     68
59   Non-chocolate confectionery                  11    18      4      0     46      12     17      6     0      46      11     18      2     0     53
60   Savoury snacks                               10    13      6      0     41      12     15      6     0      47       9     11      6     0     29
61   Soups, sauces & miscellaneous foods          41    43     28      0    137      38     42     27     0     133      43     43     30     0    142
63   Teas                                        113   209     31      0    512      90    145     31     0     420     129    244      0     0    734
64   Coffees                                       5    24      0      0     31       6     27      0     0      34       4     22      0     0     30
65   Other beverages (e.g. water)                426   411    323      0   1305     357    373    306     0    1156     476    431    357     0   1360
66   Carbonated beverages                        207   201    165      0    615     188    161    154     0     517     222    225    183     0    660
67   Diet carbonated beverages                    21    66      0      0    173      18     59      0     0     138      23     71      0     0    186
68   Squashes, cordials & fruit juice drinks      42    79      0      0    221      48     94      0     0     259      37     67      0     0    171

Food group 62 = Nutritional supplements
Table 3.4 Mean, SD, median and percentile values of food group intakes (g/d) for all females and by age group in the total population
                                                 All females 13-17y (n=217)               13-14y (n=93)                      15-17y (n=124)
     Food group                                 Mean SD Median Percentiles          Mean SD Median Percentiles          Mean SD Median Percentiles
                                                                    5th 95th                         5th 95th                            5th 95th
 1   Rice & pasta, flours, grains & starches      34    41     23      0    115       39    47     26      0    123       30    36      19   0   105
 2   Savouries (e.g. pizzas)                      42    47     27      0    131       43    49     25      0    171       41    45      27   0   123
 3   White breads & rolls                         51    34     48      0    114       53    36     49      0    117       49    33      48   0   108
 4   Wholemeal & brown breads & rolls             16    25      5      0     79        9    16      0      0     44       21    28      10   0    93
 5   Other breads (e.g. scones, croissants)       11    19      0      0     58       12    20      0      0     64       11    18       0   0    47
 6   quot;Ready-to-eatquot; breakfast cereals             21    24     13      0     77       19    21     13      0     59       22    26      12   0    84
 7   Other breakfast cereals (e.g. porridge)       8    30      0      0     77        6    22      0      0     53       10    35       0   0    90
 8   Biscuits                                     10    13      6      0     40        9    11      7      0     34       11    14       6   0    42
 9   Cakes, pastries & buns                       11    16      0      0     44       11    15      4      0     44       10    17       0   0    45
10   Wholemilk                                   144   188     86      0    475      135   147     93      0    426      151   214      83   0   494
11   Low fat, skimmed & fortified milks           37    89      0      0    252       30    81      0      0    245       41    94       0   0   276
12   Other milks (e.g. processed milks)           10    33      0      0     72        7    25      0      0     58       11    38       0   0    83
13   Creams                                        1     2      0      0      4        1     2      0      0      4        1     2       0   0     5
14   Cheeses                                      10    14      5      0     39       11    16      3      0     48        9    12       5   0    39
15   Yoghurts                                     20    33      0      0     86       19    34      0      0     77       21    33       0   0    88
16   Icecreams                                    11    15      4      0     45       12    14      9      0     39       10    16       0   0    47
17   Puddings & chilled desserts                   8    21      0      0     44        8    25      0      0     57        8    17       0   0    43
18   Milk puddings (e.g. rice pudding)             1     9      0      0      0        2    11      0      0      0        1     7       0   0     0
19   Eggs & egg dishes                             6    11      0      0     34        5     8      0      0     22        7    13       0   0    43
20   Butter                                        2     5      0      0     10        1     5      0      0     10        2     5       0   0    11
21   Low fat spreads                               2     6      0      0     12        2     7      0      0     11        2     5       0   0    14
22   Other spreading fats                          6     8      3      0     20        5     6      3      0     18        6     9       2   0    23
23   Oils                                          0     0      0      0      0        0     0      0      0      0        0     0       0   0     0
24   Hard cooking fats                             0     0      0      0      0        0     0      0      0      0        0     0       0   0     0
25   Potatoes (e.g. boiled, mashed, baked)        58    52     49      0    157       51    52     37      0    161       63    52      55   0   157
26   Processed & homemade potato products          5    14      0      0     32        6    16      0      0     46        5    13       0   0    27
27   Chipped, fried & roasted potatoes            58    45     49      0    151       60    42     55      0    145       56    47      46   0   158
28   Vegetable & pulse dishes                      9    21      0      0     56        8    25      0      0     61        9    17       0   0    50
29   Peas, beans & lentils                        12    19      4      0     50       14    21      5      0     71       11    17       4   0    39
30   Green vegetables                              7    11      0      0     30        8    13      0      0     38        6    10       0   0    28
31   Carrots                                       8    12      0      0     37        8    13      0      0     35        8    12       3   0    37
32   Salad vegetables (e.g. lettuce)               8    14      0      0     43        6    10      0      0     30       10    17       2   0    51
33   Other vegetables (e.g. onions)               12    18      4      0     49        9    13      2      0     35       14    20       6   0    58
34   Tinned or jarred vegetables                   1     3      0      0      8        1     4      0      0     11        1     2       0   0     5
Table 3.4 (continued) Mean, SD, median and percentile values of food group intakes (g/d) for all females and by age group in the total population
                                                  All females 13-17y (n=217)                13-14y (n=93)                      15-17y (n=124)
     Food group                                 Mean SD Median Percentiles          Mean SD Median Percentiles         Mean SD Median Percentiles
                                                               5th 95th                            5th 95th                           5th 95th
35   Fruit juices                                 85   108     57      0    289      85    108     57     0    324       86    108     57     0      286
36   Bananas                                      14    28      0      0     77      10     21      0     0     66       17     32      0     0       86
37   Other fruits (e.g. apples, pears)            36    49     17      0    145      30     45     17     0    123       40     52     19     0      149
38   Citrus fruit                                  7    17      0      0     42       6     17      0     0     39        7     18      0     0       46
39   Tinned fruit                                  1     7      0      0     11       2     10      0     0      9        1      4      0     0       11
40   Nuts & seeds, herbs & spices                  1     2      0      0      5       1      2      0     0      6        0      2      0     0        4
41   Fish & fish products                          7    13      0      0     36       6     11      0     0     36        8     14      0     0       39
42   Fish dishes                                   1     9      0      0      0       1     13      0     0      0        1      5      0     0        6
43   Bacon & ham                                  10    14      6      0     36      10     13      6     0     35       10     15      6     0       40
44   Beef & veal                                   7    12      0      0     35       9     14      0     0     43        6     10      0     0       29
45   Lamb                                          3    10      0      0     18       2      5      0     0     15        3     13      0     0       28
46   Pork                                          4    10      0      0     28       4      9      0     0     29        5     11      0     0       29
47   Chicken, turkey & game (e.g. pheasant)       21    24     16      0     65      18     22     12     0     57       23     25     17     0       72
48   Offal & offal dishes                          0     0      0      0      0       0      0      0     0      0        0      0      0     0        0
49   Beef & veal dishes                           25    33     14      0     92      24     30     18     0     81       26     35     14     0      101
50   Lamb, pork & bacon dishes                     3    14      0      0     36       3     12      0     0     22        4     16      0     0       36
51   Poultry & game dishes                        17    26      0      0     69      20     28      0     0     82       14     23      0     0       61
52   Burgers (beef & pork)                        12    17      0      0     44      14     16     12     0     45       10     17      0     0       46
53   Sausages                                      8    11      5      0     28       8     11      5     0     27        8     11      5     0       29
54   Meat pies & pastries                          4    11      0      0     25       5     13      0     0     28        3      9      0     0       20
55   Meat products (e.g. processed meats)         23    52     14      0     70      18     21     14     0     70       27     67     15     0       71
56   Alcoholic beverages                           5    31      0      0      1       1     10      0     0      0        7     39      0     0       24
57   Sugars, syrups, preserves & sweeteners        6    10      2      0     25       5      7      1     0     19        7     12      2     0       35
58   Chocolate confectionery                      19    19     13      0     60      19     17     14     0     60       19     20     12     0       65
59   Non-chocolate confectionery                  11    18      4      0     44      14     19      6     0     47        9     17      3     0       44
60   Savoury snacks                               15    14     11      0     45      16     13     13     0     46       15     15     10     0       46
61   Soups, sauces & miscellaneous foods          45    47     30      0    127      47     57     28     0    132       44     38     37     1      122
63   Teas                                        106   167     31      0    497      86    129     29     0    343      122    190     36     0      539
64   Coffees                                      10    40      0      0     53       7     28      0     0     50       12     47      0     0       72
65   Other beverages (e.g. water)                410   364    310      0   1120     354    259    303     0    825      452    423    319    51     1327
66   Carbonated beverages                        161   173    106      0    536     176    168    126     0    557      150    177     88     0      527
67   Diet carbonated beverages                    22    63      0      0    121      21     60      0     0    144       23     66      0     0      136
68   Squashes, cordials & fruit juice drinks      26    46      0      0    143      31     45      6     0    125       23     47      0     0      146

Food group 62 = Nutritional supplements
Table 3.5 Mean, SD, median and percentile values of food group intakes (g/d) for all males and by age group in consumers only
                                                                                                                    Male consumers only
                                                                  13-17y                                                  13-14 y                                         15-17 y
     Food group                                  n      %    Mean SD Median           Percentiles      n      %     Mean SD Median        Percentiles   n     %    Mean    SD Median   Percentiles
                                                                                      5th   95th                                          5th   95th                                   5th   95th
 1   Rice & pasta, flours, grains & starches   143      64     70      85      53     15     147       57     60      74    125    47     19     133     86   67    67      44    60   15     148
 2   Savouries (e.g. pizzas)                   172      77     68      53      57      7     167       69     73      67     48    59      7     178    103   80    69      56    55    7     164
 3   White breads & rolls                      217      97     78      69      46     18     155       94     99      81     50    74     14     186    123   95    76      42    65   20     151
 4   Wholemeal & brown breads & rolls           96      43     55      63      39      6     208       39     41      35     29    27      5      86     57   44    68      75    43    7     264
 5   Other breads (e.g. scones, croissants)     77      34     21      15      20      5      51       30     32      20     13    17      3      44     47   36    22      16    21    5      61
 6   quot;Ready to eatquot; breakfast cereals          195      87     46      36      39      6     123       81     85      44     38    37      6     121    114   88    48      34    39    7     125
 7   Other breakfast cereals (e.g. porridge)    38      17    141     121      92     11     384       17     18      88     76    65      6     241     21   16   183     134   153   36     528
 8   Biscuits                                  150      67     20      21      14      2      61       65     68      18     19    10      2      66     85   66    21      22    16    3      63
 9   Cakes, pastries & buns                    107      48     28      33      16      4      94       43     45      21     20    15      4      81     64   50    33      39    18    6     119
10   Wholemilk                                 192      86    311     247     245     43     831       82     86     319    252   229     27     832    110   85   304     245   253   59     791
11   Low fat, skimmed & fortified milks         44      20    244     253     168     10     737       17     18     190    156   160      7     557     27   21   279     297   199   11    1029
12   Other milks (e.g. processed milks)         25      11     82      64      71     24     279        9      9      78     37    86     31     143     16   12    84      76    60   21     307
13   Creams                                     18       8      5       4       4      1      18        6      6       7      6     5      1      18     12    9     4       2     4    2       9
14   Cheeses                                   143      64     20      20      14      2      72       58     61      18     16    13      2      54     85   66    22      23    14    2      76
15   Yoghurts                                   96      43     55      41      47     13     137       37     39      47     38    37      7     168     59   46    61      42    54   14     132
16   Icecreams                                 103      46     22      23      14      7      72       45     47      19     15    13      7      60     58   45    24      27    14    7      82
17   Puddings & chilled desserts                70      31     34      37      25      8      71       34     36      33     29    26      4      99     36   28    34      43    21    8      95
18   Milk puddings (e.g. rice pudding)          15       7     26      19      25      3      64        6      6      18     23    10      3      64      9    7    31      16    29    7      64
19   Eggs & egg dishes                         109      49     22      18      17      7      59       46     48      25     22    17      7      84     63   49    20      14    17    6      51
20   Butter                                     61      27     11      13       5      1      44       27     28      12     13     7      1      43     34   26    11      14     4    1      47
21   Low fat spreads                            54      24     10      10       7      2      32       24     25      12     13     9      2      52     30   23     8       7     6    1      26
22   Other spreading fats                      154      69     12      13       7      1      39       65     68      12     13     6      1      37     89   69    13      14     8    1      46
23   Oils                                       19       8      1       1       1      0       3       10     11       1      1     1      0       3      9    7     1       0     1    0       1
24   Hard cooking fats                           0       0      0       0       0      0       0        0      0       0      0     0      0       0      0    0     0       0     0    0       0
25   Potatoes (e.g. boiled, mashed, baked)     190      85     97      67      81     20     228       82     86     102     67    87     24     242    108   84    93      66    75   20     229
26   Processed & homemade potato products       58      26     30      25      24      6      67       25     26      26     15    19      4      55     33   26    33      30    26    5     115
27   Chipped, fried & roasted potatoes         209      93     71      53      58     12     174       88     93      71     51    60     13     165    121   94    72      55    58    9     183
28   Vegetable & pulse dishes                   50      22     24      25      15      3      72       18     19      12      8    10      4      36     32   25    30      29    17    3      93
29   Peas, beans & lentils                     129      58     33      26      29      6      91       55     58      32     26    28      6     100     74   57    34      25    29    7      86
30   Green vegetables                           96      43     20      15      16      5      52       42     44      22     16    17      5      59     54   42    18      14    14    5      41
31   Carrots                                   119      53     21      17      15      4      50       51     54      20     12    16      4      43     68   53    21      19    13    4      71
32   Salad vegetables (e.g. lettuce)            84      38     17      18      11      2      61       34     36      17     14    16      1      46     50   39    18      21     8    2      65
33   Other vegetables (e.g. onions)            119      53     27      29      20      2      90       46     48      31     32    23      1      97     73   57    24      27    18    2      81
34   Tinned or jarred vegetables                17       8     11       8       7      1      29        7      7      12      7    12      3      22     10    8     9      10     6    1      29
Table 3.5 (continued) Mean, SD, median and percentile values of food group intakes (g/d) for all males and by age group in consumers only
                                                                                                                    Male consumers only
                                                                  13-17y                                                  13-14 y                                           15-17 y
     Food group                                  n      %     Mean SD Median          Percentiles      n      %     Mean SD Median          Percentiles   n     %    Mean    SD Median   Percentiles
                                                                                      5th   95th                                            5th   95th                                   5th   95th
35   Fruit juices                              129      58    151     130     115     29     443       56     59     140    112     104      7     359     73   57   160     143   120   29     501
36   Bananas                                    77      34     60      64      42     10     186       27     28      55     63      31      6     227     50   39    63      65    49   10     142
37   Other fruits (e.g. apples, pears)         113      50     73     128      41      9     225       53     56      54     55      33      7     167     60   47    89     167    45    9     259
38   Citrus fruit                               35      16     63      62      40      6     190       15     16      46     55      18      6     212     20   16    75      65    59    6     184
39   Tinned fruit                                7       3     22      33       6      4      96        2      2      11      9      11      5      17      5    4    27      40     6    4      96
40   Nuts & seeds, herbs & spices               31      14     10      12       5      0      41       11     12       7     10       3      0      29     20   16    12      13     6    0      45
41   Fish & fish products                       87      39     26      20      19      6      67       41     43      24     17      18      7      67     46   36    27      22    19    6      74
42   Fish dishes                                 7       3     60      38      49     26     135        3      3      81     49      69     38     135      4    3    45      23    39   26      75
43   Bacon & ham                               159      71     22      17      17      4      60       71     75      19     15      15      4      51     88   68    24      19    18    3      62
44   Beef & veal                               105      47     32      22      25      7      82       47     49      34     24      25      7      88     58   45    30      20    24    6      77
45   Lamb                                      105      47      4      11       0      0      33       47     49       5     12       0      0      40     58   45     4      10     0    0      35
46   Pork                                      141      63     52      41      39     11     125       21     22      19     10      17      7      54     36   28    22      12    18    9      52
47   Chicken, turkey & game (e.g. pheasant)    166      74     39      30      30      9      96       71     75      36     31      24      8     106     95   74    41      29    34    9      94
48   Offal & offal dishes                        0       0      0       0       0      0       0        0      0       0      0       0      0       0      0    0     0       0     0    0       0
49   Beef & veal dishes                        117      52     66      56      50     15     158       49     52      74     78      43     17     259     68   53    59      32    50   14     125
50   Lamb, pork & bacon dishes                  28      13     43      35      37      8     137       14     15      43     43      31     10     177     14   11    44      26    44    6      89
51   Poultry & game dishes                      75      33     61      36      58     15     131       26     27      55     35      48     15     153     49   38    65      36    61   14     142
52   Burgers (beef & pork)                      99      44     33      24      26     10      79       37     39      28     18      24      7      70     62   48    35      26    28   10     101
53   Sausages                                  131      58     19      15      14      4      54       59     62      21     15      17      6      54     72   56    18      15    13    4      55
54   Meat pies & pastries                       35      16     39      34      29      6     120       18     19      40     39      25     12     180     17   13    38      29    29    6     105
55   Meat products (e.g. processed meats)      178      79     41      49      29      6      95       80     84      33     24      26      3      86     98   76    48      61    31    6     152
56   Alcoholic beverages                        10       4    278     380     190     47    1331        0      0       0      0       0      0       0     10    8   278     380   190   47    1331
57   Sugars, syrups, preserves & sweeteners    149      67     14      15       9      1      47       64     67      12     12       8      1      45     85   66    16      17    11    1      58
58   Chocolate confectionery                   186      83     27      21      21      6      70       81     85      25     21      20      5      70    105   81    29      22    22    6      70
59   Non-chocolate confectionery               134      60     19      19      14      1      60       60     63      18     19      14      1      58     74   57    20      20    14    1      66
60   Savoury snacks                            147      66     15      13      11      3      45       66     69      17     15      11      3      50     81   63    14      11    11    3      41
61   Soups, sauces & miscellaneous foods       199      89     46      43      33      3     140       83     87      43     43      32      3     138    116   90    48      43    35    3     148
63   Teas                                      119      53    212     247     115     29     761       56     59     153    162      99     27     502     63   49   265     295   154   31     854
64   Coffees                                    15       7     74      63      37     11     195        8      8      74     66      35     11     170      7    5    75      64    37   30     195
65   Other beverages (e.g. water)              199      89    479     405     359     46    1359       83     87     409    372     328     63    1188    116   90   529     422   381   43    1382
66   Carbonated beverages                      187      83    248     195     200     43     626       82     86     218    154     184     36     550    105   81   272     220   214   47     723
67   Diet carbonated beverages                  35      16    134     114      86     23     361       14     15     123    107      83     23     332     21   16   141     121    86   24     464
68   Squashes, cordials & fruit juice drinks   103      46     90      97      62      7     317       47     49      97    115      45      7     424     56   43    85      79    69    6     297
Food group 62 = Nutritional supplements
Table 3.6 Mean, SD, median and percentile values of food group intakes (g/d) for all females and by age group in consumers only
                                                                                                              Female consumers only
                                                                13-17 y                                              13-14 y                                         15-17 y
     Food group                                 n      %    Mean SD Median Percentiles               n      % Mean SD Median Percentiles           n     %    Mean    SD Median Percentiles
                                                                           5th 95th                                                 5th 95th                                    5th 95th
 1   Rice & pasta, flours, grains & starches   141    65      52     41      39     11     125       67     72      55     47      41   11   136    74   60    50      34    39   8    125
 2   Savouries (e.g. pizzas)                   165    76      55     46      45     9      145       68     73      58     49      41   5    178    97   78    53      45    46   9    126
 3   White breads & rolls                      205    94      54     50      33     8      115       87     94      57     34      55   9    118   118   95    52      32    49   8    108
 4   Wholemeal & brown breads & rolls          114    53      30     27      22     5       97       39     42      22     19      14   5     75    75   60    35      29    27   5    102
 5   Other breads (e.g. scones, croissants)    103    47      24     22      16     6       68       42     45      27     23      19   6     88    61   49    21      20    14   5     66
 6   quot;Ready to eatquot; breakfast cereals          163    75      28     24      20     5       84       69     74      26     20      21   6     65    94   76    29      26    20   4     85
 7   Other breakfast cereals (e.g. porridge)   27     12      67     58      42     7      188       10     11      54     46      42   6    134    17   14    74      65    42   11   207
 8   Biscuits                                  154    71      15     14      10     2       46       67     72      13     11      11   1     43    87   70    16      15    9    2     48
 9   Cakes, pastries & buns                    106    49      22     18      17     4       61       52     56      20     16      15   4     61    54   44    23      19    17   4     63
10   Wholemilk                                 168    77     186    195     140     9      522       74     80     169    146     137   13   497    94   76   199     226   143   8    540
11   Low fat, skimmed & fortified milks        62     29     128    126      91     7      439       22     24     129    125     102   5    483    40   32   128     128    69   7    441
12   Other milks (e.g. processed milks)        28     13      76     59      52     19     234       10     11      69     39      54   34   147    18   15    79      69    51   14   304
13   Creams                                    30     14      5      4       4      1       15       10     11      6      5       4    1     17    20   16    5       4     3    1     14
14   Cheeses                                   129    59      17     14      12     2       48       51     55      20     17      14   2     67    78   63    15      12    10   2     43
15   Yoghurts                                  95     44      46     36      39     9      129       37     40      47     39      43   8    153    58   47    46      34    36   8    128
16   Icecreams                                 110    51      21     15      18     7       56       55     59      20     12      18   7     52    55   44    22      18    18   5     65
17   Puddings & chilled desserts               66     30      27     30      16     4       95       23     25      33     41      19   4    164    43   35    24      22    16   3     81
18   Milk puddings (e.g. rice pudding)          8     4       35     34      21     7      106       3      3       48     50      21   17   106    5    4     27      23    21   7     66
19   Eggs & egg dishes                         72     33      18     13      17     7       44       32     34      14     8       9    6     34    40   32    21      14    17   7     51
20   Butter                                    54     25      7      9       3      1       29       18     19      7      11      3    1     47    36   29    7       8     4    1     28
21   Low fat spreads                           55     25      9      9       7      1       24       22     24      9      13      4    2     54    33   27    9       6     9    1     22
22   Other spreading fats                      146    67      8      8       5      1       23       66     71      7      6       5    1     19    80   65    9       10    5    1     26
23   Oils                                       7     3       1      0       1      0       2        4      4       1      0       1    0     1     3    2     1       1     1    0     2
24   Hard cooking fats                          0     0       0      0       0      0       0        0      0       0      0       0    0     0     0    0     0       0     0    0     0
25   Potatoes (e.g. boiled, mashed, baked)     177    82      71     49      57     17     162       70     75      68     50      52   14   174   107   86    73      49    62   20   160
26   Processed & homemade potato products      50     23      24     21      16     6       76       20     22      26     26      16   5    101    30   24    22      18    16   6     75
27   Chipped, fried & roasted potatoes         200    92      63     43      55     14     153       86     92      65     40      57   14   148   114   92    61      46    52   11   163
28   Vegetable & pulse dishes                  66     30      28     29      16     5       85       18     19      40     43      22   3    173    48   39    24      21    16   6     63
29   Peas, beans & lentils                     112    52      24     20      18     5       79       49     53      26     23      19   5     89    63   51    22      17    17   4     56
30   Green vegetables                          85     39      17     12      14     4       44       38     41      19     15      13   4     58    47   38    16      9     14   4     36
31   Carrots                                   107    49      17     13      13     5       41       44     47      17     14      12   5     54    63   51    17      12    13   3     41
32   Salad vegetables (e.g. lettuce)           108    50      17     17      11     2       53       38     41      14     11      11   2     32    70   56    18      19    11   1     61
33   Other vegetables (e.g. onions)            128    59      20     19      15     2       65       50     54      17     14      13   0     44    78   63    22      21    16   3     72
34   Tinned or jarred vegetables               20     9       9      7       8      3       29       9      10      12     8       10   4     29    11   9     7       5     6    3     16
Table 3.6 (continued) Mean, SD, median and percentile values of food group intakes (g/d) for all females and by age group in consumers only
                                                                                                              Female consumers only
                                                                13-17 y                                              13-14 y                                           15-17 y
     Food group                                 n     %     Mean SD Median Percentiles               n      % Mean SD Median Percentiles             n     %    Mean    SD Median Percentiles
                                                                           5th 95th                                                 5th 95th                                      5th 95th
35   Fruit juices                              143    66     130    109      91     23    341        64     69    124     111     88      20   350    79   64   134     109    91   29   343
36   Bananas                                   71     33      43     33      30     12    107        26     28     36      25     23      14    91    45   36    46      37    35   10   146
37   Other fruits (e.g. apples, pears)         136    63      57     52      38     11    161        56     60     49      48     32      9    149    80   65    62      53    45   12   177
38   Citrus fruit                              43     20      34     25      30     7      94        15     16     38      24     33      8     88    28   23    32      26    26   6    101
39   Tinned fruit                              21     10      15     18      11     4      84        10     11     18      26     7       4     89    11   9     12      6     11   5     23
40   Nuts & seeds, herbs & spices              38     18      3      4       2      0      12        17     18     4       4      2       0     15    21   17    3       3     2    0     12
41   Fish & fish products                      77     35      21     14      16     4      44        26     28     22      11     21      4     41    51   41    20      15    16   5     56
42   Fish dishes                                7     3       35     42      20     9     128        1      1     128      0     128     128   128    6    5     19      9     17   9     33
43   Bacon & ham                               131    60      16     15      12     3      51        55     59     17      13     13      3     51    76   61    16      16    11   3     52
44   Beef & veal                               75     35      20     13      16     6      49        35     38     23      15     16      5     59    40   32    18      10    16   7     38
45   Lamb                                      75     35      3      14      0      0      20        35     38     1       4      0       0     15    40   32    5       19    0    0     32
46   Pork                                      47     22      20     12      17     5      47        20     22     19      12     14      4     44    27   22    22      13    17   5     54
47   Chicken, turkey & game (e.g. pheasant)    146    67      31     23      26     7      75        56     60     30      20     27      6     70    90   73    32      25    25   7     77
48   Offal & offal dishes                       0     0       0      0       0      0      0         0      0      0       0      0       0     0     0    0     0       0     0    0     0
49   Beef & veal dishes                        112    52      49     31      40     19    112        47     51     48      24     40      22    98    65   52    50      35    40   14   129
50   Lamb, pork & bacon dishes                 18     8       41     29      40     4      91        7      8      34      28     43      4     81    11   9     46      30    36   4     91
51   Poultry & game dishes                     84     39      43     23      37     16     94        40     43     47      24     43      17    97    44   35    41      22    31   14    86
52   Burgers (beef & pork)                     98     45      26     16      23     8      53        51     55     25      14     22      8     52    47   38    26      17    24   7     55
53   Sausages                                  120    55      14     11      10     4      32        53     57     13      11     9       3     34    67   54    15      11    11   4     39
54   Meat pies & pastries                      37     17      22     19      16     3      65        17     18     26      21     20      6     90    20   16    18      16    15   3     61
55   Meat products (e.g. processed meats)      159    73      32     59      21     4      74        66     71     26      20     20      4     78    93   75    36      75    21   4     73
56   Alcoholic beverages                       12     6       84    106      30     0     286        1      1      93      0      93      93    93    11   9     83     111    29   0    286
57   Sugars, syrups, preserves & sweeteners    140    65      9      11      5      1      29        59     63     7       7      5       1     25    81   65    10      13    5    1     44
58   Chocolate confectionery                   183    84      22     18      16     3      64        85     91     21      17     15      3     61    98   79    24      20    17   3     69
59   Non-chocolate confectionery               159    73      15     19      8      0      56        74     80     17      19     10      0     54    85   69    13      19    6    0     59
60   Savoury snacks                            184    85      18     14      14     3      50        85     91     17      13     14      4     49    99   80    19      15    15   2     51
61   Soups, sauces & miscellaneous foods       203    94      49     47      37     4     129        84     90     52      58     30      3    136   119   96    46      38    39   4    123
63   Teas                                      119    55     194    185     138     28    553        51     55    157     139    132      21   457    68   55   222     209   152   30   637
64   Coffees                                   22     10      94     89      48     23    321        8      9      78      64     54      29   218    14   11   104     101    47   23   329
65   Other beverages (e.g. water)              206    95     432    361     323     64    1138       86     92    383     247    320      48   832   120   97   467     422   345   65   1331
66   Carbonated beverages                      175    81     200    172     143     31    592        82     88    200     165    145      31   583    93   75   201     178   140   31   629
67   Diet carbonated beverages                 43     20     111    102      71     27    354        17     18    114      96     71      14   357    26   21   108     108    77   27   453
68   Squashes, cordials & fruit juice drinks   95     44      60     53      49     6     201        50     54     57      48     51      5    164    45   36    64      59    49   6    208
Food group 62 = Nutritional supplements

Weitere ähnliche Inhalte

Ähnlich wie NTFS - Chapter 3 Tables (18)

New
NewNew
New
 
Title
TitleTitle
Title
 
Craig
CraigCraig
Craig
 
HELLO
HELLOHELLO
HELLO
 
Title
TitleTitle
Title
 
Title
TitleTitle
Title
 
Title
TitleTitle
Title
 
Title
TitleTitle
Title
 
Title
TitleTitle
Title
 
Title
TitleTitle
Title
 
Title
TitleTitle
Title
 
cvbcvb
cvbcvbcvbcvb
cvbcvb
 
aasdasd
aasdasdaasdasd
aasdasd
 
xczcz
xczczxczcz
xczcz
 
Can+you+see+me%3f
Can+you+see+me%3fCan+you+see+me%3f
Can+you+see+me%3f
 
zxczxczxc
zxczxczxczxczxczxc
zxczxczxc
 
Indice Glicemico Alimentos
Indice Glicemico AlimentosIndice Glicemico Alimentos
Indice Glicemico Alimentos
 
Tabela kcal
Tabela kcalTabela kcal
Tabela kcal
 

Mehr von LBG

Ink ex pop_up
Ink ex pop_upInk ex pop_up
Ink ex pop_upLBG
 
INKEx FAS placement
INKEx FAS placementINKEx FAS placement
INKEx FAS placementLBG
 
NTFS - Chapter 6 Tables
NTFS - Chapter 6 TablesNTFS - Chapter 6 Tables
NTFS - Chapter 6 TablesLBG
 
NTFS - Chapter 5 Tables
NTFS - Chapter 5 TablesNTFS - Chapter 5 Tables
NTFS - Chapter 5 TablesLBG
 
NTFS - Chapter 4 Tables
NTFS - Chapter 4 TablesNTFS - Chapter 4 Tables
NTFS - Chapter 4 TablesLBG
 
NTFS - Chapter 2 Tables
NTFS - Chapter 2 TablesNTFS - Chapter 2 Tables
NTFS - Chapter 2 TablesLBG
 
NTFS - Chapter 1 Methodology
NTFS - Chapter 1 MethodologyNTFS - Chapter 1 Methodology
NTFS - Chapter 1 MethodologyLBG
 
NTFS - Chapter 1 Background
NTFS - Chapter 1 BackgroundNTFS - Chapter 1 Background
NTFS - Chapter 1 BackgroundLBG
 
NTFS - Table of Contents
NTFS - Table of ContentsNTFS - Table of Contents
NTFS - Table of ContentsLBG
 
NFTS - Summary Report Tables
NFTS - Summary Report TablesNFTS - Summary Report Tables
NFTS - Summary Report TablesLBG
 
NTFS - Summary Report
NTFS - Summary ReportNTFS - Summary Report
NTFS - Summary ReportLBG
 
NS - Food Survey Full Report 2001
NS - Food Survey Full Report 2001NS - Food Survey Full Report 2001
NS - Food Survey Full Report 2001LBG
 
NS - Food Survey Summary 2001
NS - Food Survey Summary 2001NS - Food Survey Summary 2001
NS - Food Survey Summary 2001LBG
 
NCFS - C6 T6 P1to11
NCFS - C6 T6 P1to11NCFS - C6 T6 P1to11
NCFS - C6 T6 P1to11LBG
 
NCFS C4 T4 13to44
NCFS C4 T4 13to44NCFS C4 T4 13to44
NCFS C4 T4 13to44LBG
 
NCFS - Contents
NCFS - ContentsNCFS - Contents
NCFS - ContentsLBG
 
NCFS - Methodology
NCFS - MethodologyNCFS - Methodology
NCFS - MethodologyLBG
 
NCFS - Background
NCFS - BackgroundNCFS - Background
NCFS - BackgroundLBG
 
NCFS - C2 T2 P1to10
NCFS - C2 T2 P1to10NCFS - C2 T2 P1to10
NCFS - C2 T2 P1to10LBG
 
NCFS - C4 T4 P1to12
NCFS - C4 T4 P1to12NCFS - C4 T4 P1to12
NCFS - C4 T4 P1to12LBG
 

Mehr von LBG (20)

Ink ex pop_up
Ink ex pop_upInk ex pop_up
Ink ex pop_up
 
INKEx FAS placement
INKEx FAS placementINKEx FAS placement
INKEx FAS placement
 
NTFS - Chapter 6 Tables
NTFS - Chapter 6 TablesNTFS - Chapter 6 Tables
NTFS - Chapter 6 Tables
 
NTFS - Chapter 5 Tables
NTFS - Chapter 5 TablesNTFS - Chapter 5 Tables
NTFS - Chapter 5 Tables
 
NTFS - Chapter 4 Tables
NTFS - Chapter 4 TablesNTFS - Chapter 4 Tables
NTFS - Chapter 4 Tables
 
NTFS - Chapter 2 Tables
NTFS - Chapter 2 TablesNTFS - Chapter 2 Tables
NTFS - Chapter 2 Tables
 
NTFS - Chapter 1 Methodology
NTFS - Chapter 1 MethodologyNTFS - Chapter 1 Methodology
NTFS - Chapter 1 Methodology
 
NTFS - Chapter 1 Background
NTFS - Chapter 1 BackgroundNTFS - Chapter 1 Background
NTFS - Chapter 1 Background
 
NTFS - Table of Contents
NTFS - Table of ContentsNTFS - Table of Contents
NTFS - Table of Contents
 
NFTS - Summary Report Tables
NFTS - Summary Report TablesNFTS - Summary Report Tables
NFTS - Summary Report Tables
 
NTFS - Summary Report
NTFS - Summary ReportNTFS - Summary Report
NTFS - Summary Report
 
NS - Food Survey Full Report 2001
NS - Food Survey Full Report 2001NS - Food Survey Full Report 2001
NS - Food Survey Full Report 2001
 
NS - Food Survey Summary 2001
NS - Food Survey Summary 2001NS - Food Survey Summary 2001
NS - Food Survey Summary 2001
 
NCFS - C6 T6 P1to11
NCFS - C6 T6 P1to11NCFS - C6 T6 P1to11
NCFS - C6 T6 P1to11
 
NCFS C4 T4 13to44
NCFS C4 T4 13to44NCFS C4 T4 13to44
NCFS C4 T4 13to44
 
NCFS - Contents
NCFS - ContentsNCFS - Contents
NCFS - Contents
 
NCFS - Methodology
NCFS - MethodologyNCFS - Methodology
NCFS - Methodology
 
NCFS - Background
NCFS - BackgroundNCFS - Background
NCFS - Background
 
NCFS - C2 T2 P1to10
NCFS - C2 T2 P1to10NCFS - C2 T2 P1to10
NCFS - C2 T2 P1to10
 
NCFS - C4 T4 P1to12
NCFS - C4 T4 P1to12NCFS - C4 T4 P1to12
NCFS - C4 T4 P1to12
 

Kürzlich hochgeladen

Call Girls in Dwarka Mor Delhi Contact Us 9654467111
Call Girls in Dwarka Mor Delhi Contact Us 9654467111Call Girls in Dwarka Mor Delhi Contact Us 9654467111
Call Girls in Dwarka Mor Delhi Contact Us 9654467111Sapana Sha
 
CARE OF CHILD IN INCUBATOR..........pptx
CARE OF CHILD IN INCUBATOR..........pptxCARE OF CHILD IN INCUBATOR..........pptx
CARE OF CHILD IN INCUBATOR..........pptxGaneshChakor2
 
Web & Social Media Analytics Previous Year Question Paper.pdf
Web & Social Media Analytics Previous Year Question Paper.pdfWeb & Social Media Analytics Previous Year Question Paper.pdf
Web & Social Media Analytics Previous Year Question Paper.pdfJayanti Pande
 
Arihant handbook biology for class 11 .pdf
Arihant handbook biology for class 11 .pdfArihant handbook biology for class 11 .pdf
Arihant handbook biology for class 11 .pdfchloefrazer622
 
Advanced Views - Calendar View in Odoo 17
Advanced Views - Calendar View in Odoo 17Advanced Views - Calendar View in Odoo 17
Advanced Views - Calendar View in Odoo 17Celine George
 
BASLIQ CURRENT LOOKBOOK LOOKBOOK(1) (1).pdf
BASLIQ CURRENT LOOKBOOK  LOOKBOOK(1) (1).pdfBASLIQ CURRENT LOOKBOOK  LOOKBOOK(1) (1).pdf
BASLIQ CURRENT LOOKBOOK LOOKBOOK(1) (1).pdfSoniaTolstoy
 
Sports & Fitness Value Added Course FY..
Sports & Fitness Value Added Course FY..Sports & Fitness Value Added Course FY..
Sports & Fitness Value Added Course FY..Disha Kariya
 
9548086042 for call girls in Indira Nagar with room service
9548086042  for call girls in Indira Nagar  with room service9548086042  for call girls in Indira Nagar  with room service
9548086042 for call girls in Indira Nagar with room servicediscovermytutordmt
 
Paris 2024 Olympic Geographies - an activity
Paris 2024 Olympic Geographies - an activityParis 2024 Olympic Geographies - an activity
Paris 2024 Olympic Geographies - an activityGeoBlogs
 
mini mental status format.docx
mini    mental       status     format.docxmini    mental       status     format.docx
mini mental status format.docxPoojaSen20
 
Separation of Lanthanides/ Lanthanides and Actinides
Separation of Lanthanides/ Lanthanides and ActinidesSeparation of Lanthanides/ Lanthanides and Actinides
Separation of Lanthanides/ Lanthanides and ActinidesFatimaKhan178732
 
Introduction to Nonprofit Accounting: The Basics
Introduction to Nonprofit Accounting: The BasicsIntroduction to Nonprofit Accounting: The Basics
Introduction to Nonprofit Accounting: The BasicsTechSoup
 
The Most Excellent Way | 1 Corinthians 13
The Most Excellent Way | 1 Corinthians 13The Most Excellent Way | 1 Corinthians 13
The Most Excellent Way | 1 Corinthians 13Steve Thomason
 
Accessible design: Minimum effort, maximum impact
Accessible design: Minimum effort, maximum impactAccessible design: Minimum effort, maximum impact
Accessible design: Minimum effort, maximum impactdawncurless
 
Measures of Central Tendency: Mean, Median and Mode
Measures of Central Tendency: Mean, Median and ModeMeasures of Central Tendency: Mean, Median and Mode
Measures of Central Tendency: Mean, Median and ModeThiyagu K
 
Q4-W6-Restating Informational Text Grade 3
Q4-W6-Restating Informational Text Grade 3Q4-W6-Restating Informational Text Grade 3
Q4-W6-Restating Informational Text Grade 3JemimahLaneBuaron
 
BAG TECHNIQUE Bag technique-a tool making use of public health bag through wh...
BAG TECHNIQUE Bag technique-a tool making use of public health bag through wh...BAG TECHNIQUE Bag technique-a tool making use of public health bag through wh...
BAG TECHNIQUE Bag technique-a tool making use of public health bag through wh...Sapna Thakur
 
Kisan Call Centre - To harness potential of ICT in Agriculture by answer farm...
Kisan Call Centre - To harness potential of ICT in Agriculture by answer farm...Kisan Call Centre - To harness potential of ICT in Agriculture by answer farm...
Kisan Call Centre - To harness potential of ICT in Agriculture by answer farm...Krashi Coaching
 
The basics of sentences session 2pptx copy.pptx
The basics of sentences session 2pptx copy.pptxThe basics of sentences session 2pptx copy.pptx
The basics of sentences session 2pptx copy.pptxheathfieldcps1
 

Kürzlich hochgeladen (20)

Call Girls in Dwarka Mor Delhi Contact Us 9654467111
Call Girls in Dwarka Mor Delhi Contact Us 9654467111Call Girls in Dwarka Mor Delhi Contact Us 9654467111
Call Girls in Dwarka Mor Delhi Contact Us 9654467111
 
Mattingly "AI & Prompt Design: Structured Data, Assistants, & RAG"
Mattingly "AI & Prompt Design: Structured Data, Assistants, & RAG"Mattingly "AI & Prompt Design: Structured Data, Assistants, & RAG"
Mattingly "AI & Prompt Design: Structured Data, Assistants, & RAG"
 
CARE OF CHILD IN INCUBATOR..........pptx
CARE OF CHILD IN INCUBATOR..........pptxCARE OF CHILD IN INCUBATOR..........pptx
CARE OF CHILD IN INCUBATOR..........pptx
 
Web & Social Media Analytics Previous Year Question Paper.pdf
Web & Social Media Analytics Previous Year Question Paper.pdfWeb & Social Media Analytics Previous Year Question Paper.pdf
Web & Social Media Analytics Previous Year Question Paper.pdf
 
Arihant handbook biology for class 11 .pdf
Arihant handbook biology for class 11 .pdfArihant handbook biology for class 11 .pdf
Arihant handbook biology for class 11 .pdf
 
Advanced Views - Calendar View in Odoo 17
Advanced Views - Calendar View in Odoo 17Advanced Views - Calendar View in Odoo 17
Advanced Views - Calendar View in Odoo 17
 
BASLIQ CURRENT LOOKBOOK LOOKBOOK(1) (1).pdf
BASLIQ CURRENT LOOKBOOK  LOOKBOOK(1) (1).pdfBASLIQ CURRENT LOOKBOOK  LOOKBOOK(1) (1).pdf
BASLIQ CURRENT LOOKBOOK LOOKBOOK(1) (1).pdf
 
Sports & Fitness Value Added Course FY..
Sports & Fitness Value Added Course FY..Sports & Fitness Value Added Course FY..
Sports & Fitness Value Added Course FY..
 
9548086042 for call girls in Indira Nagar with room service
9548086042  for call girls in Indira Nagar  with room service9548086042  for call girls in Indira Nagar  with room service
9548086042 for call girls in Indira Nagar with room service
 
Paris 2024 Olympic Geographies - an activity
Paris 2024 Olympic Geographies - an activityParis 2024 Olympic Geographies - an activity
Paris 2024 Olympic Geographies - an activity
 
mini mental status format.docx
mini    mental       status     format.docxmini    mental       status     format.docx
mini mental status format.docx
 
Separation of Lanthanides/ Lanthanides and Actinides
Separation of Lanthanides/ Lanthanides and ActinidesSeparation of Lanthanides/ Lanthanides and Actinides
Separation of Lanthanides/ Lanthanides and Actinides
 
Introduction to Nonprofit Accounting: The Basics
Introduction to Nonprofit Accounting: The BasicsIntroduction to Nonprofit Accounting: The Basics
Introduction to Nonprofit Accounting: The Basics
 
The Most Excellent Way | 1 Corinthians 13
The Most Excellent Way | 1 Corinthians 13The Most Excellent Way | 1 Corinthians 13
The Most Excellent Way | 1 Corinthians 13
 
Accessible design: Minimum effort, maximum impact
Accessible design: Minimum effort, maximum impactAccessible design: Minimum effort, maximum impact
Accessible design: Minimum effort, maximum impact
 
Measures of Central Tendency: Mean, Median and Mode
Measures of Central Tendency: Mean, Median and ModeMeasures of Central Tendency: Mean, Median and Mode
Measures of Central Tendency: Mean, Median and Mode
 
Q4-W6-Restating Informational Text Grade 3
Q4-W6-Restating Informational Text Grade 3Q4-W6-Restating Informational Text Grade 3
Q4-W6-Restating Informational Text Grade 3
 
BAG TECHNIQUE Bag technique-a tool making use of public health bag through wh...
BAG TECHNIQUE Bag technique-a tool making use of public health bag through wh...BAG TECHNIQUE Bag technique-a tool making use of public health bag through wh...
BAG TECHNIQUE Bag technique-a tool making use of public health bag through wh...
 
Kisan Call Centre - To harness potential of ICT in Agriculture by answer farm...
Kisan Call Centre - To harness potential of ICT in Agriculture by answer farm...Kisan Call Centre - To harness potential of ICT in Agriculture by answer farm...
Kisan Call Centre - To harness potential of ICT in Agriculture by answer farm...
 
The basics of sentences session 2pptx copy.pptx
The basics of sentences session 2pptx copy.pptxThe basics of sentences session 2pptx copy.pptx
The basics of sentences session 2pptx copy.pptx
 

NTFS - Chapter 3 Tables

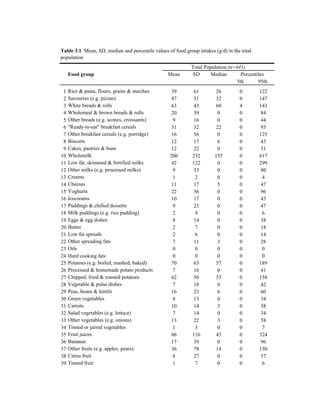
  • 1. Table 3.1 Mean, SD, median and percentile values of food group intakes (g/d) in the total population Total Population (n=441) Food group Mean SD Median Percentiles 5th 95th 1 Rice & pasta, flours, grains & starches 39 61 26 0 122 2 Savouries (e.g. pizzas) 47 51 32 0 147 3 White breads & rolls 63 43 60 4 143 4 Wholemeal & brown breads & rolls 20 39 0 0 84 5 Other breads (e.g. scones, croissants) 9 16 0 0 44 6 quot;Ready-to-eatquot; breakfast cereals 31 32 22 0 93 7 Other breakfast cereals (e.g. porridge) 16 56 0 0 125 8 Biscuits 12 17 6 0 43 9 Cakes, pastries & buns 12 22 0 0 51 10 Wholemilk 206 232 155 0 617 11 Low fat, skimmed & fortified milks 42 122 0 0 299 12 Other milks (e.g. processed milks) 9 33 0 0 80 13 Creams 1 2 0 0 4 14 Cheeses 11 17 5 0 47 15 Yoghurts 22 36 0 0 96 16 Icecreams 10 17 0 0 43 17 Puddings & chilled desserts 9 23 0 0 47 18 Milk puddings (e.g. rice pudding) 2 9 0 0 6 19 Eggs & egg dishes 8 14 0 0 38 20 Butter 2 7 0 0 18 21 Low fat spreads 2 6 0 0 14 22 Other spreading fats 7 11 3 0 28 23 Oils 0 0 0 0 0 24 Hard cooking fats 0 0 0 0 0 25 Potatoes (e.g. boiled, mashed, baked) 70 63 57 0 189 26 Processed & homemade potato products 7 16 0 0 41 27 Chipped, fried & roasted potatoes 62 50 53 0 158 28 Vegetable & pulse dishes 7 18 0 0 42 29 Peas, beans & lentils 16 23 6 0 60 30 Green vegetables 8 13 0 0 34 31 Carrots 10 14 3 0 38 32 Salad vegetables (e.g. lettuce) 7 14 0 0 34 33 Other vegetables (e.g. onions) 13 22 3 0 58 34 Tinned or jarred vegetables 1 3 0 0 7 35 Fruit juices 86 116 43 0 324 36 Bananas 17 39 0 0 96 37 Other fruits (e.g. apples, pears) 36 78 14 0 150 38 Citrus fruit 8 27 0 0 57 39 Tinned fruit 1 7 0 0 6
  • 2. Table 3.1 (continued) Mean, SD, median and percentile values of food group intakes (g/d) in the total population Total Population (n=441) Food group Percentiles Mean SD Median 5th 95th 40 Nuts & seeds, herbs & spices 1 4 0 0 6 41 Fish & fish products 9 15 0 0 41 42 Fish dishes 2 11 0 0 0 43 Bacon & ham 13 16 7 0 50 44 Beef & veal 11 18 0 0 48 45 Lamb 3 11 0 0 25 46 Pork 5 10 0 0 28 47 Chicken, turkey & game (e.g. pheasant) 25 28 18 0 79 48 Offal & offal dishes 0 0 0 0 0 49 Beef & veal dishes 30 44 14 0 103 50 Lamb, pork & bacon dishes 4 17 0 0 43 51 Poultry & game dishes 19 31 0 0 84 52 Burgers (beef & pork) 13 20 0 0 53 53 Sausages 10 13 6 0 35 54 Meat pies & pastries 5 16 0 0 33 55 Meat products (e.g. processed meats) 28 50 18 0 81 56 Alcoholic beverages 9 71 0 0 0 57 Sugars, syrups, preserves & sweeteners 8 12 3 0 32 58 Chocolate confectionery 21 20 15 0 65 59 Non-chocolate confectionery 11 18 4 0 45 60 Savoury snacks 13 14 8 0 43 61 Soups, sauces & miscellaneous foods 43 45 30 0 133 63 Teas 110 189 31 0 499 64 Coffees 7 33 0 0 37 65 Other beverages (e.g. water) 418 388 317 0 1196 66 Carbonated beverages 185 189 129 0 588 67 Diet carbonated beverages 21 65 0 0 133 68 Squashes, cordials & fruit juice drinks 34 66 0 0 156 Food group 62 = Nutritional supplements
  • 3. Table 3.2 Mean, SD, median and percentile values of food group intakes (g/d) in consumers only Consumers only Food group n % Mean SD Median Percentiles 5th 95th 1 Rice & pasta, flours, grains & starches 284 64 61 67 46 12 141 2 Savouries (e.g. pizzas) 337 76 62 50 50 7 160 3 White breads & rolls 422 96 66 42 61 10 144 4 Wholemeal & brown breads & rolls 210 48 41 48 27 5 128 5 Other breads (e.g. scones, croissants) 180 41 23 19 17 5 65 6 quot;Ready-to-eatquot; breakfast cereals 358 81 38 32 30 6 103 7 Other breakfast cereals (e.g. porridge) 65 15 110 106 79 10 356 8 Biscuits 304 69 17 18 12 2 50 9 Cakes, pastries & buns 213 48 25 27 17 4 73 10 Wholemilk 360 82 253 232 196 16 686 11 Low fat, skimmed & fortified milks 106 24 176 197 109 7 583 12 Other milks (e.g. processed milks) 53 12 79 61 57 23 241 13 Creams 48 11 5 4 4 1 16 14 Cheeses 272 62 18 18 12 2 54 15 Yoghurts 191 43 51 39 43 9 130 16 Icecreams 213 48 22 19 17 7 62 17 Puddings & chilled desserts 136 31 31 34 20 6 79 18 Milk puddings (e.g. rice pudding) 23 5 29 25 21 4 98 19 Eggs & egg dishes 181 41 20 16 17 7 54 20 Butter 115 26 9 12 5 1 37 21 Low fat spreads 109 25 9 10 7 1 29 22 Other spreading fats 300 68 10 11 6 1 36 23 Oils 26 6 1 1 1 0 2 24 Hard cooking fats 0 0 0 0 0 0 0 25 Potatoes (e.g. boiled, mashed, baked) 367 83 84 60 69 20 196 26 Processed & homemade potato products 108 24 27 23 19 6 74 27 Chipped, fried & roasted potatoes 409 93 67 49 57 13 160 28 Vegetable & pulse dishes 116 26 26 28 15 4 70 29 Peas, beans & lentils 241 55 29 24 21 6 86 30 Green vegetables 181 41 19 14 14 4 46 31 Carrots 226 51 19 15 13 4 48 32 Salad vegetables (e.g. lettuce) 192 44 17 17 11 2 60 33 Other vegetables (e.g. onions) 247 56 23 25 18 2 74 34 Tinned or jarred vegetables 37 8 10 7 8 2 29 35 Fruit juices 272 62 140 120 94 27 374 36 Bananas 148 34 52 52 39 10 142 37 Other fruits (e.g. apples, pears) 249 56 64 94 39 10 183 38 Citrus fruit 78 18 47 47 31 6 171 39 Tinned fruit 28 6 17 23 10 4 93
  • 4. Table 3.2 (continued) Mean, SD, median and percentile values of food group intakes (g/d) in consumers only Consumers only Food group n % Mean SD Median Percentiles 5th 95th 40 Nuts & seeds, herbs & spices 69 16 6 9 3 0 29 41 Fish & fish products 164 37 23 17 19 6 58 42 Fish dishes 14 3 48 41 32 9 135 43 Bacon & ham 290 66 19 16 13 3 57 44 Beef & veal 180 41 27 20 20 6 70 45 Lamb 68 15 22 18 17 6 56 46 Pork 104 24 21 12 17 8 48 47 Chicken, turkey & game (e.g. pheasant) 312 71 35 27 28 7 90 48 Offal & offal dishes 0 0 0 0 0 0 0 49 Beef & veal dishes 229 52 57 46 43 19 137 50 Lamb, pork & bacon dishes 46 10 43 32 38 4 90 51 Poultry & game dishes 159 36 52 31 44 16 120 52 Burgers (beef & pork) 197 45 29 20 24 10 71 53 Sausages 251 57 17 13 13 4 46 54 Meat pies & pastries 72 16 30 28 21 5 87 55 Meat products (e.g. processed meats) 337 76 37 54 24 4 84 56 Alcoholic beverages 22 5 172 278 102 0 1174 57 Sugars, syrups, preserves & sweeteners 289 66 12 14 7 1 41 58 Chocolate confectionery 369 84 25 20 18 5 68 59 Non-chocolate confectionery 293 66 17 19 11 1 58 60 Savoury snacks 331 75 17 14 13 3 46 61 Soups, sauces & miscellaneous foods 402 91 47 45 34 4 135 63 Teas 238 54 203 218 129 29 677 64 Coffees 37 8 86 79 43 21 281 65 Other beverages (e.g. water) 405 92 455 384 357 60 1222 66 Carbonated beverages 362 82 225 186 179 36 612 67 Diet carbonated beverages 78 18 121 108 75 27 341 68 Squashes, cordials & fruit juice drinks 198 45 76 80 57 6 236 Food group 62 = Nutritional supplements
  • 5. Table 3.3 Mean, SD, median and percentile values of food group intakes (g/d) for all males and by age group in the total population All males 13-17y (n =224) 13-14y (n= 95) 15-17y (n= 129) Food group Mean SD Median Percentiles Mean SD Median Percentiles Mean SD Median Percentiles 5th 95th 5th 95th 5th 95th 1 Rice & pasta , flours, grains & starches 45 76 31 0 123 44 103 31 0 113 45 48 34 0 145 2 Savouries (e.g. pizzas) 52 54 37 0 155 48 50 36 0 158 55 57 37 0 157 3 White breads & rolls 76 47 68 9 154 80 50 73 10 185 73 44 63 3 151 4 Wholemeal & brown breads & rolls 23 49 0 0 122 15 25 0 0 71 30 60 0 0 172 5 Other breads (e.g. scones, croissants) 7 13 0 0 34 6 12 0 0 34 8 14 0 0 37 6 quot;Ready-to-eatquot; breakfast cereals 40 37 34 0 121 38 38 29 0 106 42 35 38 0 123 7 Other breakfast cereals (e.g. porridge) 24 72 0 0 192 16 46 0 0 116 30 86 0 0 236 8 Biscuits 13 19 7 0 47 12 18 6 0 51 14 20 8 0 46 9 Cakes, pastries & buns 13 27 0 0 59 9 17 0 0 36 16 32 0 0 73 10 Wholemilk 266 253 210 0 738 276 259 200 0 831 259 250 221 0 699 11 Low fat, skimmed &fortified milks 48 148 0 0 379 34 97 0 0 315 58 176 0 0 489 12 Other milks (e.g. processed milks) 9 33 0 0 81 7 25 0 0 86 10 38 0 0 81 13 Creams 0 2 0 0 4 0 2 0 0 4 0 1 0 0 4 14 Cheeses 13 19 6 0 53 11 15 5 0 50 14 21 7 0 70 15 Yoghurts 24 38 0 0 100 18 33 0 0 80 28 42 0 0 109 16 Icecreams 10 19 0 0 40 9 14 0 0 34 11 22 0 0 46 17 Puddings & chilled desserts 11 26 0 0 48 12 23 0 0 60 9 27 0 0 47 18 Milk puddings (e.g. rice pudding) 2 8 0 0 10 1 7 0 0 9 2 9 0 0 27 19 Eggs & egg dishes 11 17 0 0 48 12 20 0 0 58 10 14 0 0 40 20 Butter 3 9 0 0 24 3 9 0 0 25 3 9 0 0 22 21 Low fat spreads 2 7 0 0 15 3 8 0 0 19 2 5 0 0 14 22 Other spreading fats 8 12 3 0 37 8 12 3 0 33 9 13 2 0 39 23 Oils 0 0 0 0 1 0 0 0 0 1 0 0 0 0 1 24 Hard cooking fats 0 0 0 0 0 0 0 0 0 0 0 0 0 0 0 25 Potatoes (e.g. boiled, mashed, baked) 82 71 68 0 217 88 72 77 0 218 78 70 63 0 219 26 Processed & homemade potato products 8 18 0 0 45 7 14 0 0 42 9 21 0 0 58 27 Chipped, fried & roasted potatoes 67 54 55 0 166 66 53 55 0 163 67 56 54 0 182 28 Vegetable & pulse dishes 5 15 0 0 33 2 6 0 0 15 7 19 0 0 62 29 Peas, beans & lentils 19 25 10 0 76 18 25 10 0 87 19 26 10 0 71 30 Green vegetables 8 14 0 0 34 10 15 0 0 42 8 12 0 0 34 31 Carrots 11 16 5 0 42 11 13 6 0 36 11 18 4 0 48 32 Salad vegetables (e.g. lettuce) 7 14 0 0 33 6 11 0 0 32 7 16 0 0 47 33 Other vegetables (e.g. onions) 14 25 2 0 63 15 27 0 0 68 14 24 3 0 67 34 Tinned or jarred vegetables 1 4 0 0 6 1 4 0 0 12 1 4 0 0 5 35 Fruit juices 87 124 36 0 333 83 110 43 0 304 90 133 32 0 377
  • 6. Table 3.3 (continued) Mean, SD, median and percentile values of food group intakes (g/d) for all males and by age group in the total population All males 13-17y (n =224) 13-14y (n= 95) 15-17y (n= 129) Food group Mean SD Median Percentiles Mean SD Median Percentiles Mean SD Median Percentiles 5th 95th 5th 95th 5th 95th 36 Bananas 21 47 0 0 106 16 41 0 0 100 25 51 0 0 107 37 Other fruits (e.g. apples, pears) 37 98 2 0 163 30 49 11 0 145 41 122 0 0 192 38 Citrus fruit 10 33 0 0 80 7 27 0 0 55 12 37 0 0 110 39 Tinned fruit 1 7 0 0 0 0 2 0 0 0 1 9 0 0 0 40 Nuts & seeds, herbs & spices 1 6 0 0 11 1 4 0 0 5 2 7 0 0 13 41 Fish & fish products 10 17 0 0 44 10 16 0 0 46 10 18 0 0 44 42 Fish dishes 2 12 0 0 0 3 16 0 0 0 1 9 0 0 0 43 Bacon & ham 16 18 10 0 56 15 15 10 0 46 16 19 10 0 60 44 Beef & veal 15 22 0 0 67 17 24 0 0 72 13 20 0 0 54 45 Lamb 4 11 0 0 32 5 12 0 0 38 4 10 0 0 29 46 Pork 5 11 0 0 27 4 9 0 0 21 6 12 0 0 30 47 Chicken, turkey & game (e.g. pheasant) 29 31 21 0 92 27 31 18 0 96 30 31 24 0 91 48 Offal & offal dishes 0 0 0 0 0 0 0 0 0 0 0 0 0 0 0 49 Beef & veal dishes 34 52 15 0 109 38 67 15 0 161 31 38 14 0 104 50 Lamb, pork & bacon dishes 5 19 0 0 44 6 22 0 0 44 5 16 0 0 47 51 Poultry & game dishes 20 36 0 0 91 15 30 0 0 78 25 39 0 0 116 52 Burgers (beef & pork) 14 23 0 0 64 11 18 0 0 62 17 25 0 0 73 53 Sausages 11 15 7 0 42 13 16 9 0 45 10 14 6 0 41 54 Meat pies & pastries 6 19 0 0 49 8 23 0 0 45 5 16 0 0 52 55 Meat products (e.g. processed meats) 33 46 22 0 88 28 25 21 0 85 36 57 23 0 133 56 Alcoholic beverages 12 96 0 0 0 0 0 0 0 0 22 125 0 0 137 57 Sugars, syrups, preserves & sweeteners 9 14 5 0 37 8 12 4 0 37 10 16 6 0 38 58 Chocolate confectionery 23 22 16 0 68 21 21 15 0 69 24 23 17 0 68 59 Non-chocolate confectionery 11 18 4 0 46 12 17 6 0 46 11 18 2 0 53 60 Savoury snacks 10 13 6 0 41 12 15 6 0 47 9 11 6 0 29 61 Soups, sauces & miscellaneous foods 41 43 28 0 137 38 42 27 0 133 43 43 30 0 142 63 Teas 113 209 31 0 512 90 145 31 0 420 129 244 0 0 734 64 Coffees 5 24 0 0 31 6 27 0 0 34 4 22 0 0 30 65 Other beverages (e.g. water) 426 411 323 0 1305 357 373 306 0 1156 476 431 357 0 1360 66 Carbonated beverages 207 201 165 0 615 188 161 154 0 517 222 225 183 0 660 67 Diet carbonated beverages 21 66 0 0 173 18 59 0 0 138 23 71 0 0 186 68 Squashes, cordials & fruit juice drinks 42 79 0 0 221 48 94 0 0 259 37 67 0 0 171 Food group 62 = Nutritional supplements
  • 7. Table 3.4 Mean, SD, median and percentile values of food group intakes (g/d) for all females and by age group in the total population All females 13-17y (n=217) 13-14y (n=93) 15-17y (n=124) Food group Mean SD Median Percentiles Mean SD Median Percentiles Mean SD Median Percentiles 5th 95th 5th 95th 5th 95th 1 Rice & pasta, flours, grains & starches 34 41 23 0 115 39 47 26 0 123 30 36 19 0 105 2 Savouries (e.g. pizzas) 42 47 27 0 131 43 49 25 0 171 41 45 27 0 123 3 White breads & rolls 51 34 48 0 114 53 36 49 0 117 49 33 48 0 108 4 Wholemeal & brown breads & rolls 16 25 5 0 79 9 16 0 0 44 21 28 10 0 93 5 Other breads (e.g. scones, croissants) 11 19 0 0 58 12 20 0 0 64 11 18 0 0 47 6 quot;Ready-to-eatquot; breakfast cereals 21 24 13 0 77 19 21 13 0 59 22 26 12 0 84 7 Other breakfast cereals (e.g. porridge) 8 30 0 0 77 6 22 0 0 53 10 35 0 0 90 8 Biscuits 10 13 6 0 40 9 11 7 0 34 11 14 6 0 42 9 Cakes, pastries & buns 11 16 0 0 44 11 15 4 0 44 10 17 0 0 45 10 Wholemilk 144 188 86 0 475 135 147 93 0 426 151 214 83 0 494 11 Low fat, skimmed & fortified milks 37 89 0 0 252 30 81 0 0 245 41 94 0 0 276 12 Other milks (e.g. processed milks) 10 33 0 0 72 7 25 0 0 58 11 38 0 0 83 13 Creams 1 2 0 0 4 1 2 0 0 4 1 2 0 0 5 14 Cheeses 10 14 5 0 39 11 16 3 0 48 9 12 5 0 39 15 Yoghurts 20 33 0 0 86 19 34 0 0 77 21 33 0 0 88 16 Icecreams 11 15 4 0 45 12 14 9 0 39 10 16 0 0 47 17 Puddings & chilled desserts 8 21 0 0 44 8 25 0 0 57 8 17 0 0 43 18 Milk puddings (e.g. rice pudding) 1 9 0 0 0 2 11 0 0 0 1 7 0 0 0 19 Eggs & egg dishes 6 11 0 0 34 5 8 0 0 22 7 13 0 0 43 20 Butter 2 5 0 0 10 1 5 0 0 10 2 5 0 0 11 21 Low fat spreads 2 6 0 0 12 2 7 0 0 11 2 5 0 0 14 22 Other spreading fats 6 8 3 0 20 5 6 3 0 18 6 9 2 0 23 23 Oils 0 0 0 0 0 0 0 0 0 0 0 0 0 0 0 24 Hard cooking fats 0 0 0 0 0 0 0 0 0 0 0 0 0 0 0 25 Potatoes (e.g. boiled, mashed, baked) 58 52 49 0 157 51 52 37 0 161 63 52 55 0 157 26 Processed & homemade potato products 5 14 0 0 32 6 16 0 0 46 5 13 0 0 27 27 Chipped, fried & roasted potatoes 58 45 49 0 151 60 42 55 0 145 56 47 46 0 158 28 Vegetable & pulse dishes 9 21 0 0 56 8 25 0 0 61 9 17 0 0 50 29 Peas, beans & lentils 12 19 4 0 50 14 21 5 0 71 11 17 4 0 39 30 Green vegetables 7 11 0 0 30 8 13 0 0 38 6 10 0 0 28 31 Carrots 8 12 0 0 37 8 13 0 0 35 8 12 3 0 37 32 Salad vegetables (e.g. lettuce) 8 14 0 0 43 6 10 0 0 30 10 17 2 0 51 33 Other vegetables (e.g. onions) 12 18 4 0 49 9 13 2 0 35 14 20 6 0 58 34 Tinned or jarred vegetables 1 3 0 0 8 1 4 0 0 11 1 2 0 0 5
  • 8. Table 3.4 (continued) Mean, SD, median and percentile values of food group intakes (g/d) for all females and by age group in the total population All females 13-17y (n=217) 13-14y (n=93) 15-17y (n=124) Food group Mean SD Median Percentiles Mean SD Median Percentiles Mean SD Median Percentiles 5th 95th 5th 95th 5th 95th 35 Fruit juices 85 108 57 0 289 85 108 57 0 324 86 108 57 0 286 36 Bananas 14 28 0 0 77 10 21 0 0 66 17 32 0 0 86 37 Other fruits (e.g. apples, pears) 36 49 17 0 145 30 45 17 0 123 40 52 19 0 149 38 Citrus fruit 7 17 0 0 42 6 17 0 0 39 7 18 0 0 46 39 Tinned fruit 1 7 0 0 11 2 10 0 0 9 1 4 0 0 11 40 Nuts & seeds, herbs & spices 1 2 0 0 5 1 2 0 0 6 0 2 0 0 4 41 Fish & fish products 7 13 0 0 36 6 11 0 0 36 8 14 0 0 39 42 Fish dishes 1 9 0 0 0 1 13 0 0 0 1 5 0 0 6 43 Bacon & ham 10 14 6 0 36 10 13 6 0 35 10 15 6 0 40 44 Beef & veal 7 12 0 0 35 9 14 0 0 43 6 10 0 0 29 45 Lamb 3 10 0 0 18 2 5 0 0 15 3 13 0 0 28 46 Pork 4 10 0 0 28 4 9 0 0 29 5 11 0 0 29 47 Chicken, turkey & game (e.g. pheasant) 21 24 16 0 65 18 22 12 0 57 23 25 17 0 72 48 Offal & offal dishes 0 0 0 0 0 0 0 0 0 0 0 0 0 0 0 49 Beef & veal dishes 25 33 14 0 92 24 30 18 0 81 26 35 14 0 101 50 Lamb, pork & bacon dishes 3 14 0 0 36 3 12 0 0 22 4 16 0 0 36 51 Poultry & game dishes 17 26 0 0 69 20 28 0 0 82 14 23 0 0 61 52 Burgers (beef & pork) 12 17 0 0 44 14 16 12 0 45 10 17 0 0 46 53 Sausages 8 11 5 0 28 8 11 5 0 27 8 11 5 0 29 54 Meat pies & pastries 4 11 0 0 25 5 13 0 0 28 3 9 0 0 20 55 Meat products (e.g. processed meats) 23 52 14 0 70 18 21 14 0 70 27 67 15 0 71 56 Alcoholic beverages 5 31 0 0 1 1 10 0 0 0 7 39 0 0 24 57 Sugars, syrups, preserves & sweeteners 6 10 2 0 25 5 7 1 0 19 7 12 2 0 35 58 Chocolate confectionery 19 19 13 0 60 19 17 14 0 60 19 20 12 0 65 59 Non-chocolate confectionery 11 18 4 0 44 14 19 6 0 47 9 17 3 0 44 60 Savoury snacks 15 14 11 0 45 16 13 13 0 46 15 15 10 0 46 61 Soups, sauces & miscellaneous foods 45 47 30 0 127 47 57 28 0 132 44 38 37 1 122 63 Teas 106 167 31 0 497 86 129 29 0 343 122 190 36 0 539 64 Coffees 10 40 0 0 53 7 28 0 0 50 12 47 0 0 72 65 Other beverages (e.g. water) 410 364 310 0 1120 354 259 303 0 825 452 423 319 51 1327 66 Carbonated beverages 161 173 106 0 536 176 168 126 0 557 150 177 88 0 527 67 Diet carbonated beverages 22 63 0 0 121 21 60 0 0 144 23 66 0 0 136 68 Squashes, cordials & fruit juice drinks 26 46 0 0 143 31 45 6 0 125 23 47 0 0 146 Food group 62 = Nutritional supplements
  • 9. Table 3.5 Mean, SD, median and percentile values of food group intakes (g/d) for all males and by age group in consumers only Male consumers only 13-17y 13-14 y 15-17 y Food group n % Mean SD Median Percentiles n % Mean SD Median Percentiles n % Mean SD Median Percentiles 5th 95th 5th 95th 5th 95th 1 Rice & pasta, flours, grains & starches 143 64 70 85 53 15 147 57 60 74 125 47 19 133 86 67 67 44 60 15 148 2 Savouries (e.g. pizzas) 172 77 68 53 57 7 167 69 73 67 48 59 7 178 103 80 69 56 55 7 164 3 White breads & rolls 217 97 78 69 46 18 155 94 99 81 50 74 14 186 123 95 76 42 65 20 151 4 Wholemeal & brown breads & rolls 96 43 55 63 39 6 208 39 41 35 29 27 5 86 57 44 68 75 43 7 264 5 Other breads (e.g. scones, croissants) 77 34 21 15 20 5 51 30 32 20 13 17 3 44 47 36 22 16 21 5 61 6 quot;Ready to eatquot; breakfast cereals 195 87 46 36 39 6 123 81 85 44 38 37 6 121 114 88 48 34 39 7 125 7 Other breakfast cereals (e.g. porridge) 38 17 141 121 92 11 384 17 18 88 76 65 6 241 21 16 183 134 153 36 528 8 Biscuits 150 67 20 21 14 2 61 65 68 18 19 10 2 66 85 66 21 22 16 3 63 9 Cakes, pastries & buns 107 48 28 33 16 4 94 43 45 21 20 15 4 81 64 50 33 39 18 6 119 10 Wholemilk 192 86 311 247 245 43 831 82 86 319 252 229 27 832 110 85 304 245 253 59 791 11 Low fat, skimmed & fortified milks 44 20 244 253 168 10 737 17 18 190 156 160 7 557 27 21 279 297 199 11 1029 12 Other milks (e.g. processed milks) 25 11 82 64 71 24 279 9 9 78 37 86 31 143 16 12 84 76 60 21 307 13 Creams 18 8 5 4 4 1 18 6 6 7 6 5 1 18 12 9 4 2 4 2 9 14 Cheeses 143 64 20 20 14 2 72 58 61 18 16 13 2 54 85 66 22 23 14 2 76 15 Yoghurts 96 43 55 41 47 13 137 37 39 47 38 37 7 168 59 46 61 42 54 14 132 16 Icecreams 103 46 22 23 14 7 72 45 47 19 15 13 7 60 58 45 24 27 14 7 82 17 Puddings & chilled desserts 70 31 34 37 25 8 71 34 36 33 29 26 4 99 36 28 34 43 21 8 95 18 Milk puddings (e.g. rice pudding) 15 7 26 19 25 3 64 6 6 18 23 10 3 64 9 7 31 16 29 7 64 19 Eggs & egg dishes 109 49 22 18 17 7 59 46 48 25 22 17 7 84 63 49 20 14 17 6 51 20 Butter 61 27 11 13 5 1 44 27 28 12 13 7 1 43 34 26 11 14 4 1 47 21 Low fat spreads 54 24 10 10 7 2 32 24 25 12 13 9 2 52 30 23 8 7 6 1 26 22 Other spreading fats 154 69 12 13 7 1 39 65 68 12 13 6 1 37 89 69 13 14 8 1 46 23 Oils 19 8 1 1 1 0 3 10 11 1 1 1 0 3 9 7 1 0 1 0 1 24 Hard cooking fats 0 0 0 0 0 0 0 0 0 0 0 0 0 0 0 0 0 0 0 0 0 25 Potatoes (e.g. boiled, mashed, baked) 190 85 97 67 81 20 228 82 86 102 67 87 24 242 108 84 93 66 75 20 229 26 Processed & homemade potato products 58 26 30 25 24 6 67 25 26 26 15 19 4 55 33 26 33 30 26 5 115 27 Chipped, fried & roasted potatoes 209 93 71 53 58 12 174 88 93 71 51 60 13 165 121 94 72 55 58 9 183 28 Vegetable & pulse dishes 50 22 24 25 15 3 72 18 19 12 8 10 4 36 32 25 30 29 17 3 93 29 Peas, beans & lentils 129 58 33 26 29 6 91 55 58 32 26 28 6 100 74 57 34 25 29 7 86 30 Green vegetables 96 43 20 15 16 5 52 42 44 22 16 17 5 59 54 42 18 14 14 5 41 31 Carrots 119 53 21 17 15 4 50 51 54 20 12 16 4 43 68 53 21 19 13 4 71 32 Salad vegetables (e.g. lettuce) 84 38 17 18 11 2 61 34 36 17 14 16 1 46 50 39 18 21 8 2 65 33 Other vegetables (e.g. onions) 119 53 27 29 20 2 90 46 48 31 32 23 1 97 73 57 24 27 18 2 81 34 Tinned or jarred vegetables 17 8 11 8 7 1 29 7 7 12 7 12 3 22 10 8 9 10 6 1 29
  • 10. Table 3.5 (continued) Mean, SD, median and percentile values of food group intakes (g/d) for all males and by age group in consumers only Male consumers only 13-17y 13-14 y 15-17 y Food group n % Mean SD Median Percentiles n % Mean SD Median Percentiles n % Mean SD Median Percentiles 5th 95th 5th 95th 5th 95th 35 Fruit juices 129 58 151 130 115 29 443 56 59 140 112 104 7 359 73 57 160 143 120 29 501 36 Bananas 77 34 60 64 42 10 186 27 28 55 63 31 6 227 50 39 63 65 49 10 142 37 Other fruits (e.g. apples, pears) 113 50 73 128 41 9 225 53 56 54 55 33 7 167 60 47 89 167 45 9 259 38 Citrus fruit 35 16 63 62 40 6 190 15 16 46 55 18 6 212 20 16 75 65 59 6 184 39 Tinned fruit 7 3 22 33 6 4 96 2 2 11 9 11 5 17 5 4 27 40 6 4 96 40 Nuts & seeds, herbs & spices 31 14 10 12 5 0 41 11 12 7 10 3 0 29 20 16 12 13 6 0 45 41 Fish & fish products 87 39 26 20 19 6 67 41 43 24 17 18 7 67 46 36 27 22 19 6 74 42 Fish dishes 7 3 60 38 49 26 135 3 3 81 49 69 38 135 4 3 45 23 39 26 75 43 Bacon & ham 159 71 22 17 17 4 60 71 75 19 15 15 4 51 88 68 24 19 18 3 62 44 Beef & veal 105 47 32 22 25 7 82 47 49 34 24 25 7 88 58 45 30 20 24 6 77 45 Lamb 105 47 4 11 0 0 33 47 49 5 12 0 0 40 58 45 4 10 0 0 35 46 Pork 141 63 52 41 39 11 125 21 22 19 10 17 7 54 36 28 22 12 18 9 52 47 Chicken, turkey & game (e.g. pheasant) 166 74 39 30 30 9 96 71 75 36 31 24 8 106 95 74 41 29 34 9 94 48 Offal & offal dishes 0 0 0 0 0 0 0 0 0 0 0 0 0 0 0 0 0 0 0 0 0 49 Beef & veal dishes 117 52 66 56 50 15 158 49 52 74 78 43 17 259 68 53 59 32 50 14 125 50 Lamb, pork & bacon dishes 28 13 43 35 37 8 137 14 15 43 43 31 10 177 14 11 44 26 44 6 89 51 Poultry & game dishes 75 33 61 36 58 15 131 26 27 55 35 48 15 153 49 38 65 36 61 14 142 52 Burgers (beef & pork) 99 44 33 24 26 10 79 37 39 28 18 24 7 70 62 48 35 26 28 10 101 53 Sausages 131 58 19 15 14 4 54 59 62 21 15 17 6 54 72 56 18 15 13 4 55 54 Meat pies & pastries 35 16 39 34 29 6 120 18 19 40 39 25 12 180 17 13 38 29 29 6 105 55 Meat products (e.g. processed meats) 178 79 41 49 29 6 95 80 84 33 24 26 3 86 98 76 48 61 31 6 152 56 Alcoholic beverages 10 4 278 380 190 47 1331 0 0 0 0 0 0 0 10 8 278 380 190 47 1331 57 Sugars, syrups, preserves & sweeteners 149 67 14 15 9 1 47 64 67 12 12 8 1 45 85 66 16 17 11 1 58 58 Chocolate confectionery 186 83 27 21 21 6 70 81 85 25 21 20 5 70 105 81 29 22 22 6 70 59 Non-chocolate confectionery 134 60 19 19 14 1 60 60 63 18 19 14 1 58 74 57 20 20 14 1 66 60 Savoury snacks 147 66 15 13 11 3 45 66 69 17 15 11 3 50 81 63 14 11 11 3 41 61 Soups, sauces & miscellaneous foods 199 89 46 43 33 3 140 83 87 43 43 32 3 138 116 90 48 43 35 3 148 63 Teas 119 53 212 247 115 29 761 56 59 153 162 99 27 502 63 49 265 295 154 31 854 64 Coffees 15 7 74 63 37 11 195 8 8 74 66 35 11 170 7 5 75 64 37 30 195 65 Other beverages (e.g. water) 199 89 479 405 359 46 1359 83 87 409 372 328 63 1188 116 90 529 422 381 43 1382 66 Carbonated beverages 187 83 248 195 200 43 626 82 86 218 154 184 36 550 105 81 272 220 214 47 723 67 Diet carbonated beverages 35 16 134 114 86 23 361 14 15 123 107 83 23 332 21 16 141 121 86 24 464 68 Squashes, cordials & fruit juice drinks 103 46 90 97 62 7 317 47 49 97 115 45 7 424 56 43 85 79 69 6 297 Food group 62 = Nutritional supplements
  • 11. Table 3.6 Mean, SD, median and percentile values of food group intakes (g/d) for all females and by age group in consumers only Female consumers only 13-17 y 13-14 y 15-17 y Food group n % Mean SD Median Percentiles n % Mean SD Median Percentiles n % Mean SD Median Percentiles 5th 95th 5th 95th 5th 95th 1 Rice & pasta, flours, grains & starches 141 65 52 41 39 11 125 67 72 55 47 41 11 136 74 60 50 34 39 8 125 2 Savouries (e.g. pizzas) 165 76 55 46 45 9 145 68 73 58 49 41 5 178 97 78 53 45 46 9 126 3 White breads & rolls 205 94 54 50 33 8 115 87 94 57 34 55 9 118 118 95 52 32 49 8 108 4 Wholemeal & brown breads & rolls 114 53 30 27 22 5 97 39 42 22 19 14 5 75 75 60 35 29 27 5 102 5 Other breads (e.g. scones, croissants) 103 47 24 22 16 6 68 42 45 27 23 19 6 88 61 49 21 20 14 5 66 6 quot;Ready to eatquot; breakfast cereals 163 75 28 24 20 5 84 69 74 26 20 21 6 65 94 76 29 26 20 4 85 7 Other breakfast cereals (e.g. porridge) 27 12 67 58 42 7 188 10 11 54 46 42 6 134 17 14 74 65 42 11 207 8 Biscuits 154 71 15 14 10 2 46 67 72 13 11 11 1 43 87 70 16 15 9 2 48 9 Cakes, pastries & buns 106 49 22 18 17 4 61 52 56 20 16 15 4 61 54 44 23 19 17 4 63 10 Wholemilk 168 77 186 195 140 9 522 74 80 169 146 137 13 497 94 76 199 226 143 8 540 11 Low fat, skimmed & fortified milks 62 29 128 126 91 7 439 22 24 129 125 102 5 483 40 32 128 128 69 7 441 12 Other milks (e.g. processed milks) 28 13 76 59 52 19 234 10 11 69 39 54 34 147 18 15 79 69 51 14 304 13 Creams 30 14 5 4 4 1 15 10 11 6 5 4 1 17 20 16 5 4 3 1 14 14 Cheeses 129 59 17 14 12 2 48 51 55 20 17 14 2 67 78 63 15 12 10 2 43 15 Yoghurts 95 44 46 36 39 9 129 37 40 47 39 43 8 153 58 47 46 34 36 8 128 16 Icecreams 110 51 21 15 18 7 56 55 59 20 12 18 7 52 55 44 22 18 18 5 65 17 Puddings & chilled desserts 66 30 27 30 16 4 95 23 25 33 41 19 4 164 43 35 24 22 16 3 81 18 Milk puddings (e.g. rice pudding) 8 4 35 34 21 7 106 3 3 48 50 21 17 106 5 4 27 23 21 7 66 19 Eggs & egg dishes 72 33 18 13 17 7 44 32 34 14 8 9 6 34 40 32 21 14 17 7 51 20 Butter 54 25 7 9 3 1 29 18 19 7 11 3 1 47 36 29 7 8 4 1 28 21 Low fat spreads 55 25 9 9 7 1 24 22 24 9 13 4 2 54 33 27 9 6 9 1 22 22 Other spreading fats 146 67 8 8 5 1 23 66 71 7 6 5 1 19 80 65 9 10 5 1 26 23 Oils 7 3 1 0 1 0 2 4 4 1 0 1 0 1 3 2 1 1 1 0 2 24 Hard cooking fats 0 0 0 0 0 0 0 0 0 0 0 0 0 0 0 0 0 0 0 0 0 25 Potatoes (e.g. boiled, mashed, baked) 177 82 71 49 57 17 162 70 75 68 50 52 14 174 107 86 73 49 62 20 160 26 Processed & homemade potato products 50 23 24 21 16 6 76 20 22 26 26 16 5 101 30 24 22 18 16 6 75 27 Chipped, fried & roasted potatoes 200 92 63 43 55 14 153 86 92 65 40 57 14 148 114 92 61 46 52 11 163 28 Vegetable & pulse dishes 66 30 28 29 16 5 85 18 19 40 43 22 3 173 48 39 24 21 16 6 63 29 Peas, beans & lentils 112 52 24 20 18 5 79 49 53 26 23 19 5 89 63 51 22 17 17 4 56 30 Green vegetables 85 39 17 12 14 4 44 38 41 19 15 13 4 58 47 38 16 9 14 4 36 31 Carrots 107 49 17 13 13 5 41 44 47 17 14 12 5 54 63 51 17 12 13 3 41 32 Salad vegetables (e.g. lettuce) 108 50 17 17 11 2 53 38 41 14 11 11 2 32 70 56 18 19 11 1 61 33 Other vegetables (e.g. onions) 128 59 20 19 15 2 65 50 54 17 14 13 0 44 78 63 22 21 16 3 72 34 Tinned or jarred vegetables 20 9 9 7 8 3 29 9 10 12 8 10 4 29 11 9 7 5 6 3 16
  • 12. Table 3.6 (continued) Mean, SD, median and percentile values of food group intakes (g/d) for all females and by age group in consumers only Female consumers only 13-17 y 13-14 y 15-17 y Food group n % Mean SD Median Percentiles n % Mean SD Median Percentiles n % Mean SD Median Percentiles 5th 95th 5th 95th 5th 95th 35 Fruit juices 143 66 130 109 91 23 341 64 69 124 111 88 20 350 79 64 134 109 91 29 343 36 Bananas 71 33 43 33 30 12 107 26 28 36 25 23 14 91 45 36 46 37 35 10 146 37 Other fruits (e.g. apples, pears) 136 63 57 52 38 11 161 56 60 49 48 32 9 149 80 65 62 53 45 12 177 38 Citrus fruit 43 20 34 25 30 7 94 15 16 38 24 33 8 88 28 23 32 26 26 6 101 39 Tinned fruit 21 10 15 18 11 4 84 10 11 18 26 7 4 89 11 9 12 6 11 5 23 40 Nuts & seeds, herbs & spices 38 18 3 4 2 0 12 17 18 4 4 2 0 15 21 17 3 3 2 0 12 41 Fish & fish products 77 35 21 14 16 4 44 26 28 22 11 21 4 41 51 41 20 15 16 5 56 42 Fish dishes 7 3 35 42 20 9 128 1 1 128 0 128 128 128 6 5 19 9 17 9 33 43 Bacon & ham 131 60 16 15 12 3 51 55 59 17 13 13 3 51 76 61 16 16 11 3 52 44 Beef & veal 75 35 20 13 16 6 49 35 38 23 15 16 5 59 40 32 18 10 16 7 38 45 Lamb 75 35 3 14 0 0 20 35 38 1 4 0 0 15 40 32 5 19 0 0 32 46 Pork 47 22 20 12 17 5 47 20 22 19 12 14 4 44 27 22 22 13 17 5 54 47 Chicken, turkey & game (e.g. pheasant) 146 67 31 23 26 7 75 56 60 30 20 27 6 70 90 73 32 25 25 7 77 48 Offal & offal dishes 0 0 0 0 0 0 0 0 0 0 0 0 0 0 0 0 0 0 0 0 0 49 Beef & veal dishes 112 52 49 31 40 19 112 47 51 48 24 40 22 98 65 52 50 35 40 14 129 50 Lamb, pork & bacon dishes 18 8 41 29 40 4 91 7 8 34 28 43 4 81 11 9 46 30 36 4 91 51 Poultry & game dishes 84 39 43 23 37 16 94 40 43 47 24 43 17 97 44 35 41 22 31 14 86 52 Burgers (beef & pork) 98 45 26 16 23 8 53 51 55 25 14 22 8 52 47 38 26 17 24 7 55 53 Sausages 120 55 14 11 10 4 32 53 57 13 11 9 3 34 67 54 15 11 11 4 39 54 Meat pies & pastries 37 17 22 19 16 3 65 17 18 26 21 20 6 90 20 16 18 16 15 3 61 55 Meat products (e.g. processed meats) 159 73 32 59 21 4 74 66 71 26 20 20 4 78 93 75 36 75 21 4 73 56 Alcoholic beverages 12 6 84 106 30 0 286 1 1 93 0 93 93 93 11 9 83 111 29 0 286 57 Sugars, syrups, preserves & sweeteners 140 65 9 11 5 1 29 59 63 7 7 5 1 25 81 65 10 13 5 1 44 58 Chocolate confectionery 183 84 22 18 16 3 64 85 91 21 17 15 3 61 98 79 24 20 17 3 69 59 Non-chocolate confectionery 159 73 15 19 8 0 56 74 80 17 19 10 0 54 85 69 13 19 6 0 59 60 Savoury snacks 184 85 18 14 14 3 50 85 91 17 13 14 4 49 99 80 19 15 15 2 51 61 Soups, sauces & miscellaneous foods 203 94 49 47 37 4 129 84 90 52 58 30 3 136 119 96 46 38 39 4 123 63 Teas 119 55 194 185 138 28 553 51 55 157 139 132 21 457 68 55 222 209 152 30 637 64 Coffees 22 10 94 89 48 23 321 8 9 78 64 54 29 218 14 11 104 101 47 23 329 65 Other beverages (e.g. water) 206 95 432 361 323 64 1138 86 92 383 247 320 48 832 120 97 467 422 345 65 1331 66 Carbonated beverages 175 81 200 172 143 31 592 82 88 200 165 145 31 583 93 75 201 178 140 31 629 67 Diet carbonated beverages 43 20 111 102 71 27 354 17 18 114 96 71 14 357 26 21 108 108 77 27 453 68 Squashes, cordials & fruit juice drinks 95 44 60 53 49 6 201 50 54 57 48 51 5 164 45 36 64 59 49 6 208 Food group 62 = Nutritional supplements