SlideShare ist ein Scribd-Unternehmen logo
1 von 11
Downloaden Sie, um offline zu lesen
Table 6.1 Number of eating occasions at home, at other people’s home, outside
the home and at various locations outside the home for Irish boys and girls,
aged 5-12 years for the total population and consumers only
                                        Total            Consumers
                                     Population             Only
                                     Mean SD          n % Cons Mean       SD
Total       Home                     29.6 7.0        594 100.0 29.6       7.0
(n = 594)   Other people's home       1.8 2.5        349 58.8    3.1      2.7
            Outside the home          1.9 1.9        459 77.3    2.5      1.8

                    Takeaway          0.7    0.9     288   48.5     1.4   0.7
                    Restaurant        0.3    0.6     157   26.4     1.3   0.6
                    Shop              0.6    1.1     182   30.6     1.9   1.3
                    Other             0.3    0.8     136   22.9     1.5   1.2

Boys        Home                      30.2   7.4     293   100.0   30.2 7.4
(n = 293)   Other people's home        1.6   2.5     161    54.9    3.0 2.7
            Outside the home           1.8   1.9     213    72.7    2.4 1.8

                    Takeaway          0.6    0.8     135   46.1     1.4   0.7
                    Restaurant        0.3    0.6      70   23.9     1.3   0.6
                    Shop              0.6    1.1      91   31.1     1.8   1.3
                    Other             0.3    0.8      53   18.1     1.4   1.2

Girls       Home                      29.0   6.6     301   50.7    29.0 6.6
(n = 301)   Other people's home        2.0   2.5     188   31.6     3.1 2.6
            Outside the home           2.1   2.0     246   41.4     2.6 1.9

                    Takeaway          0.7    0.9     153   25.8     1.4   0.8
                    Restaurant        0.4    0.7      87   14.6     1.3   0.6
                    Shop              0.6    1.2      91   15.3     1.9   1.4
                    Other             0.4    0.9      83   14.0     1.6   1.1
Table 6.2 Number of eating occasions at home, at other people’s home, outside the
home and at various locations outside the home for Irish boys and girls by age group
                                          5-8 years                  9 to 12 years
                                  n     % Cons Mean SD         n     % Cons Mean SD

Total    Home                     296 100.0      29.9 6.8      298 100.0      29.3 7.2
         Other people's home      191 64.5       3.2 2.7       158 53.0       2.9 2.6
         Outside the home         219 74.0       2.3 1.6       240 80.5       2.7 2.0

                  Takeaway        144    48.6     1.3   0.5    144    48.3    1.5      0.9
                  Restaurant       72    24.3     1.3   0.5     85    28.5    1.3      0.6
                  Shop             84    28.4     1.8   1.4     98    32.9    1.9      1.3
                  Other            64    21.6     1.3   0.8     72    24.2    1.6      1.4

Boys     Home                     145 100.0      29.9 7.3      148 100.0      30.6 7.5
         Other people's home      93 64.1        3.3 2.9        68 45.9        2.5 2.5
         Outside the home         98 67.6        2.2 1.5       115 77.7       2.7 2.0

                  Takeaway         69    47.6     1.3   0.5     66    44.6    1.5      0.8
                  Restaurant       31    21.4     1.1   0.3     39    26.4    1.4      0.7
                  Shop             33    22.8     1.8   1.3     58    39.2    1.9      1.3
                  Other            27    18.6     1.3   0.7     26    17.6    1.5      1.7

Girls    Home                     151 100.0      29.9 6.3      150 100.0      28.1 6.8
         Other people's home      98 64.9        3.1 2.5        90 60.0        3.2 2.7
         Outside the home         121 80.1       2.4 1.7       125 83.3       2.7 2.1

                  Takeaway         75    49.7     1.2   0.5     78    52.0    1.6      0.9
                  Restaurant       41    27.2     1.4   0.6     46    30.7    1.2      0.5
                  Shop             51    33.8     1.8   1.4     40    26.7    2.0      1.4
                  Other            37    24.5     1.4   0.9     46    30.7    1.7      1.2
Table 6.3 Number of eating occasions at home, at other people’s home, outside the home and at various locations
outside the home for Irish boys and girls by parental education level
                                      Intermediate only           Leaving cert                Degree/diploma
                                   n % Cons Mean SD            n % Cons Mean        SD      n % Cons Mean         SD
Total   Home                      109 100.0 28.5 6.9          229 100.0 29.2        6.9    251 100.0 30.5         7.1
        Other people's home        49     45.0    2.4 2.0     134 58.5     3.6      3.0    164 65.3      2.8      2.4
        Outside the home           75     68.8    2.4 2.1     179 78.2     2.6      1.9    201 80.1      2.4      1.7

                Takeaway          51     46.8    1.6   0.8    119    52.0     1.4   0.8    115    45.8    1.3     0.5
                Restaurant        23     21.1    1.3   0.6    58     25.3     1.2   0.5     75    29.9    1.3     0.6
                Shop              29     26.6    2.0   1.3    66     28.8     2.0   1.5     84    33.5    1.7     1.2
                Other             12     11.0    1.3   0.5    60     26.2     1.5   1.3     64    25.5    1.6     1.1

Boys    Home                      60    100.0    29.1 7.2     113   100.0    29.4 7.3      119   100.0    31.6 7.5
        Other people's home       25     41.7    1.8 1.6      58    51.3     4.0 3.3       77     64.7    2.6 2.3
        Outside the home          36    60.0     2.2 2.1      82    72.6     2.8 1.9       95    79.8     2.3 1.4

                Takeaway          26     43.3    1.4   0.6     55    48.7     1.5   0.8     54    45.4    1.3     0.6
                Restaurant        5      8.3     1.8   1.1     27    23.9     1.3   0.7     38    31.9    1.2     0.4
                Shop              14     23.3    2.1   1.6     37    32.7     1.9   1.4     40    33.6    1.7     1.1
                Other             4      6.7     1.3   0.5     23    20.4     1.6   1.8     26    21.8    1.3     0.7

Girls   Home                      49    100.0    27.7 6.6     116   100.0    29.0 6.6      132   100.0    29.5 6.5
        Other people's home       24     49.0    3.0 2.2      76    65.5     3.3 2.8        87    65.9    3.0 2.5
        Outside the home          39    79.6     2.6 2.0      97    83.6     2.5 1.8       106   80.3     2.6 2.0

                Takeaway          25     51.0    1.8   1.0     64    55.2     1.4   0.9     61    46.2    1.3     0.5
                Restaurant        18     36.7    1.2   0.4     31    26.7     1.1   0.3     37    28.0    1.4     0.8
                Shop              15     30.6    1.8   0.9     29    25.0     2.1   1.7     44    33.3    1.8     1.3
                Other             8      16.3    1.3   0.5     37    31.9     1.4   0.9     38    28.8    1.7     1.3
Table 6.4 Number of eating occasions at home, at other people’s home, outside the home and at various locations outside the home for Irish boys
and girls by social class
                                      Professional             Non-manual occupations            Skilled manual          Semi-skilled/unskilled
                                  n % Cons Mean          SD    n % Cons Mean SD             n    % Cons Mean SD         n % Cons Mean SD
Total    Home                     307  100.0 29.9        7.2   117   100.0 29.4 6.3         93     100.0 29.0 6.8       74    100.0 29.5 7.9
         Other people's home      192   62.5    3.0      2.6    75    64.1    3.4 2.7       46      49.5    3.2 3.1     34     45.9     2.6 2.0
         Outside the home         242   78.8    2.5      1.7    95    81.2    2.5 1.9       63      67.7    2.6 2.1     58     78.4     2.6 2.0

                  Takeaway         142     46.3    1.3   0.5     58     49.6    1.6   1.1   47      50.5    1.5   0.7   40     54.1    1.5   0.6
                  Restaurant        96     31.3    1.3   0.6     23     19.7    1.2   0.5   21      22.6    1.2   0.5   17     23.0    1.1   0.3
                  Shop              95     30.9    1.8   1.2     39     33.3    1.6   1.0   23      24.7    2.2   1.8   25     33.8    2.4   1.8
                  Other             75     24.4    1.6   1.4     38     32.5    1.4   0.9   12      12.9    1.3   0.6   11     14.9    1.2   0.4

Boys     Home                      144    100.0   30.8 7.5       59    100.0   29.8 6.7     51     100.0   28.5 6.8     38    100.0   31.1 8.5
         Other people's home        88     61.1    3.1 2.9       33     55.9    3.4 2.9     21      41.2    3.0 2.9     18     47.4    1.6 1.2
         Outside the home          111     77.1    2.5 1.6       44     74.6    2.3 1.8     30      58.8    2.7 2.5     28     73.7    2.3 1.6

                  Takeaway          66     45.8    1.2   0.4     22     37.3    1.6   1.0   25      49.0    1.6   0.8   22     57.9    1.4   0.6
                  Restaurant        48     33.3    1.3   0.6      9     15.3    1.3   0.7    8      15.7    1.4   0.7    5     13.2    1.4   0.5
                  Shop              50     34.7    1.8   1.1     21     35.6    1.6   1.1    9      17.6    3.0   2.4   11     28.9    1.7   1.0
                  Other             29     20.1    1.6   1.6     16     27.1    1.3   0.8    3       5.9    1.0   0.0    5     13.2    1.2   0.4

Girls    Home                      163    100.0   29.1 6.8       58    100.0   28.9 5.8     42     100.0   29.6 6.8     36    100.0   27.8 6.8
         Other people's home       104     63.8    2.9 2.4       42     72.4    3.4 2.6     25      59.5    3.3 3.4     16     44.4    3.6 2.3
         Outside the home          131     80.4    2.5 1.9       51     87.9    2.6 1.9     33      78.6    2.5 1.5     30     83.3    2.9 2.3

                  Takeaway          76     46.6    1.3   0.6     36     62.1    1.5   1.1   22      52.4    1.5   0.7   18     50.0    1.5   0.7
                  Restaurant        48     29.4    1.4   0.7     14     24.1    1.1   0.4   13      31.0    1.2   0.4   12     33.3    1.0   0.0
                  Shop              45     27.6    1.8   1.3     18     31.0    1.6   1.0   14      33.3    1.7   1.1   14     38.9    2.9   2.1
                  Other             46     28.2    1.7   1.3     22     37.9    1.5   1.0    9      21.4    1.3   0.7    6     16.7    1.2   0.4
Table 6.5 Number of eating occasions at home, at other people’s home, outside the home and at various locations outside the home for Irish
boys and girls by location of residence
                                    Open Country                    Small town              Large town                      City
                                 n % Cons Mean        SD     n    % Cons Mean     SD     n % Cons Mean        SD      n % Cons Mean          SD
Total   Home                    242 100.0 29.3        6.7    88    100.0 28.8     7.5    93 100.0 29.1        7.9    171 100.0 30.7          6.6
        Other people's home     131 54.1    3.5       3.1    64     72.7    3.0   2.5    43 46.2    2.9       2.5    111 64.9    2.6         2.2
        Outside the home        175 72.3    2.4       1.8    77     87.5    3.2   2.4    74 79.6    2.1       1.4    133 77.8    2.6         1.6

                   Takeaway      93    38.4     1.3   0.6    53    60.2    1.5    0.9    53    57.0     1.3   0.6     89    52.0     1.4     0.8
                   Restaurant    62    25.6     1.2   0.6    27    30.7    1.4    0.8    21    22.6     1.1   0.4     47    27.5     1.3     0.5
                   Shop          68    28.1     1.8   1.1    41    46.6    2.3    2.0    24    25.8     1.5   0.8     49    28.7     1.8     1.1
                   Other         55    22.7     1.6   1.4    22    25.0    1.4    1.0    16    17.2     1.4   0.8     43    25.1     1.5     1.0
                                                                                                                            0.0
Boys    Home                    133 100.0      29.8 6.8      24   100.0    27.9 8.4      60    100.0   30.3 8.0       76    44.4    31.5 7.5
        Other people's home      72 54.1        3.3 3.0      16   66.7     3.8 3.9       29    48.3    3.1 2.7        44    25.7     2.0 1.4
        Outside the home         91 68.4        2.4 1.7      21   87.5     3.7 2.7       47    78.3    2.2 1.5        54    31.6     2.2 1.5

                   Takeaway      47    35.3     1.4   0.6    13    54.2    1.5    0.5    37    61.7     1.2   0.5     38    22.2     1.5     0.9
                   Restaurant    28    21.1     1.3   0.5    11    45.8    1.6    1.0    13    21.7     1.2   0.4     18    10.5     1.1     0.3
                   Shop          46    34.6     1.8   1.1    14    58.3    2.6    2.2    16    26.7     1.7   0.9     15     8.8     1.4     0.8
                   Other         23    17.3     1.4   1.7     4    16.7    1.0    0.0     9    15.0     1.8   1.0     17     9.9     1.3     0.8
                                                                                                                            0.0
Girls   Home                    109 100.0      28.6 6.6      64   100.0    29.1 7.2      33    100.0   27.0 7.2       95    55.6    30.1 5.8
        Other people's home      59 54.1        3.8 3.2      48   75.0     2.8 1.7       14    42.4    2.4 1.9        67    39.2     2.9 2.5
        Outside the home         84 77.1        2.3 1.9      56   87.5     3.0 2.3       27    81.8    1.8 1.2        79    46.2     2.8 1.7

                   Takeaway      46    42.2     1.3   0.6    40    62.5    1.6    1.0    16    48.5     1.5   0.8     51    29.8     1.4     0.6
                   Restaurant    34    31.2     1.2   0.6    16    25.0    1.3    0.6     8    24.2     1.0   0.0     29    17.0     1.4     0.6
                   Shop          22    20.2     1.9   1.1    27    42.2    2.1    2.0     8    24.2     1.3   0.7     34    19.9     1.9     1.1
                   Other         32    29.4     1.7   1.2    18    28.1    1.4    1.0     7    21.2     1.0   0.0     26    15.2     1.7     1.1
Table 6.6 Energy and nutrient intakes (macronutrients as a percentage of energy, fibre and micronutrients per 10 MJ) from home,
other people's home and outside the home in Irish children aged 5-12 years
                                       Home              Other home                  Out
                                     (n = 594)             (n = 348)              (n = 458)
                                Mean       (SD)       Mean        (SD)       Mean        (SD)
Energy (kcal)                   1427.1 (395.7)         170.6 (141.5)          185.4 (143.8)
Energy (kJ)                     6004.2 (1663.6)        717.1 (594.4)          779.1 (603.8)
% Energy from protein             13.8     (2.3)        12.9      (6.8)        10.9      (5.3)
% Energy from fat                 33.4     (4.6)        35.4     (10.6)        36.9     (10.3)
% Energy from cho                 52.3     (5.2)        51.3     (12.6)        51.2     (12.3)
Fibre per 10 MJ                  13.7      (3.8)        13.1     (10.1)        10.0      (6.3)
Calcium per 10 MJ               1335.5 (361.4)        908.6 (567.7)          602.1 (462.1)
Magnesium per 10MJ               282.4 (46.9)          249.8 (107.6)          222.3 (76.0)
Phosphorous per 10MJ            1501.1 (265.8)        1273.8 (559.9)         1101.3 (468.3)
Iron per 10 MJ                    14.2     (4.6)        11.1     (11.6)         7.4      (4.1)
Zinc per 10 MJ                     9.7     (2.5)         8.8      (6.0)         6.9      (4.2)
Vitamin E per 10 MJ                9.4     (6.7)         8.3      (6.9)         7.9      (7.7)
Thiamin per 10 MJ                 2.4      (3.2)        1.6       (1.3)         1.1      (0.8)
Riboflavin per 10 MJ               2.9     (3.2)         1.7      (1.4)         1.0      (0.8)
Vitamin B6 per 10 MJ              3.1      (3.3)         2.3      (1.8)         1.7      (0.9)
Vitamin B12 per 10 MJ             6.7      (3.3)         5.1     (13.3)         2.9      (3.4)
Folate per 10 MJ                 355.4 (149.6)         236.3 (203.2)          164.4 (90.6)
Vitamin C per 10 MJ              141.1 (107.4)          97.0 (208.5)           62.4     (96.9)
Sodium per 10 MJ                3114.6 (673.8)        2820.6 (1642.4)        2481.1 (1506.1)
Table 6.7 Energy and nutrient intakes (macronutrients as a percentage of energy, fibre and
micronutrients per 10 MJ) from home, other people's home and outside the home in Irish children
aged 5-12 years by sex
                                      Home                Other home                  Out
                                Mean (SD)               Mean (SD)               Mean (SD)
Boys                               (n = 291)                (n =159)               (n = 212)
Energy (kcal)                  1530.0 (419.7)           169.7 (153.4)           187.7 (140.8)
Energy (kJ)                    6437.9 (1764.4)          713.3 (644.2)           788.6 (591.1)
% Energy from protein            13.8    (2.3)           12.9     (6.9)          10.3     (5.6)
% Energy from fat                32.9    (4.7)           34.9 (11.1)             36.5 (11.6)
% Energy from cho                52.8    (5.4)           51.8 (13.1)             52.5 (14.4)
Fibre per 10 MJ                  13.8    (4.0)          13.5 (11.3)               9.8     (6.0)
Calcium per 10 MJ              1345.6 (354.6)           924.9 (649.3)           536.6 (388.5)
Magnesium per 10MJ              284.2 (50.1)            255.5 (124.9)           214.2 (74.5)
Phosphorous per 10MJ           1514.9 (260.8)          1303.1 (624.3)          1039.5 (466.7)
Iron per 10 MJ                   14.7    (4.8)           11.7 (15.2)              7.0     (3.6)
Zinc per 10 MJ                    9.7    (2.6)            9.4     (6.6)           6.5     (4.3)
Vitamin E per 10 MJ               9.4    (6.9)            7.8     (6.1)           8.2     (8.9)
Thiamin per 10 MJ                 2.3    (0.8)            1.7     (1.5)           0.9     (0.7)
Riboflavin per 10 MJ             2.9     (1.0)            1.6     (1.5)           0.9     (0.7)
Vitamin B6 per 10 MJ              3.0    (1.0)            2.2     (1.8)           1.7     (0.9)
Vitamin B12 per 10 MJ             6.6    (2.8)            5.6    (18.2)           2.6     (2.6)
Folate per 10 MJ                365.1 (146.0)           240.0 (242.9)           158.4 (93.1)
Vitamin C per 10 MJ             130.9 (104.8)            99.3 (281.7)            54.0 (96.7)
Sodium per 10 MJ               3090.9 (659.5)          2764.2 (1615.2)         2417.3 (1561.6)
Girls                              (n = 303)              (n = 190)              (n = 247)
Energy (kcal)                  1328.3 (343.9)          171.4 (131.2)          183.5 (146.5)
Energy (kJ)                    5587.7 (1445.6)          720.3 (551.0)         771.0 (615.5)
% Energy from protein           13.8     (2.3)          12.9    (6.8)          11.4    (5.0)
% Energy from fat               33.9     (4.5)          35.8 (10.2)            37.3    (9.0)
% Energy from cho               51.9     (5.1)          50.8 (12.2)            50.2 (10.2)
Fibre per 10 MJ                 13.5     (3.6)          12.8    (9.0)          10.2    (6.5)
Calcium per 10 MJ              1325.7 (368.2)          894.9 (490.1)          658.1 (510.9)
Magnesium per 10MJ              280.6 (43.5)            244.9 (90.5)           229.2 (76.7)
Phosphorous per 10MJ           1487.9 (270.3)          1249.2 (499.8)         1154.2 (464.1)
Iron per 10 MJ                   13.7    (4.3)          10.5    (7.2)           7.6    (4.5)
Zinc per 10 MJ                   9.6     (2.4)           8.4    (5.4)           7.2    (4.1)
Vitamin E per 10 MJ              9.4     (6.6)           8.7    (7.4)           7.6    (6.5)
Thiamin per 10 MJ                2.5     (4.4)           1.6    (1.0)           1.1    (0.9)
Riboflavin per 10 MJ             2.9     (4.4)           1.7    (1.3)           1.1    (1.0)
Vitamin B6 per 10 MJ             3.2     (4.4)           2.4    (1.7)           1.8    (1.0)
Vitamin B12 per 10 MJ             6.7    (3.7)           4.7    (6.8)           3.2    (4.0)
Folate per 10 MJ               346.1 (152.7)           233.2 (163.1)          169.5 (88.3)
Vitamin C per 10 MJ             150.8 (109.2)           95.0 (116.4)           69.5 (96.6)
Sodium per 10 MJ               3137.4 (687.6)          2868.0 (1667.7)        2535.7 (1458.0)
Table 6.8 Energy and nutrient intakes (macronutrients as a percentage of energy, fibre and
micronutrients per 10 MJ) from home, other people's home and outside the home for Irish
children of different age groups
                                        Home              Other home                   Out
                                 Mean       (SD)        Mean (SD)               Mean (SD)
5-8.9 years                           (n = 296)            (n = 190)                (n = 219)
Energy (kcal)                    1343.6 (351.1)         170.3 (137.7)           157.2 (106.6)
Energy (kJ)                      5652.3 (1475.1)        716.1 (578.6)           660.2 (447.7)
% Energy from protein             13.9      (2.1)        12.5     (6.0)          11.1     (5.0)
% Energy from fat                 33.4      (4.5)        35.0 (10.3)             38.7     (8.9)
% Energy from cho                 52.3      (5.1)        52.0 (11.9)             49.3 (10.2)
Fibre per 10 MJ                   13.6      (3.6)        12.9 (10.4)             10.3     (5.9)
Calcium per 10 MJ                1394.7 (370.0)         942.3 (614.3)           603.6 (454.7)
Magnesium per 10MJ                283.8 (46.8)          246.4 (101.4)           222.6 (61.9)
Phosphorous per 10MJ             1540.5 (260.9)        1260.4 (567.4)          1135.9 (495.3)
Iron per 10 MJ                     14.2     (4.5)        11.1 (14.0)              7.1     (3.2)
Zinc per 10 MJ                     9.6      (2.2)         8.3     (5.4)           6.7     (3.8)
Vitamin E per 10 MJ                9.5      (6.7)         7.8     (6.3)           8.5     (7.8)
Thiamin per 10 MJ                  2.3      (0.8)         1.6     (1.1)           1.1     (0.7)
Riboflavin per 10 MJ               2.9      (1.0)        1.7      (1.5)           1.0     (0.8)
Vitamin B6 per 10 MJ               3.0      (1.0)         2.2     (1.6)           1.8     (0.9)
Vitamin B12 per 10 MJ               6.8     (2.7)         5.8    (17.6)           2.9     (3.5)
Folate per 10 MJ                 361.0 (152.7)          240.0 (228.0)           169.6 (84.4)
Vitamin C per 10 MJ               141.7 (89.5)          108.5 (266.9)            67.5 (106.5)
Sodium per 10 MJ                 3095.5 (643.8)        2811.5 (1732.2)         2649.7 (1604.0)
9 to 12.9 years                     (n = 298)             (n = 158)              (n = 240)
Energy (kcal)                  1510.1 (419.9)          171.0 (146.5)          211.2 (166.9)
Energy (kJ)                    6353.8 (1766.0)          718.4 (614.8)         887.6 (700.7)
% Energy from protein           13.8      (2.5)         13.3    (7.6)          10.7    (5.5)
% Energy from fat               33.4      (4.7)         35.8 (11.0)            35.3 (11.2)
% Energy from cho               52.3      (5.4)         50.3 (13.4)            53.0 (13.8)
Fibre per 10 MJ                 13.7      (4.0)         13.4    (9.8)           9.7    (6.7)
Calcium per 10 MJ              1276.7 (343.4)          868.1 (504.9)          600.7 (469.7)
Magnesium per 10MJ              280.9 (46.9)           253.7 (114.8)          221.9 (87.1)
Phosphorous per 10MJ           1462.1 (265.3)          1290.0 (552.2)         1069.7 (440.8)
Iron per 10 MJ                   14.2     (4.6)         11.0    (7.8)           7.6    (4.8)
Zinc per 10 MJ                   9.7      (2.7)          9.5    (6.6)           7.1    (4.5)
Vitamin E per 10 MJ              9.3      (6.8)          8.9    (7.5)           7.3    (7.6)
Thiamin per 10 MJ                2.5      (4.4)          1.6    (1.4)           1.0    (0.8)
Riboflavin per 10 MJ             2.9      (4.4)          1.6    (1.3)           1.0    (0.9)
Vitamin B6 per 10 MJ             3.2      (4.5)          2.4    (1.9)           1.7    (1.0)
Vitamin B12 per 10 MJ             6.5     (3.8)          4.3    (3.9)           3.0    (3.4)
Folate per 10 MJ               349.8 (146.6)           231.8 (169.3)          159.5 (95.8)
Vitamin C per 10 MJ             140.5 (122.8)           83.1 (100.0)           57.7 (87.1)
Sodium per 10 MJ               3133.6 (703.0)          2831.5 (1532.8)        2326.6 (1396.0)
Table 6.9 Energy and nutrient intakes (macronutrients as a percentage of energy, fibre and micronutrients per 10 MJ)
from locations outside the home (takeaway, restaurant, shop and other locations) in Irish children aged 5-12 years
                                    Takeaway                Restaurant                Shop                 Other
                                     (n = 288)               (n = 157)              (n = 182)            (n = 134)
                                Mean        (SD)        Mean          (SD)     Mean        (SD)      Mean       (SD)
Energy (kcal)                    134.7 (94.0)            123.6       (73.4)      78.6     (69.1)      92.7     (92.0)
Energy (kJ)                      566.0 (394.6)           518.9      (307.2)    330.6 (290.6)         389.6 (386.3)
% Energy from protein             12.9      (5.1)         13.3        (6.6)       5.5      (4.0)       7.9      (5.2)
% Energy from fat                 38.6      (7.4)         37.8        (9.2)      34.5     (16.2)      33.5     (13.4)
% Energy from cho                 47.7      (9.4)         48.4       (11.1)     58.4      (17.4)      57.2     (15.9)
Fibre per 10 MJ                   10.4      (5.5)         12.5        (7.9)       6.5      (6.8)      10.8      (9.5)
Calcium per 10 MJ                563.2 (445.5)           631.9      (485.2)    629.8 (508.6)          690.7 (989.8)
Magnesium per 10MJ               234.0 (61.5)            244.1       (76.6)     185.8 (115.2)         227.7 (137.2)
Phosphorous per 10MJ            1235.7 (451.4)          1193.4 (453.2)         746.9 (451.7)         1038.9 (975.4)
Iron per 10 MJ                    8.1       (3.9)          8.7        (4.2)       5.7      (6.0)       7.6     (24.3)
Zinc per 10 MJ                     7.8      (4.6)          8.7        (5.5)       3.4      (2.6)       5.3      (4.3)
Vitamin E per 10 MJ                8.2      (9.5)          7.1        (6.4)       7.1      (7.0)      10.6     (10.7)
Thiamin per 10 MJ                 1.2       (0.9)          1.3        (1.0)       0.8      (1.8)       0.8      (0.7)
Riboflavin per 10 MJ               1.1      (0.8)          0.9        (0.6)       1.1      (1.0)       1.0      (1.3)
Vitamin B6 per 10 MJ              2.1       (0.8)          2.2        (1.3)       0.9      (1.1)       1.1      (0.9)
Vitamin B12 per 10 MJ             3.4       (3.7)          3.0        (3.4)       1.5      (1.9)       2.5      (5.0)
Folate per 10 MJ                 193.4 (82.3)            199.1      (111.2)    101.4 (131.4)          120.5 (101.3)
Vitamin C per 10 MJ               47.1     (57.2)         72.5      (113.1)      85.0 (257.1)          80.9 (156.2)
Sodium per 10 MJ                2978.3 (1496.9)         2447.4 (1448.4)        1673.8 (1824.9)       1990.8 (2208.3)
Table 6.10 Energy and nutrient intakes (macronutrients as a percentage of energy, fibre and micronutrients per 10
MJ) from locations outside the home (takeaway, restaurant, shop and other locations) in Irish children aged 5-12
years by sex
                                     Takeaway             Restaurant               Shop                    Other
                                 Mean (SD)             Mean (SD)              Mean (SD)               Mean (SD)
Boys                                 (n = 134)             (n = 70)              (n = 91)                (n = 50)
Energy (kcal)                    136.6 (84.4)          132.9 (76.1)           88.3 (75.7)             80.0 (44.3)
Energy (kJ)                       573.8 (354.6)        557.6 (319.2)          371.3 (318.2)           336.2 (185.9)
% Energy from protein             13.2      (5.4)       12.8     (7.0)         4.9      (3.0)          7.5     (5.1)
% Energy from fat                 38.8      (6.9)       39.5     (8.8)         33.7 (17.0)            31.8 (13.5)
% Energy from cho                  47.3     (9.7)       47.3 (11.6)            59.7 (17.7)            59.3 (16.5)
Fibre per 10 MJ                   10.3      (5.3)       12.5     (6.6)         6.1      (6.2)         10.8     (9.9)
Calcium per 10 MJ                 552.8 (464.5)        527.3 (372.1)          626.0 (569.9)           522.6 (505.4)
Magnesium per 10MJ               235.4 (59.0)          247.1 (70.0)           171.7 (96.8)            203.9 (96.7)
Phosphorous per 10MJ             1257.8 (485.5)       1141.1 (436.9)          718.0 (442.8)           848.5 (481.7)
Iron per 10 MJ                      8.1     (3.0)        8.6     (4.4)         5.5      (6.8)          5.9     (4.8)
Zinc per 10 MJ                      8.1     (4.5)       8.4      (6.4)         3.1      (2.3)          4.6     (3.3)
Vitamin E per 10 MJ                 8.9    (10.8)        6.6     (6.4)         7.1      (6.7)         10.0 (10.7)
Thiamin per 10 MJ                   1.2     (0.8)        1.2     (0.8)         0.6      (0.9)          0.7     (0.6)
Riboflavin per 10 MJ                1.0     (0.7)       0.9      (0.6)         1.1      (1.1)          0.8     (0.8)
Vitamin B6 per 10 MJ                2.1     (0.8)        2.2     (1.3)         0.9      (1.2)          1.0     (0.9)
Vitamin B12 per 10 MJ               3.4     (3.4)        3.0     (3.6)         1.4      (2.0)          1.9     (2.8)
Folate per 10 MJ                 199.7 (86.0)          193.3 (100.8)           93.2 (156.0)           111.5 (102.0)
Vitamin C per 10 MJ                42.4 (50.3)          57.3 (73.2)            66.3 (280.9)           76.7 (136.7)
Sodium per 10 MJ                 3040.0 (1584.9)      2450.3 (1562.0)        1499.0 (1550.0)         1892.7 (1904.9)
Girls                                (n = 154)             (n = 87)              (n = 91)              (n = 84)
Energy (kcal)                    133.0 (101.9)          116.2 (70.8)          69.0 (60.8)          100.6 (111.3)
Energy (kJ)                       559.2 (427.4)         487.7 (295.3)         289.9 (255.4)        422.6 (467.5)
% Energy from protein             12.6     (4.9)        13.8     (6.3)         6.1     (4.8)         8.2     (5.2)
% Energy from fat                 38.5     (7.8)        36.4     (9.3)        35.2 (15.5)           34.4 (13.4)
% Energy from cho                  48.0    (9.2)         49.3 (10.8)          57.1 (17.0)           56.0 (15.6)
Fibre per 10 MJ                   10.4     (5.7)        12.4     (8.9)         6.9     (7.4)        10.8     (9.3)
Calcium per 10 MJ                 572.2 (429.6)         716.0 (547.6)         633.7 (442.0)         790.8 (1179.7)
Magnesium per 10MJ               232.8 (63.7)          241.7 (81.8)          199.9 (130.0)         241.9 (155.2)
Phosphorous per 10MJ             1216.5 (420.2)        1235.6 (464.1)         775.8 (461.1)        1152.2 (1163.1)
Iron per 10 MJ                      8.1    (4.6)         8.8     (4.1)         5.9     (5.1)         8.7    (30.5)
Zinc per 10 MJ                      7.6    (4.7)         8.9     (4.6)         3.8     (2.8)         5.8     (4.8)
Vitamin E per 10 MJ                 7.6    (8.2)         7.5     (6.4)         7.2     (7.4)        11.0 (10.8)
Thiamin per 10 MJ                   1.2    (0.9)         1.5     (1.1)         1.0     (2.4)         0.9     (0.7)
Riboflavin per 10 MJ                1.1    (0.9)         1.0     (0.7)         1.1     (0.9)         1.1     (1.6)
Vitamin B6 per 10 MJ                2.0    (0.8)         2.2     (1.3)         0.9     (1.0)         1.2     (1.0)
Vitamin B12 per 10 MJ               3.4    (3.9)         3.0     (3.2)         1.6     (1.9)         2.9     (5.9)
Folate per 10 MJ                 188.0 (78.8)          203.8 (119.3)          109.5 (101.3)         125.8 (101.0)
Vitamin C per 10 MJ                51.2 (62.4)           84.7 (136.3)         103.7 (231.0)         83.4 (167.5)
Sodium per 10 MJ                 2924.5 (1419.0)       2445.0 (1359.3)       1848.7 (2057.4)       2049.2 (2379.7)
Table 6.11 Energy and nutrient intakes (macronutrients as a percentage of energy, fibre and micronutrients per 10
MJ) from locations outside the home (takeaway, restaurant, shop and other locations) in Irish children by age group
                                      Takeaway             Restaurant               Shop                    Other
                                  Mean (SD)             Mean (SD)              Mean (SD)               Mean (SD)
5-8.9 years                           (n = 144)             (n = 72)              (n = 84)                (n = 64)
Energy (kcal)                      110.8 (65.6)         112.2 (69.6)            56.5 (47.0)            88.1 (61.7)
Energy (kJ)                        465.8 (275.9)        470.2 (289.9)          237.5 (197.5)           370.5 (259.6)
% Energy from protein               13.4    (5.4)        12.7     (6.2)         5.9      (4.6)          7.3     (4.1)
% Energy from fat                   39.2    (7.0)        38.9     (9.2)         36.7 (16.8)            34.0 (13.1)
% Energy from cho                   46.8    (8.8)        47.8 (11.2)            55.2 (17.8)            57.3 (14.7)
Fibre per 10 MJ                     10.3    (5.1)        11.7     (7.1)         7.9      (7.9)         10.8     (9.3)
Calcium per 10 MJ                  567.9 (452.3)        662.1 (510.7)          614.7 (423.0)           568.3 (753.2)
Magnesium per 10MJ                 236.7 (57.5)         230.6 (65.8)           197.4 (130.7)           209.0 (99.1)
Phosphorous per 10MJ              1310.4 (499.5)       1166.7 (487.3)          763.9 (494.8)           856.9 (615.8)
Iron per 10 MJ                      7.8     (3.4)         7.8     (3.6)         6.2      (5.4)          5.1     (3.4)
Zinc per 10 MJ                      7.7     (4.4)         7.9     (5.1)         3.7      (2.9)          4.4     (3.0)
Vitamin E per 10 MJ                 8.6     (9.6)         7.9     (6.9)         7.6      (7.0)         11.2 (10.9)
Thiamin per 10 MJ                   1.2     (0.8)         1.3     (0.9)         1.0      (2.6)          0.8     (0.7)
Riboflavin per 10 MJ                1.0     (0.7)         1.0     (0.6)         1.2      (1.0)          0.8     (1.3)
Vitamin B6 per 10 MJ                2.1     (0.8)         2.1     (1.3)         1.0      (1.1)          1.2     (1.1)
Vitamin B12 per 10 MJ               3.4     (4.0)         2.9     (3.1)         1.5      (2.0)          2.1     (4.9)
Folate per 10 MJ                   193.1 (76.2)         198.1 (111.7)          116.9 (150.0)           120.0 (104.8)
Vitamin C per 10 MJ                 46.5 (57.5)          81.1 (147.5)          114.2 (343.0)            93.3 (170.2)
Sodium per 10 MJ                  3097.6 (1581.0)      2518.9 (1544.7)        1904.6 (2220.4)         1700.8 (1561.1)
9 to 12.9 years                       (n = 144)             (n = 85)              (n = 98)              (n = 70)
Energy (kcal)                      158.5 (110.8)         133.3 (75.6)          97.6 (79.0)           96.8 (112.6)
Energy (kJ)                        666.2 (465.0)         560.1 (316.9)         410.4 (332.0)        406.5 (472.5)
% Energy from protein               12.3    (4.8)        13.8     (6.9)         5.2     (3.3)         8.6     (6.0)
% Energy from fat                   38.0    (7.7)        36.8     (9.1)        32.6 (15.5)           32.9 (13.8)
% Energy from cho                   48.6 (10.0)          48.9 (11.1)           61.1 (16.6)           57.2 (17.0)
Fibre per 10 MJ                     10.5    (5.8)        13.1     (8.5)         5.4     (5.5)        10.8     (9.8)
Calcium per 10 MJ                  558.4 (440.1)         606.3 (464.0)         642.8 (573.8)         802.6 (1159.2)
Magnesium per 10MJ                 231.3 (65.3)          255.6 (83.4)         175.9 (99.6)           244.8 (163.4)
Phosphorous per 10MJ              1161.1 (385.0)        1216.1 (423.8)        732.3 (413.3)         1205.2 (1195.4)
Iron per 10 MJ                      8.4     (4.3)         9.5     (4.5)         5.2     (6.5)         9.9    (33.5)
Zinc per 10 MJ                      7.9     (4.8)         9.3     (5.8)         3.3     (2.2)         6.2     (5.1)
Vitamin E per 10 MJ                 7.9     (9.5)         6.4     (5.9)         6.7     (7.1)        10.1 (10.6)
Thiamin per 10 MJ                   1.2     (0.9)         1.4     (1.1)         0.6     (0.8)         0.9     (0.7)
Riboflavin per 10 MJ                1.1     (0.9)         0.9     (0.6)         1.1     (1.0)         1.1     (1.3)
Vitamin B6 per 10 MJ                2.1     (0.8)         2.2     (1.3)         0.8     (1.2)         1.0     (0.8)
Vitamin B12 per 10 MJ               3.5     (3.3)         3.1     (3.6)         1.5     (1.9)         2.9     (5.2)
Folate per 10 MJ                   193.7 (88.2)          200.0 (111.5)         88.1 (112.2)         120.9 (98.7)
Vitamin C per 10 MJ                 47.7 (57.1)           65.2 (72.5)          60.0 (146.0)          69.5 (142.6)
Sodium per 10 MJ                  2858.9 (1403.2)       2386.8 (1367.8)       1476.1 (1382.0)       2255.9 (2650.5)

Weitere ähnliche Inhalte

Ähnlich wie NCFS - C6 T6 P1to11

The Science and Practice of Cartographic Interaction
The Science and Practice of Cartographic InteractionThe Science and Practice of Cartographic Interaction
The Science and Practice of Cartographic Interactionreroth
 
Ενδέκατη Εβδομάδα Τιμώμενου Μέλους
Ενδέκατη Εβδομάδα Τιμώμενου ΜέλουςΕνδέκατη Εβδομάδα Τιμώμενου Μέλους
Ενδέκατη Εβδομάδα Τιμώμενου Μέλουςmpiskotos
 
Encuesta a niños y adolescentes sobre la radio y televisión peruana 2014 | Po...
Encuesta a niños y adolescentes sobre la radio y televisión peruana 2014 | Po...Encuesta a niños y adolescentes sobre la radio y televisión peruana 2014 | Po...
Encuesta a niños y adolescentes sobre la radio y televisión peruana 2014 | Po...Andrinik Huaytalla Ramos
 
PEX_Our Food Calories and Nutritions
PEX_Our Food Calories and NutritionsPEX_Our Food Calories and Nutritions
PEX_Our Food Calories and NutritionsEvian Christ
 

Ähnlich wie NCFS - C6 T6 P1to11 (7)

The Science and Practice of Cartographic Interaction
The Science and Practice of Cartographic InteractionThe Science and Practice of Cartographic Interaction
The Science and Practice of Cartographic Interaction
 
Ενδέκατη Εβδομάδα Τιμώμενου Μέλους
Ενδέκατη Εβδομάδα Τιμώμενου ΜέλουςΕνδέκατη Εβδομάδα Τιμώμενου Μέλους
Ενδέκατη Εβδομάδα Τιμώμενου Μέλους
 
Fondos Recibidos Por Ayuntamientos 1999 2005 úLtimo
Fondos Recibidos Por Ayuntamientos 1999 2005 úLtimoFondos Recibidos Por Ayuntamientos 1999 2005 úLtimo
Fondos Recibidos Por Ayuntamientos 1999 2005 úLtimo
 
Gsom1
Gsom1Gsom1
Gsom1
 
Encuesta a niños y adolescentes sobre la radio y televisión peruana 2014 | Po...
Encuesta a niños y adolescentes sobre la radio y televisión peruana 2014 | Po...Encuesta a niños y adolescentes sobre la radio y televisión peruana 2014 | Po...
Encuesta a niños y adolescentes sobre la radio y televisión peruana 2014 | Po...
 
mansoane
mansoanemansoane
mansoane
 
PEX_Our Food Calories and Nutritions
PEX_Our Food Calories and NutritionsPEX_Our Food Calories and Nutritions
PEX_Our Food Calories and Nutritions
 

Mehr von LBG

Ink ex pop_up
Ink ex pop_upInk ex pop_up
Ink ex pop_upLBG
 
INKEx FAS placement
INKEx FAS placementINKEx FAS placement
INKEx FAS placementLBG
 
NTFS - Chapter 6 Tables
NTFS - Chapter 6 TablesNTFS - Chapter 6 Tables
NTFS - Chapter 6 TablesLBG
 
NTFS - Chapter 5 Tables
NTFS - Chapter 5 TablesNTFS - Chapter 5 Tables
NTFS - Chapter 5 TablesLBG
 
NTFS - Chapter 4 Tables
NTFS - Chapter 4 TablesNTFS - Chapter 4 Tables
NTFS - Chapter 4 TablesLBG
 
NTFS - Chapter 3 Tables
NTFS - Chapter 3 TablesNTFS - Chapter 3 Tables
NTFS - Chapter 3 TablesLBG
 
NTFS - Chapter 2 Tables
NTFS - Chapter 2 TablesNTFS - Chapter 2 Tables
NTFS - Chapter 2 TablesLBG
 
NTFS - Chapter 1 Methodology
NTFS - Chapter 1 MethodologyNTFS - Chapter 1 Methodology
NTFS - Chapter 1 MethodologyLBG
 
NTFS - Chapter 1 Background
NTFS - Chapter 1 BackgroundNTFS - Chapter 1 Background
NTFS - Chapter 1 BackgroundLBG
 
NTFS - Table of Contents
NTFS - Table of ContentsNTFS - Table of Contents
NTFS - Table of ContentsLBG
 
NFTS - Summary Report Tables
NFTS - Summary Report TablesNFTS - Summary Report Tables
NFTS - Summary Report TablesLBG
 
NTFS - Summary Report
NTFS - Summary ReportNTFS - Summary Report
NTFS - Summary ReportLBG
 
NS - Food Survey Full Report 2001
NS - Food Survey Full Report 2001NS - Food Survey Full Report 2001
NS - Food Survey Full Report 2001LBG
 
NS - Food Survey Summary 2001
NS - Food Survey Summary 2001NS - Food Survey Summary 2001
NS - Food Survey Summary 2001LBG
 
NCFS C4 T4 13to44
NCFS C4 T4 13to44NCFS C4 T4 13to44
NCFS C4 T4 13to44LBG
 
NCFS - Contents
NCFS - ContentsNCFS - Contents
NCFS - ContentsLBG
 
NCFS - Methodology
NCFS - MethodologyNCFS - Methodology
NCFS - MethodologyLBG
 
NCFS - Background
NCFS - BackgroundNCFS - Background
NCFS - BackgroundLBG
 
NCFS - C2 T2 P1to10
NCFS - C2 T2 P1to10NCFS - C2 T2 P1to10
NCFS - C2 T2 P1to10LBG
 
NCFS - C3 T3 P1to6
NCFS - C3 T3 P1to6NCFS - C3 T3 P1to6
NCFS - C3 T3 P1to6LBG
 

Mehr von LBG (20)

Ink ex pop_up
Ink ex pop_upInk ex pop_up
Ink ex pop_up
 
INKEx FAS placement
INKEx FAS placementINKEx FAS placement
INKEx FAS placement
 
NTFS - Chapter 6 Tables
NTFS - Chapter 6 TablesNTFS - Chapter 6 Tables
NTFS - Chapter 6 Tables
 
NTFS - Chapter 5 Tables
NTFS - Chapter 5 TablesNTFS - Chapter 5 Tables
NTFS - Chapter 5 Tables
 
NTFS - Chapter 4 Tables
NTFS - Chapter 4 TablesNTFS - Chapter 4 Tables
NTFS - Chapter 4 Tables
 
NTFS - Chapter 3 Tables
NTFS - Chapter 3 TablesNTFS - Chapter 3 Tables
NTFS - Chapter 3 Tables
 
NTFS - Chapter 2 Tables
NTFS - Chapter 2 TablesNTFS - Chapter 2 Tables
NTFS - Chapter 2 Tables
 
NTFS - Chapter 1 Methodology
NTFS - Chapter 1 MethodologyNTFS - Chapter 1 Methodology
NTFS - Chapter 1 Methodology
 
NTFS - Chapter 1 Background
NTFS - Chapter 1 BackgroundNTFS - Chapter 1 Background
NTFS - Chapter 1 Background
 
NTFS - Table of Contents
NTFS - Table of ContentsNTFS - Table of Contents
NTFS - Table of Contents
 
NFTS - Summary Report Tables
NFTS - Summary Report TablesNFTS - Summary Report Tables
NFTS - Summary Report Tables
 
NTFS - Summary Report
NTFS - Summary ReportNTFS - Summary Report
NTFS - Summary Report
 
NS - Food Survey Full Report 2001
NS - Food Survey Full Report 2001NS - Food Survey Full Report 2001
NS - Food Survey Full Report 2001
 
NS - Food Survey Summary 2001
NS - Food Survey Summary 2001NS - Food Survey Summary 2001
NS - Food Survey Summary 2001
 
NCFS C4 T4 13to44
NCFS C4 T4 13to44NCFS C4 T4 13to44
NCFS C4 T4 13to44
 
NCFS - Contents
NCFS - ContentsNCFS - Contents
NCFS - Contents
 
NCFS - Methodology
NCFS - MethodologyNCFS - Methodology
NCFS - Methodology
 
NCFS - Background
NCFS - BackgroundNCFS - Background
NCFS - Background
 
NCFS - C2 T2 P1to10
NCFS - C2 T2 P1to10NCFS - C2 T2 P1to10
NCFS - C2 T2 P1to10
 
NCFS - C3 T3 P1to6
NCFS - C3 T3 P1to6NCFS - C3 T3 P1to6
NCFS - C3 T3 P1to6
 

Kürzlich hochgeladen

Difference Between Search & Browse Methods in Odoo 17
Difference Between Search & Browse Methods in Odoo 17Difference Between Search & Browse Methods in Odoo 17
Difference Between Search & Browse Methods in Odoo 17Celine George
 
Barangay Council for the Protection of Children (BCPC) Orientation.pptx
Barangay Council for the Protection of Children (BCPC) Orientation.pptxBarangay Council for the Protection of Children (BCPC) Orientation.pptx
Barangay Council for the Protection of Children (BCPC) Orientation.pptxCarlos105
 
How to do quick user assign in kanban in Odoo 17 ERP
How to do quick user assign in kanban in Odoo 17 ERPHow to do quick user assign in kanban in Odoo 17 ERP
How to do quick user assign in kanban in Odoo 17 ERPCeline George
 
Judging the Relevance and worth of ideas part 2.pptx
Judging the Relevance  and worth of ideas part 2.pptxJudging the Relevance  and worth of ideas part 2.pptx
Judging the Relevance and worth of ideas part 2.pptxSherlyMaeNeri
 
THEORIES OF ORGANIZATION-PUBLIC ADMINISTRATION
THEORIES OF ORGANIZATION-PUBLIC ADMINISTRATIONTHEORIES OF ORGANIZATION-PUBLIC ADMINISTRATION
THEORIES OF ORGANIZATION-PUBLIC ADMINISTRATIONHumphrey A Beña
 
4.18.24 Movement Legacies, Reflection, and Review.pptx
4.18.24 Movement Legacies, Reflection, and Review.pptx4.18.24 Movement Legacies, Reflection, and Review.pptx
4.18.24 Movement Legacies, Reflection, and Review.pptxmary850239
 
Choosing the Right CBSE School A Comprehensive Guide for Parents
Choosing the Right CBSE School A Comprehensive Guide for ParentsChoosing the Right CBSE School A Comprehensive Guide for Parents
Choosing the Right CBSE School A Comprehensive Guide for Parentsnavabharathschool99
 
Full Stack Web Development Course for Beginners
Full Stack Web Development Course  for BeginnersFull Stack Web Development Course  for Beginners
Full Stack Web Development Course for BeginnersSabitha Banu
 
How to Add Barcode on PDF Report in Odoo 17
How to Add Barcode on PDF Report in Odoo 17How to Add Barcode on PDF Report in Odoo 17
How to Add Barcode on PDF Report in Odoo 17Celine George
 
ACC 2024 Chronicles. Cardiology. Exam.pdf
ACC 2024 Chronicles. Cardiology. Exam.pdfACC 2024 Chronicles. Cardiology. Exam.pdf
ACC 2024 Chronicles. Cardiology. Exam.pdfSpandanaRallapalli
 
Influencing policy (training slides from Fast Track Impact)
Influencing policy (training slides from Fast Track Impact)Influencing policy (training slides from Fast Track Impact)
Influencing policy (training slides from Fast Track Impact)Mark Reed
 
MULTIDISCIPLINRY NATURE OF THE ENVIRONMENTAL STUDIES.pptx
MULTIDISCIPLINRY NATURE OF THE ENVIRONMENTAL STUDIES.pptxMULTIDISCIPLINRY NATURE OF THE ENVIRONMENTAL STUDIES.pptx
MULTIDISCIPLINRY NATURE OF THE ENVIRONMENTAL STUDIES.pptxAnupkumar Sharma
 
Gas measurement O2,Co2,& ph) 04/2024.pptx
Gas measurement O2,Co2,& ph) 04/2024.pptxGas measurement O2,Co2,& ph) 04/2024.pptx
Gas measurement O2,Co2,& ph) 04/2024.pptxDr.Ibrahim Hassaan
 
Proudly South Africa powerpoint Thorisha.pptx
Proudly South Africa powerpoint Thorisha.pptxProudly South Africa powerpoint Thorisha.pptx
Proudly South Africa powerpoint Thorisha.pptxthorishapillay1
 
Inclusivity Essentials_ Creating Accessible Websites for Nonprofits .pdf
Inclusivity Essentials_ Creating Accessible Websites for Nonprofits .pdfInclusivity Essentials_ Creating Accessible Websites for Nonprofits .pdf
Inclusivity Essentials_ Creating Accessible Websites for Nonprofits .pdfTechSoup
 
Visit to a blind student's school🧑‍🦯🧑‍🦯(community medicine)
Visit to a blind student's school🧑‍🦯🧑‍🦯(community medicine)Visit to a blind student's school🧑‍🦯🧑‍🦯(community medicine)
Visit to a blind student's school🧑‍🦯🧑‍🦯(community medicine)lakshayb543
 
Grade 9 Q4-MELC1-Active and Passive Voice.pptx
Grade 9 Q4-MELC1-Active and Passive Voice.pptxGrade 9 Q4-MELC1-Active and Passive Voice.pptx
Grade 9 Q4-MELC1-Active and Passive Voice.pptxChelloAnnAsuncion2
 

Kürzlich hochgeladen (20)

Difference Between Search & Browse Methods in Odoo 17
Difference Between Search & Browse Methods in Odoo 17Difference Between Search & Browse Methods in Odoo 17
Difference Between Search & Browse Methods in Odoo 17
 
Barangay Council for the Protection of Children (BCPC) Orientation.pptx
Barangay Council for the Protection of Children (BCPC) Orientation.pptxBarangay Council for the Protection of Children (BCPC) Orientation.pptx
Barangay Council for the Protection of Children (BCPC) Orientation.pptx
 
How to do quick user assign in kanban in Odoo 17 ERP
How to do quick user assign in kanban in Odoo 17 ERPHow to do quick user assign in kanban in Odoo 17 ERP
How to do quick user assign in kanban in Odoo 17 ERP
 
Model Call Girl in Tilak Nagar Delhi reach out to us at 🔝9953056974🔝
Model Call Girl in Tilak Nagar Delhi reach out to us at 🔝9953056974🔝Model Call Girl in Tilak Nagar Delhi reach out to us at 🔝9953056974🔝
Model Call Girl in Tilak Nagar Delhi reach out to us at 🔝9953056974🔝
 
Judging the Relevance and worth of ideas part 2.pptx
Judging the Relevance  and worth of ideas part 2.pptxJudging the Relevance  and worth of ideas part 2.pptx
Judging the Relevance and worth of ideas part 2.pptx
 
Raw materials used in Herbal Cosmetics.pptx
Raw materials used in Herbal Cosmetics.pptxRaw materials used in Herbal Cosmetics.pptx
Raw materials used in Herbal Cosmetics.pptx
 
OS-operating systems- ch04 (Threads) ...
OS-operating systems- ch04 (Threads) ...OS-operating systems- ch04 (Threads) ...
OS-operating systems- ch04 (Threads) ...
 
THEORIES OF ORGANIZATION-PUBLIC ADMINISTRATION
THEORIES OF ORGANIZATION-PUBLIC ADMINISTRATIONTHEORIES OF ORGANIZATION-PUBLIC ADMINISTRATION
THEORIES OF ORGANIZATION-PUBLIC ADMINISTRATION
 
4.18.24 Movement Legacies, Reflection, and Review.pptx
4.18.24 Movement Legacies, Reflection, and Review.pptx4.18.24 Movement Legacies, Reflection, and Review.pptx
4.18.24 Movement Legacies, Reflection, and Review.pptx
 
Choosing the Right CBSE School A Comprehensive Guide for Parents
Choosing the Right CBSE School A Comprehensive Guide for ParentsChoosing the Right CBSE School A Comprehensive Guide for Parents
Choosing the Right CBSE School A Comprehensive Guide for Parents
 
Full Stack Web Development Course for Beginners
Full Stack Web Development Course  for BeginnersFull Stack Web Development Course  for Beginners
Full Stack Web Development Course for Beginners
 
How to Add Barcode on PDF Report in Odoo 17
How to Add Barcode on PDF Report in Odoo 17How to Add Barcode on PDF Report in Odoo 17
How to Add Barcode on PDF Report in Odoo 17
 
ACC 2024 Chronicles. Cardiology. Exam.pdf
ACC 2024 Chronicles. Cardiology. Exam.pdfACC 2024 Chronicles. Cardiology. Exam.pdf
ACC 2024 Chronicles. Cardiology. Exam.pdf
 
Influencing policy (training slides from Fast Track Impact)
Influencing policy (training slides from Fast Track Impact)Influencing policy (training slides from Fast Track Impact)
Influencing policy (training slides from Fast Track Impact)
 
MULTIDISCIPLINRY NATURE OF THE ENVIRONMENTAL STUDIES.pptx
MULTIDISCIPLINRY NATURE OF THE ENVIRONMENTAL STUDIES.pptxMULTIDISCIPLINRY NATURE OF THE ENVIRONMENTAL STUDIES.pptx
MULTIDISCIPLINRY NATURE OF THE ENVIRONMENTAL STUDIES.pptx
 
Gas measurement O2,Co2,& ph) 04/2024.pptx
Gas measurement O2,Co2,& ph) 04/2024.pptxGas measurement O2,Co2,& ph) 04/2024.pptx
Gas measurement O2,Co2,& ph) 04/2024.pptx
 
Proudly South Africa powerpoint Thorisha.pptx
Proudly South Africa powerpoint Thorisha.pptxProudly South Africa powerpoint Thorisha.pptx
Proudly South Africa powerpoint Thorisha.pptx
 
Inclusivity Essentials_ Creating Accessible Websites for Nonprofits .pdf
Inclusivity Essentials_ Creating Accessible Websites for Nonprofits .pdfInclusivity Essentials_ Creating Accessible Websites for Nonprofits .pdf
Inclusivity Essentials_ Creating Accessible Websites for Nonprofits .pdf
 
Visit to a blind student's school🧑‍🦯🧑‍🦯(community medicine)
Visit to a blind student's school🧑‍🦯🧑‍🦯(community medicine)Visit to a blind student's school🧑‍🦯🧑‍🦯(community medicine)
Visit to a blind student's school🧑‍🦯🧑‍🦯(community medicine)
 
Grade 9 Q4-MELC1-Active and Passive Voice.pptx
Grade 9 Q4-MELC1-Active and Passive Voice.pptxGrade 9 Q4-MELC1-Active and Passive Voice.pptx
Grade 9 Q4-MELC1-Active and Passive Voice.pptx
 

NCFS - C6 T6 P1to11

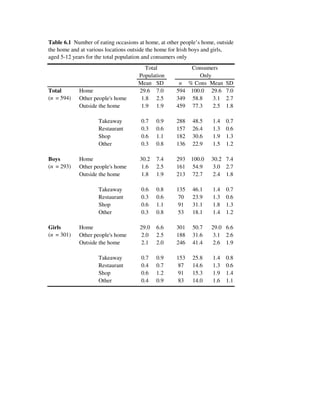
  • 1. Table 6.1 Number of eating occasions at home, at other people’s home, outside the home and at various locations outside the home for Irish boys and girls, aged 5-12 years for the total population and consumers only Total Consumers Population Only Mean SD n % Cons Mean SD Total Home 29.6 7.0 594 100.0 29.6 7.0 (n = 594) Other people's home 1.8 2.5 349 58.8 3.1 2.7 Outside the home 1.9 1.9 459 77.3 2.5 1.8 Takeaway 0.7 0.9 288 48.5 1.4 0.7 Restaurant 0.3 0.6 157 26.4 1.3 0.6 Shop 0.6 1.1 182 30.6 1.9 1.3 Other 0.3 0.8 136 22.9 1.5 1.2 Boys Home 30.2 7.4 293 100.0 30.2 7.4 (n = 293) Other people's home 1.6 2.5 161 54.9 3.0 2.7 Outside the home 1.8 1.9 213 72.7 2.4 1.8 Takeaway 0.6 0.8 135 46.1 1.4 0.7 Restaurant 0.3 0.6 70 23.9 1.3 0.6 Shop 0.6 1.1 91 31.1 1.8 1.3 Other 0.3 0.8 53 18.1 1.4 1.2 Girls Home 29.0 6.6 301 50.7 29.0 6.6 (n = 301) Other people's home 2.0 2.5 188 31.6 3.1 2.6 Outside the home 2.1 2.0 246 41.4 2.6 1.9 Takeaway 0.7 0.9 153 25.8 1.4 0.8 Restaurant 0.4 0.7 87 14.6 1.3 0.6 Shop 0.6 1.2 91 15.3 1.9 1.4 Other 0.4 0.9 83 14.0 1.6 1.1
  • 2. Table 6.2 Number of eating occasions at home, at other people’s home, outside the home and at various locations outside the home for Irish boys and girls by age group 5-8 years 9 to 12 years n % Cons Mean SD n % Cons Mean SD Total Home 296 100.0 29.9 6.8 298 100.0 29.3 7.2 Other people's home 191 64.5 3.2 2.7 158 53.0 2.9 2.6 Outside the home 219 74.0 2.3 1.6 240 80.5 2.7 2.0 Takeaway 144 48.6 1.3 0.5 144 48.3 1.5 0.9 Restaurant 72 24.3 1.3 0.5 85 28.5 1.3 0.6 Shop 84 28.4 1.8 1.4 98 32.9 1.9 1.3 Other 64 21.6 1.3 0.8 72 24.2 1.6 1.4 Boys Home 145 100.0 29.9 7.3 148 100.0 30.6 7.5 Other people's home 93 64.1 3.3 2.9 68 45.9 2.5 2.5 Outside the home 98 67.6 2.2 1.5 115 77.7 2.7 2.0 Takeaway 69 47.6 1.3 0.5 66 44.6 1.5 0.8 Restaurant 31 21.4 1.1 0.3 39 26.4 1.4 0.7 Shop 33 22.8 1.8 1.3 58 39.2 1.9 1.3 Other 27 18.6 1.3 0.7 26 17.6 1.5 1.7 Girls Home 151 100.0 29.9 6.3 150 100.0 28.1 6.8 Other people's home 98 64.9 3.1 2.5 90 60.0 3.2 2.7 Outside the home 121 80.1 2.4 1.7 125 83.3 2.7 2.1 Takeaway 75 49.7 1.2 0.5 78 52.0 1.6 0.9 Restaurant 41 27.2 1.4 0.6 46 30.7 1.2 0.5 Shop 51 33.8 1.8 1.4 40 26.7 2.0 1.4 Other 37 24.5 1.4 0.9 46 30.7 1.7 1.2
  • 3. Table 6.3 Number of eating occasions at home, at other people’s home, outside the home and at various locations outside the home for Irish boys and girls by parental education level Intermediate only Leaving cert Degree/diploma n % Cons Mean SD n % Cons Mean SD n % Cons Mean SD Total Home 109 100.0 28.5 6.9 229 100.0 29.2 6.9 251 100.0 30.5 7.1 Other people's home 49 45.0 2.4 2.0 134 58.5 3.6 3.0 164 65.3 2.8 2.4 Outside the home 75 68.8 2.4 2.1 179 78.2 2.6 1.9 201 80.1 2.4 1.7 Takeaway 51 46.8 1.6 0.8 119 52.0 1.4 0.8 115 45.8 1.3 0.5 Restaurant 23 21.1 1.3 0.6 58 25.3 1.2 0.5 75 29.9 1.3 0.6 Shop 29 26.6 2.0 1.3 66 28.8 2.0 1.5 84 33.5 1.7 1.2 Other 12 11.0 1.3 0.5 60 26.2 1.5 1.3 64 25.5 1.6 1.1 Boys Home 60 100.0 29.1 7.2 113 100.0 29.4 7.3 119 100.0 31.6 7.5 Other people's home 25 41.7 1.8 1.6 58 51.3 4.0 3.3 77 64.7 2.6 2.3 Outside the home 36 60.0 2.2 2.1 82 72.6 2.8 1.9 95 79.8 2.3 1.4 Takeaway 26 43.3 1.4 0.6 55 48.7 1.5 0.8 54 45.4 1.3 0.6 Restaurant 5 8.3 1.8 1.1 27 23.9 1.3 0.7 38 31.9 1.2 0.4 Shop 14 23.3 2.1 1.6 37 32.7 1.9 1.4 40 33.6 1.7 1.1 Other 4 6.7 1.3 0.5 23 20.4 1.6 1.8 26 21.8 1.3 0.7 Girls Home 49 100.0 27.7 6.6 116 100.0 29.0 6.6 132 100.0 29.5 6.5 Other people's home 24 49.0 3.0 2.2 76 65.5 3.3 2.8 87 65.9 3.0 2.5 Outside the home 39 79.6 2.6 2.0 97 83.6 2.5 1.8 106 80.3 2.6 2.0 Takeaway 25 51.0 1.8 1.0 64 55.2 1.4 0.9 61 46.2 1.3 0.5 Restaurant 18 36.7 1.2 0.4 31 26.7 1.1 0.3 37 28.0 1.4 0.8 Shop 15 30.6 1.8 0.9 29 25.0 2.1 1.7 44 33.3 1.8 1.3 Other 8 16.3 1.3 0.5 37 31.9 1.4 0.9 38 28.8 1.7 1.3
  • 4. Table 6.4 Number of eating occasions at home, at other people’s home, outside the home and at various locations outside the home for Irish boys and girls by social class Professional Non-manual occupations Skilled manual Semi-skilled/unskilled n % Cons Mean SD n % Cons Mean SD n % Cons Mean SD n % Cons Mean SD Total Home 307 100.0 29.9 7.2 117 100.0 29.4 6.3 93 100.0 29.0 6.8 74 100.0 29.5 7.9 Other people's home 192 62.5 3.0 2.6 75 64.1 3.4 2.7 46 49.5 3.2 3.1 34 45.9 2.6 2.0 Outside the home 242 78.8 2.5 1.7 95 81.2 2.5 1.9 63 67.7 2.6 2.1 58 78.4 2.6 2.0 Takeaway 142 46.3 1.3 0.5 58 49.6 1.6 1.1 47 50.5 1.5 0.7 40 54.1 1.5 0.6 Restaurant 96 31.3 1.3 0.6 23 19.7 1.2 0.5 21 22.6 1.2 0.5 17 23.0 1.1 0.3 Shop 95 30.9 1.8 1.2 39 33.3 1.6 1.0 23 24.7 2.2 1.8 25 33.8 2.4 1.8 Other 75 24.4 1.6 1.4 38 32.5 1.4 0.9 12 12.9 1.3 0.6 11 14.9 1.2 0.4 Boys Home 144 100.0 30.8 7.5 59 100.0 29.8 6.7 51 100.0 28.5 6.8 38 100.0 31.1 8.5 Other people's home 88 61.1 3.1 2.9 33 55.9 3.4 2.9 21 41.2 3.0 2.9 18 47.4 1.6 1.2 Outside the home 111 77.1 2.5 1.6 44 74.6 2.3 1.8 30 58.8 2.7 2.5 28 73.7 2.3 1.6 Takeaway 66 45.8 1.2 0.4 22 37.3 1.6 1.0 25 49.0 1.6 0.8 22 57.9 1.4 0.6 Restaurant 48 33.3 1.3 0.6 9 15.3 1.3 0.7 8 15.7 1.4 0.7 5 13.2 1.4 0.5 Shop 50 34.7 1.8 1.1 21 35.6 1.6 1.1 9 17.6 3.0 2.4 11 28.9 1.7 1.0 Other 29 20.1 1.6 1.6 16 27.1 1.3 0.8 3 5.9 1.0 0.0 5 13.2 1.2 0.4 Girls Home 163 100.0 29.1 6.8 58 100.0 28.9 5.8 42 100.0 29.6 6.8 36 100.0 27.8 6.8 Other people's home 104 63.8 2.9 2.4 42 72.4 3.4 2.6 25 59.5 3.3 3.4 16 44.4 3.6 2.3 Outside the home 131 80.4 2.5 1.9 51 87.9 2.6 1.9 33 78.6 2.5 1.5 30 83.3 2.9 2.3 Takeaway 76 46.6 1.3 0.6 36 62.1 1.5 1.1 22 52.4 1.5 0.7 18 50.0 1.5 0.7 Restaurant 48 29.4 1.4 0.7 14 24.1 1.1 0.4 13 31.0 1.2 0.4 12 33.3 1.0 0.0 Shop 45 27.6 1.8 1.3 18 31.0 1.6 1.0 14 33.3 1.7 1.1 14 38.9 2.9 2.1 Other 46 28.2 1.7 1.3 22 37.9 1.5 1.0 9 21.4 1.3 0.7 6 16.7 1.2 0.4
  • 5. Table 6.5 Number of eating occasions at home, at other people’s home, outside the home and at various locations outside the home for Irish boys and girls by location of residence Open Country Small town Large town City n % Cons Mean SD n % Cons Mean SD n % Cons Mean SD n % Cons Mean SD Total Home 242 100.0 29.3 6.7 88 100.0 28.8 7.5 93 100.0 29.1 7.9 171 100.0 30.7 6.6 Other people's home 131 54.1 3.5 3.1 64 72.7 3.0 2.5 43 46.2 2.9 2.5 111 64.9 2.6 2.2 Outside the home 175 72.3 2.4 1.8 77 87.5 3.2 2.4 74 79.6 2.1 1.4 133 77.8 2.6 1.6 Takeaway 93 38.4 1.3 0.6 53 60.2 1.5 0.9 53 57.0 1.3 0.6 89 52.0 1.4 0.8 Restaurant 62 25.6 1.2 0.6 27 30.7 1.4 0.8 21 22.6 1.1 0.4 47 27.5 1.3 0.5 Shop 68 28.1 1.8 1.1 41 46.6 2.3 2.0 24 25.8 1.5 0.8 49 28.7 1.8 1.1 Other 55 22.7 1.6 1.4 22 25.0 1.4 1.0 16 17.2 1.4 0.8 43 25.1 1.5 1.0 0.0 Boys Home 133 100.0 29.8 6.8 24 100.0 27.9 8.4 60 100.0 30.3 8.0 76 44.4 31.5 7.5 Other people's home 72 54.1 3.3 3.0 16 66.7 3.8 3.9 29 48.3 3.1 2.7 44 25.7 2.0 1.4 Outside the home 91 68.4 2.4 1.7 21 87.5 3.7 2.7 47 78.3 2.2 1.5 54 31.6 2.2 1.5 Takeaway 47 35.3 1.4 0.6 13 54.2 1.5 0.5 37 61.7 1.2 0.5 38 22.2 1.5 0.9 Restaurant 28 21.1 1.3 0.5 11 45.8 1.6 1.0 13 21.7 1.2 0.4 18 10.5 1.1 0.3 Shop 46 34.6 1.8 1.1 14 58.3 2.6 2.2 16 26.7 1.7 0.9 15 8.8 1.4 0.8 Other 23 17.3 1.4 1.7 4 16.7 1.0 0.0 9 15.0 1.8 1.0 17 9.9 1.3 0.8 0.0 Girls Home 109 100.0 28.6 6.6 64 100.0 29.1 7.2 33 100.0 27.0 7.2 95 55.6 30.1 5.8 Other people's home 59 54.1 3.8 3.2 48 75.0 2.8 1.7 14 42.4 2.4 1.9 67 39.2 2.9 2.5 Outside the home 84 77.1 2.3 1.9 56 87.5 3.0 2.3 27 81.8 1.8 1.2 79 46.2 2.8 1.7 Takeaway 46 42.2 1.3 0.6 40 62.5 1.6 1.0 16 48.5 1.5 0.8 51 29.8 1.4 0.6 Restaurant 34 31.2 1.2 0.6 16 25.0 1.3 0.6 8 24.2 1.0 0.0 29 17.0 1.4 0.6 Shop 22 20.2 1.9 1.1 27 42.2 2.1 2.0 8 24.2 1.3 0.7 34 19.9 1.9 1.1 Other 32 29.4 1.7 1.2 18 28.1 1.4 1.0 7 21.2 1.0 0.0 26 15.2 1.7 1.1
  • 6. Table 6.6 Energy and nutrient intakes (macronutrients as a percentage of energy, fibre and micronutrients per 10 MJ) from home, other people's home and outside the home in Irish children aged 5-12 years Home Other home Out (n = 594) (n = 348) (n = 458) Mean (SD) Mean (SD) Mean (SD) Energy (kcal) 1427.1 (395.7) 170.6 (141.5) 185.4 (143.8) Energy (kJ) 6004.2 (1663.6) 717.1 (594.4) 779.1 (603.8) % Energy from protein 13.8 (2.3) 12.9 (6.8) 10.9 (5.3) % Energy from fat 33.4 (4.6) 35.4 (10.6) 36.9 (10.3) % Energy from cho 52.3 (5.2) 51.3 (12.6) 51.2 (12.3) Fibre per 10 MJ 13.7 (3.8) 13.1 (10.1) 10.0 (6.3) Calcium per 10 MJ 1335.5 (361.4) 908.6 (567.7) 602.1 (462.1) Magnesium per 10MJ 282.4 (46.9) 249.8 (107.6) 222.3 (76.0) Phosphorous per 10MJ 1501.1 (265.8) 1273.8 (559.9) 1101.3 (468.3) Iron per 10 MJ 14.2 (4.6) 11.1 (11.6) 7.4 (4.1) Zinc per 10 MJ 9.7 (2.5) 8.8 (6.0) 6.9 (4.2) Vitamin E per 10 MJ 9.4 (6.7) 8.3 (6.9) 7.9 (7.7) Thiamin per 10 MJ 2.4 (3.2) 1.6 (1.3) 1.1 (0.8) Riboflavin per 10 MJ 2.9 (3.2) 1.7 (1.4) 1.0 (0.8) Vitamin B6 per 10 MJ 3.1 (3.3) 2.3 (1.8) 1.7 (0.9) Vitamin B12 per 10 MJ 6.7 (3.3) 5.1 (13.3) 2.9 (3.4) Folate per 10 MJ 355.4 (149.6) 236.3 (203.2) 164.4 (90.6) Vitamin C per 10 MJ 141.1 (107.4) 97.0 (208.5) 62.4 (96.9) Sodium per 10 MJ 3114.6 (673.8) 2820.6 (1642.4) 2481.1 (1506.1)
  • 7. Table 6.7 Energy and nutrient intakes (macronutrients as a percentage of energy, fibre and micronutrients per 10 MJ) from home, other people's home and outside the home in Irish children aged 5-12 years by sex Home Other home Out Mean (SD) Mean (SD) Mean (SD) Boys (n = 291) (n =159) (n = 212) Energy (kcal) 1530.0 (419.7) 169.7 (153.4) 187.7 (140.8) Energy (kJ) 6437.9 (1764.4) 713.3 (644.2) 788.6 (591.1) % Energy from protein 13.8 (2.3) 12.9 (6.9) 10.3 (5.6) % Energy from fat 32.9 (4.7) 34.9 (11.1) 36.5 (11.6) % Energy from cho 52.8 (5.4) 51.8 (13.1) 52.5 (14.4) Fibre per 10 MJ 13.8 (4.0) 13.5 (11.3) 9.8 (6.0) Calcium per 10 MJ 1345.6 (354.6) 924.9 (649.3) 536.6 (388.5) Magnesium per 10MJ 284.2 (50.1) 255.5 (124.9) 214.2 (74.5) Phosphorous per 10MJ 1514.9 (260.8) 1303.1 (624.3) 1039.5 (466.7) Iron per 10 MJ 14.7 (4.8) 11.7 (15.2) 7.0 (3.6) Zinc per 10 MJ 9.7 (2.6) 9.4 (6.6) 6.5 (4.3) Vitamin E per 10 MJ 9.4 (6.9) 7.8 (6.1) 8.2 (8.9) Thiamin per 10 MJ 2.3 (0.8) 1.7 (1.5) 0.9 (0.7) Riboflavin per 10 MJ 2.9 (1.0) 1.6 (1.5) 0.9 (0.7) Vitamin B6 per 10 MJ 3.0 (1.0) 2.2 (1.8) 1.7 (0.9) Vitamin B12 per 10 MJ 6.6 (2.8) 5.6 (18.2) 2.6 (2.6) Folate per 10 MJ 365.1 (146.0) 240.0 (242.9) 158.4 (93.1) Vitamin C per 10 MJ 130.9 (104.8) 99.3 (281.7) 54.0 (96.7) Sodium per 10 MJ 3090.9 (659.5) 2764.2 (1615.2) 2417.3 (1561.6) Girls (n = 303) (n = 190) (n = 247) Energy (kcal) 1328.3 (343.9) 171.4 (131.2) 183.5 (146.5) Energy (kJ) 5587.7 (1445.6) 720.3 (551.0) 771.0 (615.5) % Energy from protein 13.8 (2.3) 12.9 (6.8) 11.4 (5.0) % Energy from fat 33.9 (4.5) 35.8 (10.2) 37.3 (9.0) % Energy from cho 51.9 (5.1) 50.8 (12.2) 50.2 (10.2) Fibre per 10 MJ 13.5 (3.6) 12.8 (9.0) 10.2 (6.5) Calcium per 10 MJ 1325.7 (368.2) 894.9 (490.1) 658.1 (510.9) Magnesium per 10MJ 280.6 (43.5) 244.9 (90.5) 229.2 (76.7) Phosphorous per 10MJ 1487.9 (270.3) 1249.2 (499.8) 1154.2 (464.1) Iron per 10 MJ 13.7 (4.3) 10.5 (7.2) 7.6 (4.5) Zinc per 10 MJ 9.6 (2.4) 8.4 (5.4) 7.2 (4.1) Vitamin E per 10 MJ 9.4 (6.6) 8.7 (7.4) 7.6 (6.5) Thiamin per 10 MJ 2.5 (4.4) 1.6 (1.0) 1.1 (0.9) Riboflavin per 10 MJ 2.9 (4.4) 1.7 (1.3) 1.1 (1.0) Vitamin B6 per 10 MJ 3.2 (4.4) 2.4 (1.7) 1.8 (1.0) Vitamin B12 per 10 MJ 6.7 (3.7) 4.7 (6.8) 3.2 (4.0) Folate per 10 MJ 346.1 (152.7) 233.2 (163.1) 169.5 (88.3) Vitamin C per 10 MJ 150.8 (109.2) 95.0 (116.4) 69.5 (96.6) Sodium per 10 MJ 3137.4 (687.6) 2868.0 (1667.7) 2535.7 (1458.0)
  • 8. Table 6.8 Energy and nutrient intakes (macronutrients as a percentage of energy, fibre and micronutrients per 10 MJ) from home, other people's home and outside the home for Irish children of different age groups Home Other home Out Mean (SD) Mean (SD) Mean (SD) 5-8.9 years (n = 296) (n = 190) (n = 219) Energy (kcal) 1343.6 (351.1) 170.3 (137.7) 157.2 (106.6) Energy (kJ) 5652.3 (1475.1) 716.1 (578.6) 660.2 (447.7) % Energy from protein 13.9 (2.1) 12.5 (6.0) 11.1 (5.0) % Energy from fat 33.4 (4.5) 35.0 (10.3) 38.7 (8.9) % Energy from cho 52.3 (5.1) 52.0 (11.9) 49.3 (10.2) Fibre per 10 MJ 13.6 (3.6) 12.9 (10.4) 10.3 (5.9) Calcium per 10 MJ 1394.7 (370.0) 942.3 (614.3) 603.6 (454.7) Magnesium per 10MJ 283.8 (46.8) 246.4 (101.4) 222.6 (61.9) Phosphorous per 10MJ 1540.5 (260.9) 1260.4 (567.4) 1135.9 (495.3) Iron per 10 MJ 14.2 (4.5) 11.1 (14.0) 7.1 (3.2) Zinc per 10 MJ 9.6 (2.2) 8.3 (5.4) 6.7 (3.8) Vitamin E per 10 MJ 9.5 (6.7) 7.8 (6.3) 8.5 (7.8) Thiamin per 10 MJ 2.3 (0.8) 1.6 (1.1) 1.1 (0.7) Riboflavin per 10 MJ 2.9 (1.0) 1.7 (1.5) 1.0 (0.8) Vitamin B6 per 10 MJ 3.0 (1.0) 2.2 (1.6) 1.8 (0.9) Vitamin B12 per 10 MJ 6.8 (2.7) 5.8 (17.6) 2.9 (3.5) Folate per 10 MJ 361.0 (152.7) 240.0 (228.0) 169.6 (84.4) Vitamin C per 10 MJ 141.7 (89.5) 108.5 (266.9) 67.5 (106.5) Sodium per 10 MJ 3095.5 (643.8) 2811.5 (1732.2) 2649.7 (1604.0) 9 to 12.9 years (n = 298) (n = 158) (n = 240) Energy (kcal) 1510.1 (419.9) 171.0 (146.5) 211.2 (166.9) Energy (kJ) 6353.8 (1766.0) 718.4 (614.8) 887.6 (700.7) % Energy from protein 13.8 (2.5) 13.3 (7.6) 10.7 (5.5) % Energy from fat 33.4 (4.7) 35.8 (11.0) 35.3 (11.2) % Energy from cho 52.3 (5.4) 50.3 (13.4) 53.0 (13.8) Fibre per 10 MJ 13.7 (4.0) 13.4 (9.8) 9.7 (6.7) Calcium per 10 MJ 1276.7 (343.4) 868.1 (504.9) 600.7 (469.7) Magnesium per 10MJ 280.9 (46.9) 253.7 (114.8) 221.9 (87.1) Phosphorous per 10MJ 1462.1 (265.3) 1290.0 (552.2) 1069.7 (440.8) Iron per 10 MJ 14.2 (4.6) 11.0 (7.8) 7.6 (4.8) Zinc per 10 MJ 9.7 (2.7) 9.5 (6.6) 7.1 (4.5) Vitamin E per 10 MJ 9.3 (6.8) 8.9 (7.5) 7.3 (7.6) Thiamin per 10 MJ 2.5 (4.4) 1.6 (1.4) 1.0 (0.8) Riboflavin per 10 MJ 2.9 (4.4) 1.6 (1.3) 1.0 (0.9) Vitamin B6 per 10 MJ 3.2 (4.5) 2.4 (1.9) 1.7 (1.0) Vitamin B12 per 10 MJ 6.5 (3.8) 4.3 (3.9) 3.0 (3.4) Folate per 10 MJ 349.8 (146.6) 231.8 (169.3) 159.5 (95.8) Vitamin C per 10 MJ 140.5 (122.8) 83.1 (100.0) 57.7 (87.1) Sodium per 10 MJ 3133.6 (703.0) 2831.5 (1532.8) 2326.6 (1396.0)
  • 9. Table 6.9 Energy and nutrient intakes (macronutrients as a percentage of energy, fibre and micronutrients per 10 MJ) from locations outside the home (takeaway, restaurant, shop and other locations) in Irish children aged 5-12 years Takeaway Restaurant Shop Other (n = 288) (n = 157) (n = 182) (n = 134) Mean (SD) Mean (SD) Mean (SD) Mean (SD) Energy (kcal) 134.7 (94.0) 123.6 (73.4) 78.6 (69.1) 92.7 (92.0) Energy (kJ) 566.0 (394.6) 518.9 (307.2) 330.6 (290.6) 389.6 (386.3) % Energy from protein 12.9 (5.1) 13.3 (6.6) 5.5 (4.0) 7.9 (5.2) % Energy from fat 38.6 (7.4) 37.8 (9.2) 34.5 (16.2) 33.5 (13.4) % Energy from cho 47.7 (9.4) 48.4 (11.1) 58.4 (17.4) 57.2 (15.9) Fibre per 10 MJ 10.4 (5.5) 12.5 (7.9) 6.5 (6.8) 10.8 (9.5) Calcium per 10 MJ 563.2 (445.5) 631.9 (485.2) 629.8 (508.6) 690.7 (989.8) Magnesium per 10MJ 234.0 (61.5) 244.1 (76.6) 185.8 (115.2) 227.7 (137.2) Phosphorous per 10MJ 1235.7 (451.4) 1193.4 (453.2) 746.9 (451.7) 1038.9 (975.4) Iron per 10 MJ 8.1 (3.9) 8.7 (4.2) 5.7 (6.0) 7.6 (24.3) Zinc per 10 MJ 7.8 (4.6) 8.7 (5.5) 3.4 (2.6) 5.3 (4.3) Vitamin E per 10 MJ 8.2 (9.5) 7.1 (6.4) 7.1 (7.0) 10.6 (10.7) Thiamin per 10 MJ 1.2 (0.9) 1.3 (1.0) 0.8 (1.8) 0.8 (0.7) Riboflavin per 10 MJ 1.1 (0.8) 0.9 (0.6) 1.1 (1.0) 1.0 (1.3) Vitamin B6 per 10 MJ 2.1 (0.8) 2.2 (1.3) 0.9 (1.1) 1.1 (0.9) Vitamin B12 per 10 MJ 3.4 (3.7) 3.0 (3.4) 1.5 (1.9) 2.5 (5.0) Folate per 10 MJ 193.4 (82.3) 199.1 (111.2) 101.4 (131.4) 120.5 (101.3) Vitamin C per 10 MJ 47.1 (57.2) 72.5 (113.1) 85.0 (257.1) 80.9 (156.2) Sodium per 10 MJ 2978.3 (1496.9) 2447.4 (1448.4) 1673.8 (1824.9) 1990.8 (2208.3)
  • 10. Table 6.10 Energy and nutrient intakes (macronutrients as a percentage of energy, fibre and micronutrients per 10 MJ) from locations outside the home (takeaway, restaurant, shop and other locations) in Irish children aged 5-12 years by sex Takeaway Restaurant Shop Other Mean (SD) Mean (SD) Mean (SD) Mean (SD) Boys (n = 134) (n = 70) (n = 91) (n = 50) Energy (kcal) 136.6 (84.4) 132.9 (76.1) 88.3 (75.7) 80.0 (44.3) Energy (kJ) 573.8 (354.6) 557.6 (319.2) 371.3 (318.2) 336.2 (185.9) % Energy from protein 13.2 (5.4) 12.8 (7.0) 4.9 (3.0) 7.5 (5.1) % Energy from fat 38.8 (6.9) 39.5 (8.8) 33.7 (17.0) 31.8 (13.5) % Energy from cho 47.3 (9.7) 47.3 (11.6) 59.7 (17.7) 59.3 (16.5) Fibre per 10 MJ 10.3 (5.3) 12.5 (6.6) 6.1 (6.2) 10.8 (9.9) Calcium per 10 MJ 552.8 (464.5) 527.3 (372.1) 626.0 (569.9) 522.6 (505.4) Magnesium per 10MJ 235.4 (59.0) 247.1 (70.0) 171.7 (96.8) 203.9 (96.7) Phosphorous per 10MJ 1257.8 (485.5) 1141.1 (436.9) 718.0 (442.8) 848.5 (481.7) Iron per 10 MJ 8.1 (3.0) 8.6 (4.4) 5.5 (6.8) 5.9 (4.8) Zinc per 10 MJ 8.1 (4.5) 8.4 (6.4) 3.1 (2.3) 4.6 (3.3) Vitamin E per 10 MJ 8.9 (10.8) 6.6 (6.4) 7.1 (6.7) 10.0 (10.7) Thiamin per 10 MJ 1.2 (0.8) 1.2 (0.8) 0.6 (0.9) 0.7 (0.6) Riboflavin per 10 MJ 1.0 (0.7) 0.9 (0.6) 1.1 (1.1) 0.8 (0.8) Vitamin B6 per 10 MJ 2.1 (0.8) 2.2 (1.3) 0.9 (1.2) 1.0 (0.9) Vitamin B12 per 10 MJ 3.4 (3.4) 3.0 (3.6) 1.4 (2.0) 1.9 (2.8) Folate per 10 MJ 199.7 (86.0) 193.3 (100.8) 93.2 (156.0) 111.5 (102.0) Vitamin C per 10 MJ 42.4 (50.3) 57.3 (73.2) 66.3 (280.9) 76.7 (136.7) Sodium per 10 MJ 3040.0 (1584.9) 2450.3 (1562.0) 1499.0 (1550.0) 1892.7 (1904.9) Girls (n = 154) (n = 87) (n = 91) (n = 84) Energy (kcal) 133.0 (101.9) 116.2 (70.8) 69.0 (60.8) 100.6 (111.3) Energy (kJ) 559.2 (427.4) 487.7 (295.3) 289.9 (255.4) 422.6 (467.5) % Energy from protein 12.6 (4.9) 13.8 (6.3) 6.1 (4.8) 8.2 (5.2) % Energy from fat 38.5 (7.8) 36.4 (9.3) 35.2 (15.5) 34.4 (13.4) % Energy from cho 48.0 (9.2) 49.3 (10.8) 57.1 (17.0) 56.0 (15.6) Fibre per 10 MJ 10.4 (5.7) 12.4 (8.9) 6.9 (7.4) 10.8 (9.3) Calcium per 10 MJ 572.2 (429.6) 716.0 (547.6) 633.7 (442.0) 790.8 (1179.7) Magnesium per 10MJ 232.8 (63.7) 241.7 (81.8) 199.9 (130.0) 241.9 (155.2) Phosphorous per 10MJ 1216.5 (420.2) 1235.6 (464.1) 775.8 (461.1) 1152.2 (1163.1) Iron per 10 MJ 8.1 (4.6) 8.8 (4.1) 5.9 (5.1) 8.7 (30.5) Zinc per 10 MJ 7.6 (4.7) 8.9 (4.6) 3.8 (2.8) 5.8 (4.8) Vitamin E per 10 MJ 7.6 (8.2) 7.5 (6.4) 7.2 (7.4) 11.0 (10.8) Thiamin per 10 MJ 1.2 (0.9) 1.5 (1.1) 1.0 (2.4) 0.9 (0.7) Riboflavin per 10 MJ 1.1 (0.9) 1.0 (0.7) 1.1 (0.9) 1.1 (1.6) Vitamin B6 per 10 MJ 2.0 (0.8) 2.2 (1.3) 0.9 (1.0) 1.2 (1.0) Vitamin B12 per 10 MJ 3.4 (3.9) 3.0 (3.2) 1.6 (1.9) 2.9 (5.9) Folate per 10 MJ 188.0 (78.8) 203.8 (119.3) 109.5 (101.3) 125.8 (101.0) Vitamin C per 10 MJ 51.2 (62.4) 84.7 (136.3) 103.7 (231.0) 83.4 (167.5) Sodium per 10 MJ 2924.5 (1419.0) 2445.0 (1359.3) 1848.7 (2057.4) 2049.2 (2379.7)
  • 11. Table 6.11 Energy and nutrient intakes (macronutrients as a percentage of energy, fibre and micronutrients per 10 MJ) from locations outside the home (takeaway, restaurant, shop and other locations) in Irish children by age group Takeaway Restaurant Shop Other Mean (SD) Mean (SD) Mean (SD) Mean (SD) 5-8.9 years (n = 144) (n = 72) (n = 84) (n = 64) Energy (kcal) 110.8 (65.6) 112.2 (69.6) 56.5 (47.0) 88.1 (61.7) Energy (kJ) 465.8 (275.9) 470.2 (289.9) 237.5 (197.5) 370.5 (259.6) % Energy from protein 13.4 (5.4) 12.7 (6.2) 5.9 (4.6) 7.3 (4.1) % Energy from fat 39.2 (7.0) 38.9 (9.2) 36.7 (16.8) 34.0 (13.1) % Energy from cho 46.8 (8.8) 47.8 (11.2) 55.2 (17.8) 57.3 (14.7) Fibre per 10 MJ 10.3 (5.1) 11.7 (7.1) 7.9 (7.9) 10.8 (9.3) Calcium per 10 MJ 567.9 (452.3) 662.1 (510.7) 614.7 (423.0) 568.3 (753.2) Magnesium per 10MJ 236.7 (57.5) 230.6 (65.8) 197.4 (130.7) 209.0 (99.1) Phosphorous per 10MJ 1310.4 (499.5) 1166.7 (487.3) 763.9 (494.8) 856.9 (615.8) Iron per 10 MJ 7.8 (3.4) 7.8 (3.6) 6.2 (5.4) 5.1 (3.4) Zinc per 10 MJ 7.7 (4.4) 7.9 (5.1) 3.7 (2.9) 4.4 (3.0) Vitamin E per 10 MJ 8.6 (9.6) 7.9 (6.9) 7.6 (7.0) 11.2 (10.9) Thiamin per 10 MJ 1.2 (0.8) 1.3 (0.9) 1.0 (2.6) 0.8 (0.7) Riboflavin per 10 MJ 1.0 (0.7) 1.0 (0.6) 1.2 (1.0) 0.8 (1.3) Vitamin B6 per 10 MJ 2.1 (0.8) 2.1 (1.3) 1.0 (1.1) 1.2 (1.1) Vitamin B12 per 10 MJ 3.4 (4.0) 2.9 (3.1) 1.5 (2.0) 2.1 (4.9) Folate per 10 MJ 193.1 (76.2) 198.1 (111.7) 116.9 (150.0) 120.0 (104.8) Vitamin C per 10 MJ 46.5 (57.5) 81.1 (147.5) 114.2 (343.0) 93.3 (170.2) Sodium per 10 MJ 3097.6 (1581.0) 2518.9 (1544.7) 1904.6 (2220.4) 1700.8 (1561.1) 9 to 12.9 years (n = 144) (n = 85) (n = 98) (n = 70) Energy (kcal) 158.5 (110.8) 133.3 (75.6) 97.6 (79.0) 96.8 (112.6) Energy (kJ) 666.2 (465.0) 560.1 (316.9) 410.4 (332.0) 406.5 (472.5) % Energy from protein 12.3 (4.8) 13.8 (6.9) 5.2 (3.3) 8.6 (6.0) % Energy from fat 38.0 (7.7) 36.8 (9.1) 32.6 (15.5) 32.9 (13.8) % Energy from cho 48.6 (10.0) 48.9 (11.1) 61.1 (16.6) 57.2 (17.0) Fibre per 10 MJ 10.5 (5.8) 13.1 (8.5) 5.4 (5.5) 10.8 (9.8) Calcium per 10 MJ 558.4 (440.1) 606.3 (464.0) 642.8 (573.8) 802.6 (1159.2) Magnesium per 10MJ 231.3 (65.3) 255.6 (83.4) 175.9 (99.6) 244.8 (163.4) Phosphorous per 10MJ 1161.1 (385.0) 1216.1 (423.8) 732.3 (413.3) 1205.2 (1195.4) Iron per 10 MJ 8.4 (4.3) 9.5 (4.5) 5.2 (6.5) 9.9 (33.5) Zinc per 10 MJ 7.9 (4.8) 9.3 (5.8) 3.3 (2.2) 6.2 (5.1) Vitamin E per 10 MJ 7.9 (9.5) 6.4 (5.9) 6.7 (7.1) 10.1 (10.6) Thiamin per 10 MJ 1.2 (0.9) 1.4 (1.1) 0.6 (0.8) 0.9 (0.7) Riboflavin per 10 MJ 1.1 (0.9) 0.9 (0.6) 1.1 (1.0) 1.1 (1.3) Vitamin B6 per 10 MJ 2.1 (0.8) 2.2 (1.3) 0.8 (1.2) 1.0 (0.8) Vitamin B12 per 10 MJ 3.5 (3.3) 3.1 (3.6) 1.5 (1.9) 2.9 (5.2) Folate per 10 MJ 193.7 (88.2) 200.0 (111.5) 88.1 (112.2) 120.9 (98.7) Vitamin C per 10 MJ 47.7 (57.1) 65.2 (72.5) 60.0 (146.0) 69.5 (142.6) Sodium per 10 MJ 2858.9 (1403.2) 2386.8 (1367.8) 1476.1 (1382.0) 2255.9 (2650.5)