Influencing the Mass Affluent Infographic
•
1 like•2,757 views

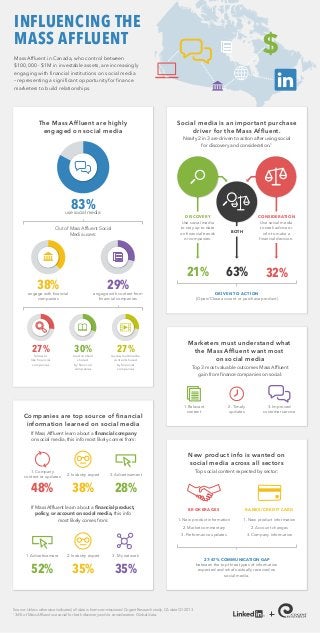
Mass Affluent in Canada, who control between $100,000 - $1M in investable assets, are increasingly engaging with financial institutions on social media – representing a significant opportunity for finance marketers to build relationships.

Recommended
More Related Content
Viewers also liked
Viewers also liked (7)
More from LinkedIn Canada
More from LinkedIn Canada (10)
Recently uploaded
Recently uploaded (20)
Influencing the Mass Affluent Infographic
- 1. INFLUENCING THE MASS AFFLUENT $ Mass Affluent in Canada, who control between $100,000 - $1M in investable assets, are increasingly engaging with financial institutions on social media – representing a significant opportunity for finance marketers to build relationships. The Mass Affluent are highly engaged on social media Social media is an important purchase driver for the Mass Affluent. Nearly 2 in 3 are driven to action after using social for discovery and consideration.1 83% use social media DISCOVERY Use social media to stay up to date on financial trends or companies. Out of Mass Affluent Social Media users: 38% 29% engage with financial companies 27% follow or like financial companies 21% read content shared by financial companies 27% review multimedia content shared by financial companies Companies are top source of financial information learned on social media BOTH Use social media to seek advice or info to make a financial decision. 63% 32% DRIVEN TO ACTION (Open/Close account or purchase product) engage with content from financial companies 30% CONSIDERATION Marketers must understand what the Mass Affluent want most on social media Top 3 most valuable outcomes Mass Affluent gain from finance companies on social: 1. Relevant content 2. Timely updates 3. Improved customer service If Mass Affluent learn about a financial company on social media, this info most likely comes from: New product info is wanted on social media across all sectors 1. Company content or updates 2. Industry expert 48% 38% Top social content expected by sector: 3. Advertisement 28% If Mass Affluent learn about a financial product, policy, or account on social media, this info most likely comes from: 35% 1. New product information 2. Account changes 3. Company information 3. My network 52% 1. New product information 3. Performance updates 2. Industry expert BANKS/CREDIT CARD 2. Market commentary 1. Advertisement BROKERAGES 35% Source: Unless otherwise indicated, all data is from commissioned Cogent Research study, CA data Q1 2013 1 36% of Mass Affluent use social for both discovery and/or consideration. Global data. 27-47% COMMUNICATION GAP between the top three types of information expected and what’s actually received on social media.