Infographic: IBM Sixth Annual US Online Retail Holiday Readiness Benchmark
•
7 likes•2,293 views

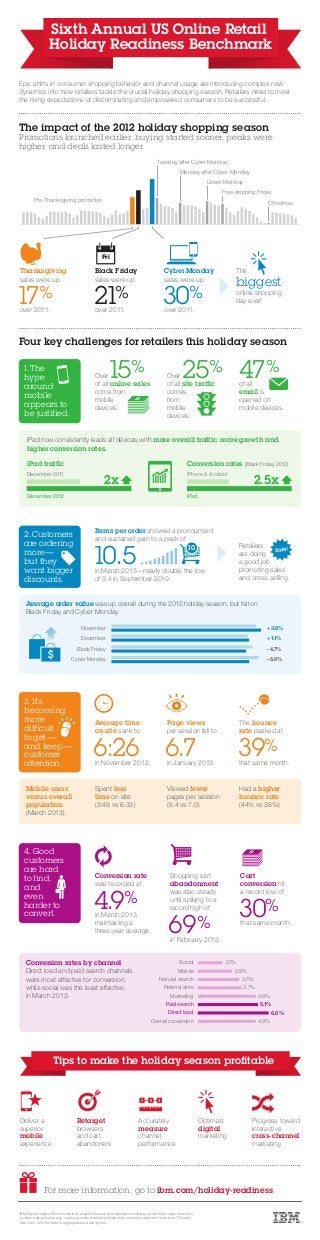
Epic shifts in consumer shopping behavior and channel usage are introducing complex new dynamics into how retailers tackle the crucial holiday shopping season. Retailers need to meet the rising expectations of discriminating and empowered consumers to be successful. Learn more at www.ibm.com/holiday-readiness
Recommended

Recommended
More Related Content
Recently uploaded
Recently uploaded (20)
Featured
Featured (20)
Infographic: IBM Sixth Annual US Online Retail Holiday Readiness Benchmark
- 1. $ $ November December Black Friday Cyber Monday Social Mobile Natural search Referral sites Marketing Paid search Direct load Overall conversion 2.1% 2.9% 3.5% 3.7% 4.9% 5.1% 6.0% 4.9% +3.6% +1.1% -4.7% -6.6% Epic shifts in consumer shopping behavior and channel usage are introducing complex new dynamics into how retailers tackle the crucial holiday shopping season. Retailers need to meet the rising expectations of discriminating and empowered consumers to be successful. The impact of the 2012 holiday shopping season Promotions launched earlier, buying started sooner, peaks were higher, and deals lasted longer. 3. It’s becoming more difficult to get— and keep— customer attention. Four key challenges for retailers this holiday season Thanksgiving sales were up 17% over 2011. Cyber Monday sales were up 30% over 2011. The biggest online shopping day ever! Black Friday sales were up 21% over 2011. Fri Average order value was up overall during the 2012 holiday season, but fell on Black Friday and Cyber Monday. Items per order showed a pronounced and sustained gain to a peak of 10.5in March 2013—nearly double the low of 5.4 in September 2010. Retailers are doing a good job promoting sales and cross-selling. 10 Average time on site sank to 6:26in November 2012. Page views per session fell to 6.7in January 2013. The bounce rate peaked at 39% that same month. Mobile users versus overall population (March 2013) Had a higher bounce rate (44% vs 38%) Spent less time on site (3:48 vs 6:33) Viewed fewer pages per session (5.4 vs 7.0) Sixth Annual US Online Retail Holiday Readiness Benchmark 4. Good customers are hard to find, and even harder to convert. Conversion rate was recorded at 4.9% in March 2013, maintaining a three-year average. Shopping cart abandonment was also steady until spiking to a record high of 69% in February 2013. Cart conversion hit a record low of 30% that same month. Conversion rates by channel Direct load and paid search channels were most effective for conversion, while social was the least effective, in March 2013. Deliver a superior mobile experience Retarget browsers and cart abandoners Accurately measure channel performance Optimize digital marketing Progress toward interactive cross-channel marketing Tips to make the holiday season profitable IBM Digital Analytics Benchmark is an analytics-based, peer-level benchmarking solution that tracks more than a million transactions a day, capturing online marketing results and commerce data from more than 700 retail web sites. All of the data is aggregated and anonymous. 1. The hype around mobile appears to be justified. 2.Customers are ordering more— but they want bigger discounts. $ $ $ Over 15% of all online sales come from mobile devices. Over 25% of all site traffic comes from mobile devices. 47% of all email is opened on mobile devices. December 2011 December 2012 iPhone & Android iPad iPad traffic Conversion rates (Black Friday 2012) 2x 2.5x iPad now consistently leads all devices with more overall traffic, more growth and higher conversion rates. For more information, go to ibm.com/holiday-readiness Pre-Thanksgiving promotion Monday after Cyber Monday Tuesday after Cyber Monday Green Monday Free-shipping Friday Christmas