Visualise your data
•Als PPTX, PDF herunterladen•
1 gefällt mir•512 views

An introduction to data presentation, manipulation and analysis techniques in Microsoft Excel. Session for undergraduate students as part of the Library's In The Zone programme. www.lancaster.ac.uk/library/in-the-zone/

Empfohlen
Weitere ähnliche Inhalte
Ähnlich wie Visualise your data
Ähnlich wie Visualise your data (20)
Mehr von Lancaster University Library
Mehr von Lancaster University Library (20)
Kürzlich hochgeladen
Kürzlich hochgeladen (20)
Visualise your data
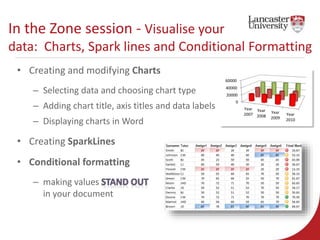
- 1. In the Zone session - Visualise your data: Charts, Spark lines and Conditional Formatting • Creating and modifying Charts – Selecting data and choosing chart type – Adding chart title, axis titles and data labels – Displaying charts in Word • Creating SparkLines • Conditional formatting – making values in your document 0 20000 40000 60000 Year 2007 Year 2008 Year 2009 Year 2010
- 2. • Sorting Data – simple sorting – multi-level sorting • Filtering - searching for data matching a specified criteria: – numerical filters – text filters – formatting filters • Subtotals In the Zone session: Sorting And Filtering
- 3. • Pivot Tables – analyze your data – summarize columns of data by cross referencing • Slicers – Quickly filter information on your pivot table • Pivot Charts – Creating and editing In the Zone session: Data Analysis with Pivot Tables and Pivot Charts
- 4. • Cell Referencing and Ranges – Relative, absolute, mixed – named cells and named ranges • Writing formulas: – + – - – * – / – Calculation order and ( ) • Functions and Formulas • IF and COUNTIF In the Zone session: Using Formulas and Ranges
- 5. Excel online learning links: www.lancaster.ac.uk/iss/training/elearning/ Download handouts and a practice files from www.lancaster.ac.uk/iss/training/materials/office/ MOS e-books and practice files www.lancaster.ac.uk/iss/training/materials/office/mos-ebooks/ On the ISS Training web site: