Pesticide Application Air Quality Emissions Inventory Project

For more: http://www.extension.org/67678 Crops grown in this region total more than 140 million acres and are routinely treated with pesticide products, such as herbicides, insecticides, and fungicides. Row crops, such as corn, soybeans, and sorghum and non-row crops, such as fruit orchards, were included in the work. Hazardous air pollutants (HAPs) and/or volatile organic compounds (VOCs) are in pesticide ingredients; VOCs being a main contributor to ground-level ozone, commonly known as smog. In this work, 458 active ingredient-specific VOC emission factors were developed, based primarily on empirically derived pesticide chemical data maintained by the California Department of Pesticide Regulations; county level active ingredient throughputs were derived from the best available information.
Recommended

Recommended
More Related Content
Similar to Pesticide Application Air Quality Emissions Inventory Project
Similar to Pesticide Application Air Quality Emissions Inventory Project (20)
More from LPE Learning Center
More from LPE Learning Center (20)
Recently uploaded
Recently uploaded (20)
Pesticide Application Air Quality Emissions Inventory Project
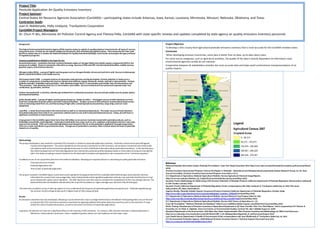
- 1. Project Title: Pesticide Application Air Quality Emissions Inventory Project Sponsor: Central States Air Resource Agencies Association (CenSARA) – participating states include Arkansas, Iowa, Kansas, Louisiana, Minnesota, Missouri, Nebraska, Oklahoma, and Texas Contractor leads: Juan A. Maldonado, Holly Lindquist, TranSystems Corporation CenSARA Project Managers: Dr. Chun-Yi Wu, Minnesota Air Pollution Control Agency and Theresa Pella, CenSARA with state-specific reviews and updates completed by state agency air quality emissions inventory personnel Background The Federal Environmental Protection Agency (EPA) requiresstates to submit air quality emission inventoriesfor all types of sources every three years. If states do not submit categorical inventories,EPA will determine default values. The inventoriesare then used by EPA to assess risks as it reviews the National Ambient Air Quality Standards(NAAQS),track trends,and analyze the type and level of regulatoryprograms. Congressestablishedsix NAAQS in the Clean Air Act: Ground-levelozone - created by chemical reactions between oxides of nitrogen (NOx) and volatile organic compounds(VOC) in the presenceof sunlight. Ozone is commonly referred to as smog. Sourcesof NOx and VOC includeindustrialfacilities, mobile sources, gasoline vapors, and chemical solvents. Nitrogen oxides (NOx) - a group of highly reactive gasses such as nitrogen dioxide, nitrousacid and nitric acid. Sources includepower plants,industrialfacilities, and mobile sources. Particulatematter (PM) - a complex mixture of extremely small particles and liquid droplets.Particle pollution is made up of a numberof components,includingacids (such as nitrates and sulfates), organic chemicals, metals, and soil or dust particles. Particle pollution includes"inhalable coarse particles," with diameters larger than 2.5 micrometers and smaller than 10 micrometers and "fine particles," with diameters that are 2.5 micrometers and smaller. Sourcesinclude dust from paved and unpavedroads, fuel combustion, ag activities, and fires. Carbon monoxide (CO)- a colorless, odorless gas emitted from combustion processes. Sources include mobile sources,power plants, and industrialfacilities. Sulfurdioxide (SO2) - a group of highly reactive gasses known as “oxides of sulfur.” The largest sources of SO2 emissions are from fossil fuel combustion at power plants and other industrialfacilities. Smaller sourcesof SO2 emissions include industrialprocesses such as extracting metal from ore, and the burningof high sulfur containingfuels by locomotives, large ships, and non-road equipment. Lead (Pb) - a metal found naturallyin the environment as well as in manufacturedproducts. The major sourcesof lead emissions have historically been from fuels in on-road motor vehicles (such as cars and trucks)and industrialsources. Today, aircraft fuel is a significant contributorto lead emissions. Cropsgrown in the CenSARA region total more than 140 million acres and are routinely treated with pesticideproducts,such as herbicides,insecticides,and fungicides. Crop types includeboth row crops,such as corn, soybeans,and sorghumand non-rowcrops, such as fruit orchards. VOCs are in pesticide ingredientsand released to the air as the pesticideis applied or throughevaporation. VOCs are a main contributorto ground-levelozone. Though use of pesticidesis common, little is known about the level of pesticide impacts on air quality. Methodology This project developed a new method to estimate VOC emissions in relation to pesticide application activities. Pesticides contain active (pest killing)and inactive(inert)ingredients. The active ingredients are the primary contributors to VOC emissions, but emissions inventories were historically calculatedon both active and inactive ingredients because of a lack of definitiveinformationabout pesticide formulations. In the last few years, the CaliforniaDepartmentof Pesticide Regulations has maintaineda pesticide profiles database based on informationof products intended for sale in the State, providinga research baseline for the pesticide formulationand applicationrate components of our “emissions equation.” In addition to use of non-proprietarydata from the Californiadatabase, followingare importantfactors in calculatingair quality pesticide emissions: • Crop type and acres treated • Pesticide applicationrate • Time of year of pesticide application This project resulted in CenSARA region county level active ingredientthroughputs derived from available USDA National AgricultureStatistics Services informationfor county-levelcrop acreage data, state-level pesticide active ingredientapplicationrates by crop, and state-level fractionof crop- acres treated with a given active ingredient. The 2007 Ag Census was then used to compare the completeness of the crop average data set. The NationalPesticide Use Database maintainedby the Crop Life Foundation or region averages was utilized to help fill data gaps. The work also included a survey of state ag experts to try to understand the frequency of pesticide applications during the year. Pesticides applied during the summer months will generallyresult in higher levels of VOCs being emitted. Results An emissions calculationtool was developed, following a county-levellinear crop to acreage relationshipas the default. Participatingstates can use the tool to improve their 2011 and future emissions inventories by applying updated informationabout local practices such as the selection of crops and/or the choice of pesticide products, as well as the extent and amount of pesticide applications. In general, the selection of crops has a significant effect on the intensity of VOC emissions. For instance, VOC emission intensity is substantially lower in Oklahoma—wherewheat is dominant—thanin neighboring states where corn and soybeans are the major crops. Project Objective To develop a 2011 county-level agricultural pesticide emissions inventory that is more accurate for the CenSARA member states. Conclusion When developing emission inventories, some data is better than no data; up-to-date data is best. For some source categories, such as agriculture activities, the quality of the data is heavily dependent on information state environmental agencies usually do not maintain. Cooperation between all stakeholders provides the most accurate data and helps avoid unintentional misrepresentations of air quality impacts. References National Pesticide Information Center; Pesticide Formulations: Topic Fact Sheet; December 1999; http://www.npic.orst.edu/factsheets/formulations.pdf (accessed March 2013). Emission Inventory Improvement Program; Volume III: Chapter 9. Pesticides –Agricultural and Nonagricultural; prepared by Eastern Research Group, Inc. for Area Sources Committee, Emissions Inventory Improvement Program; June 2001; p 9.5-3. U.S. Department of Agriculture, National Agricultural Statistics Service; Agricultural Chemical Usage Reports; http://www.nass.usda.gov/Statistics_by_Subject/Environmental/index.asp(accessed May 2012). Spurlock, Frank; Methodology for Determining VOC Emission Potentials of Pesticide Products; California Department of Pesticide Regulation; Memorandum addressed to John Sanders; January 2002. Spurlock, Frank; California Department of Pesticide Regulation; Email correspondence with Holly Lindquist of TranSystems dated July 13, 2012; File name: holly_product_EP_data_chemcodes.xls. Segawa, Randy; Pesticide Volatile Organic Compound Emission Inventory; California Department of Pesticide Regulation; October 2008; http://www.cdpr.ca.gov/docs/emon/vocs/vocproj/meeting/ppt_inventory_1008.pdf (accessed May 2013). U.S. Department of Agriculture; National Agricultural Statistics Service; Historical Crop Progress Data for 2011; http://usda.mannlib.cornell.edu/MannUsda/viewDocumentInfo.do?documentID=1048(accessed May 2013) U.S. Department of Agriculture; National Agricultural Statistics Service; 2007 Census of Agriculture (v. 1.2). Crop Life Foundation; “National Pesticide Use Database”; http://www.croplifefoundation.org/cpri_npud2002.html (accessed May 2012) Kirstin Thesing; Development of Emissions Inventory of Agricultural Equipment in All Texas Counties, Part Two, Final Report, Task 6; prepared by E.H. Pechan & Associates, Inc. for Peter A. Ogbeide, Texas Commission on Environmental Quality; Contract No. 582-7-84008; August 15, 2009. Maryland Department of the Environment; 2002 Base Year State Implementation Plan Emissions Inventory and Methodology for PM2.5 and Precursors; http://www.mde.state.md.us/assets/document/Air/WashCoSIP_2-29-08/Appendices/Appendix_A-1.pdf (accessed August 2012) Lynn Deahl; Kansas Department of Health & Environment; Email correspondence with Juan Maldonado of TranSystems dated July 24, 2012. U.S. Environmental Protection Agency; 2008 National Emissions Inventory Version 2 Technical Support Document; June 2012; http://www.epa.gov/ttnchie1/net/2008inventory.html