1. Gangming
Liang
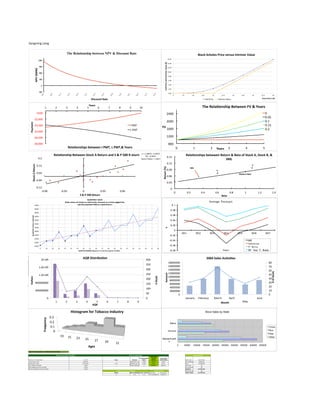
The Relationship between NPV & Discount Rate Black-‐Scholes
Price
versus
Intrinsic
Value
16.00
1200
Call
Price
and
Intrinsic
Value
($)
14.00
900
12.00
NPV
($MM)
10.00
600
8.00
300
6.00
4.00
0
2.00
-300
0.00
5
7.5
10
12.5
15
17.5
20
22.5
25
27.5
30
Stock
Price
S
($)
Discount
Rate
Call
Price
Intrinsic
Value
Years
1
2
3
4
5
6
7
8
9
10
The
Rela9onship
Between
FV
&
Years
-‐$500
2400
0
0.05
-‐$2,000
2000
0.1
Payment
-‐$3,500
I
PMT
0.15
FV
L
PMT
1600
0.2
-‐$5,000
-‐$6,500
1200
-‐$8,000
800
Rela9onships
between
I
PMT,
L
PMT,&
Years
0
1
2
Years
3
4
5
y
=
1.5807x
+
0.0075
Rela9onship
Between
Stock
A
Return
and
S
&
P
500
R
eturn
R2
=
0.5911
Rela9onships
betwwen
Return
&
Beta
of
Stock
A,
Stock
B,
&
0.2
0.15
Stock
A
Beta
=
1.5817
SML
0.12
Stock
A
Return
0.12
Return
(%)
SML
A
0.09
0.04
B
Market
Index
0.06
-‐0.04
0.03
-‐0.12
0
-‐0.06
-‐0.03
0
0.03
0.06
0
0.2
0.4
0.6
0.8
1
1.2
1.4
S
&
P
500
Return
Beta
QUARTERLY
SALES
(Data
values
are
shown
as
solid
circles,
forecasts
as
a
heavy
jagged
line,
Average Forecast
42000
and
the
projected
CMA
as
a
dashed
line.)
0.1
40000
0.08
38000
0.06
QUARTERLY
SALES,
$
MILLION
36000
34000
0.04
32000
0.02
30000
%
28000
0
2011 2012 2013 2014 2015 2016 2017
26000
-0.02
24000
-0.04 GNP
22000
Inflation
20000
-0.06
T- Bills
17
18
19
20
21
22
23
24
25
26
27
28
29
30
31
32
33
34
35
36
QUARTER
NUMBER
(Quarter
17
is
the
first
quarter
of
1995.)
-0.08 Years 30- Year T- Bonds
Sale
Year
2E+09
2004
AQR
Distribu9on
400
2004
Sales
Ac9vi9es
Data
Sale
Month Sum
of
Sales
($) Number
of
Deals Sale
Month Sum
of
Sales
($) Number
of
Deals 18000000
80
1 4,827,000 30 January 350
4,827,000
30
1.6E+09
2
3
8,797,000
15,824,036
40
67
February
March
8,797,000
15,824,036
40
67
16000000
70
4 8,672,692 42 April 300
8,672,692 42 14000000
60
#
of
Deals
5 5,575,000 27 May
5,575,000 27
12000000
Amount
Grand
Total 1.2E+09
6 8,042,000
51,737,728
42
248
June
250
8,042,000 42
50
10000000
#
Deals
Dollars
200
40
8000000
800000000
Statement of Cash Flow, For the Year Ended Dec. 31, 2004 ($ 000's) 150
6000000
30
Cash Flows from Operations
4000000
20
Net Income 44.22
100
Depreciation Expense
Change in Accounts Receivable
400000000
20.00
-50.80 2000000
10
Change in Inventories -120.80 50
0
0
Change in Accounts Payable 29.60
0
0
January
February
March
April
June
1
2
3
4
5
6
7
8
9
Month
May
AQR
Histogram
for
Tobacco
Industry
Stove Sales by State
0.3
Freqyency
0.2
Maine
0.1
Circle
0
Vermont Box
Star
19
21
West
23
25
Massachusett
27
29
s
31
0 50000 100000 150000 200000 250000 300000 350000 400000 450000
Ages
Cash Flow Projections - Utilities NOT Included
General Information (Flexible) Sq.Ft. & Lease Rates Cost Breakdown
Lease Rate
Total Leasable without Lease Rate
Total Sq. Ft. Constructed: 22,757 Floor Purpose Space Utilities with Utilities Hard Costs $5,120,325
Per SF Const. Cost: $225.00 1 Retail (Sq. Ft.) 3,000 $2.50 $2.65 5% Contingency HC $256,016
Construction Costs: $7,376,341 2 to 5 Residential (Sq. Ft.) 13,344 $4.00 $4.15 Land $2,000,000
Rent Inflation Estimate: 3.00% 1 Parking (Spaces) 12 $200.00 $200.00 Soft Costs $0
Fully-stabilized Income Cap Rate 4.50% 5% Contingency SC $0
Not fully stabilized Income Cap Rate 5.00% Subtotal $7,376,341
Building Completion Schedule Cost Breakdown Ramp-Up Cost Year 1 $0
Month Floors CompletedAvail. To Rent Hard Costs $5,120,325 Grand Total $7,376,341
12 1,2,3 1,2,3 5% Contingency HC $256,016