Weitere ähnliche Inhalte
Ähnlich wie Graham_FinalPoster
Ähnlich wie Graham_FinalPoster (20)
Graham_FinalPoster
- 1. RESEARCH POSTER PRESENTATION DESIGN © 2012
www.PosterPresentations.com
On both days of testing, participants were subject to the oculomotor portion of
the VNG assessment in addition to the spontaneous nystagmus assessment.
• Spontaneous Nystagmus: Focus on target for 10 seconds, then maintain
gaze without fixation for 5 seconds.
• Gaze Evoked Nystagmus: Focus on target presented 15o from midline for
10 seconds, then maintain gaze for 5 seconds without fixation. Repeat in
opposite direction.
• Saccades: Track 24 randomly presented targets which appear at either 5, 10,
20, -5, -10, or -20 degrees from midline.
• Smooth pursuit: Track at single target that passes repeatedly from left to
right at frequencies of .10, .30, and .50 Hz
• Optokinetic nystagmus (OKN): Track targets in the center of a full-field
presentation, moving at rates of 20, 40, and 60 deg/sec in both the clockwise
and counterclockwise directions.
Following completion of both test sessions, participants completed a caffeine
withdrawal assessment to evaluate the degree to which they experienced
seven of the most common symptoms of caffeine withdrawal.
Participants
15 participants
• 18-65 years of age
• Normal visual acuity or corrected with contact lenses
• No history of dizziness or balance disorders, seizure, tumors, multiple
sclerosis, or cardio vascular disorders
Caffeine Intake Assessment
Prospective participants documented their caffeine consumption over a three-
day time period and specified the type and amount of caffeine consumed.
Individuals who were found to consume, on average, between 200 mg and 900
mg of caffeine per day were eligible to participate in the study.
Data Collection
Participants were assigned to one of two groups:
• Group A: subject to oculomotor testing immediately after caffeine
consumption first, and once more after abstaining for 24 hours.
• Group B: tested after abstaining from caffeine for 24 hours first, and again
immediately after caffeine consumption.
Many vestibular testing centers require patients to abruptly abstain from
caffeine intake prior to testing, a recommendation which does not appear to be
evidence based. This study will examine the validity and necessity of this
practice by investigating the effects of caffeine consumption and caffeine
withdrawal on the oculomotor portion of the vestibular test battery, using
videonystagmography. Findings that are in opposition to current test protocol
trends may lead to the reevaluation of these protocols, which may be causing
undue discomfort and inconvenience to the potential patient, and may also
be negatively impacting test results.
Caffeine is the most commonly used psychoactive drug in the world and is
consumed daily by 85% of the United States population (Mitchell, Knight,
Hockenberry, Teplansky, & Hartman, 2014; Nehlig, Daval, & Debry, 1992).
Pharmacodynamically, caffeine has very positively reinforcing effects,
however regular and heavy caffeine users may experience negative
physical effects from abruptly abstaining from caffeine; this manifestation
of symptoms is referred to as caffeine withdrawal. The following symptoms
have been associated with caffeine withdrawal: headache, fatigue, decreased
energy/activeness, decreased alertness, drowsiness, decreased
contentedness, depressed mood, difficulty concentrating, irritability, and
foggy headedness (Juliano & Griffiths, 2004).
Caffeine withdrawal can occur after daily consumption of as little as 100 mg of
caffeine; however, withdrawal symptoms tend to be more intense and more
frequently reported with heavier caffeine use (Evans & Griffiths, 1999).
Symptoms begin to occur between 6 and 43 hours after abstaining, with peak
symptoms occurring around 24 hours (Ozsungur, Brenner, & El-Sohemy,
2009).
Investigating the effect of caffeine on oculomotor assessment is an important
undertaking because the tests of oculomotor function are known to be
influenced by fatigue and inattention, as well as certain drugs that the patient
may be taking (Jacobson & Shephard, 2008). It is useful to know how the
fatigue and inattention associated with caffeine withdrawal may affect test
results, as well as how caffeine consumption affects test results in regular
users.
Introduction and Background
Methods
Results
Conclusions
• For most measures of the VNG oculomotor assessment there is no
statistically significant difference in performance while under the
influence of caffeine and after 24 hours of abstention. On average, all
results fell within normal limits in both test conditions.
• Statistically significant differences were discovered for 40 deg/sec OKN
performance, however, these differences would not be considered to be
clinically significant.
• While 86% of participants reported experiencing caffeine withdrawal
symptoms of drowsiness/fatigue and 80% reported decreased alertness/
concentration, these symptoms do not appear to have had a clinically
significant impact on overall oculomotor assessment performance.
• The recommendation to have patients abstain from caffeine prior to VNG
assessment does not appear to be necessary as caffeine did not produce a
clinically significant effect on oculomotor performance in this study.
Abrupt abstention from caffeine, however, does cause unpleasant caffeine
withdrawal symptoms which can be a source of undue stress for the potential
patient; these symptoms do not appear to significantly impact oculomotor
test performance.
References
-Evans, S. & Griffiths, R. (1999). Caffeine withdrawal: A parametric analysis of caffeine dosing
conditions. The Journal of Pharmacology and Experimental Therapeutics, 289(1), 285-294.
-Jacobson, G., & Shepard, N. (2008). Balance function assessment and management. San Diego, CA:
Plural Pub.
-Juliano, L.M. & Griffiths, R.R. (2004). A critical review of caffeine withdrawal: empirical validation
of symptoms and signs, incidence, severity, and associated features. Psychopharmacology, 176, 1-29.
-Mitchel, D.C., Knight, C.A., Hockenberry, J., Teplansky, R., & Hartman, T.J. (2014). Beverage
caffeine intakes in the U.S. Food and Chemical Toxicology, 63, 136-142.
-Nehlig, A., Daval, J., & Debry, G. (1992). Caffeine and the central nervous system: Mechanisms of
action, biochemical, metabolic and psychostimulant effects. Brain Research Reviews, 17, 139-170.
-Ozsungur, S., Brenner, D., El-Sohemy, A. (2009). Fourteen well-described caffeine withdrawal
symptoms facts into three clusters. Psychopharmacology, 201, 541-548
Department of Hearing, Speech, and Language Sciences – Gallaudet University, Washington, DC
Krystyna N. Graham, M.S., and Chizuko Tamaki, Au.D., Ph.D
The Effect of Caffeine Withdrawal on VNG Oculomotor Assessment*
4.95
2.19
4.90
5.28
1.57
3.38
0.00
1.00
2.00
3.00
4.00
5.00
6.00
.10
Hz
.30
Hz
.50
Hz
Average
Velocity
Gain
Asymmetry
(%)
Target
Frequency
Caffeinated
vs.
AbstenIon
Smooth
Pursuit
Asymmetry
Caffeinated
Absten/on
Results
0.18
0.17
0.18
0.18
0.18
0.18
0.18
0.17
0.17
0.23
0.17
0.17
0.00
0.05
0.10
0.15
0.20
0.25
5
10
20
-‐5
-‐10
20
Average
Saccade
Latency
(sec)
Target
Movement
from
Midline
(Degrees)
Caffeinated
vs.
AbstenIon
Saccade
Latency
Caffeinated
Absten/on
*Approved by the Gallaudet Institutional Review Board (IRB)
Methods Results
Figure 1. Comparison of overall saccade accuracy at each degree of target displacement, with caffeine
and after abstention. Yellow circles indicate nearly statistical significant differences for the specified
parameter (p =.086 for 10 degrees, p =.063 for -5 degrees).
Figure 2. Comparison average saccade latency at each degree of target displacement, with
caffeine and after abstention. Yellow circle indicates a nearly statistically significant difference
for the specified parameter (p= .066 for -10 degrees).
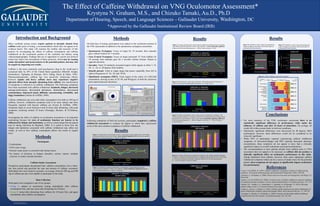
Figure 3. Average smooth pursuit velocity gain for rightward and leftward eye movements,
with caffeine and after abstention. Yellow circle indicates a nearly statistically significant
difference for the specified parameter (p =.089 for rightward gain at .10 Hz).
Figure 4. Smooth pursuit velocity gain asymmetry, with caffeine and after abstention, in
response to tracking sinusoidal targets presented at .10, .30, and .50 Hz.
Figure 6. Average velocity gain of optokinetic nystagmus, with caffeine and after abstention,
in response to clockwise and counterclockwise rotating stimuli presented at 20, 40, and 60 deg/
sec. Green circle indicates statistically significant difference for the specified parameter
(p = .041 for 40 deg/sec clockwise stimuli).
Figure 5. Graphic representation of the average velocity of optokinetic nystagmus, with
caffeine and after abstention, in response to clockwise and counterclockwise rotating stimuli
presented 20, 40, and 60 deg/sec. Green circles indicate statistically significant differences
for the specified parameters (p = .009 for 40 deg/sec clockwise; p = .013 for 40 deg/sec
counterclockwise).
22.71
37.63
40.27
20.26
32.85
35.53
23.43
34.18
37.53
17.40
29.63
33.41
0.00
5.00
10.00
15.00
20.00
25.00
30.00
35.00
40.00
45.00
20
Deg/Sec
40
Deg/Sec
60
Deg/Sec
20
Deg/Sec
40
Deg/Sec
60
Deg/Sec
Clock
Wise
S/mulus
Counterclockwise
S/mulus
Average
Velocity
(Deg/Sec)
Caffeinated
vs.
AbstenIon
OKN
Velocity
Caffeinated
Absten/on
1.00
0.85
0.60
1.00
0.81
0.58
0.75
0.55
0.75
0.57
0
0.2
0.4
0.6
0.8
1
1.2
20
Deg/Sec
40
Deg/Sec
60
Deg/Sec
20
Deg/Sec
40
Deg/Sec
60
Deg/Sec
Clock
Wise
S/mulus
Counterclockwise
S/mulus
Average
Velocity
Gain
Caffeinated
vs.
AbstenIon
OKN
Gain
Caffeinated
Absten/on
0.93
0.96
0.91
0.95
0.97
0.90
0.90
0.98
0.96
0.92
0.98
0.94
0.86
0.88
0.9
0.92
0.94
0.96
0.98
1
.10
Hz
.30
Hz
.50
Hz
.10
Hz
.30
Hz
.50
Hz
Gain
LeU
Gain
Right
Average
Velocity
Gain
Caffeinated
vs.
AbstenIon
Smooth
Pursuit
Velocity
Gain
Caffeinated
Absten/on
96.91
102.52
95.13
98.70
97.29
97.05
99.80
97.74
94.80
96.42
98.99
97.96
90.00
92.00
94.00
96.00
98.00
100.00
102.00
104.00
5
10
20
-‐5
-‐10
-‐20
Overall
Accuracy
(%)
Target
Movement
from
Midline
(Degrees)
Caffeinated
vs.
AbstenIon
Saccade
Accuracy
Caffeinated
Absten/on
0
2
4
6
8
10
12
14
16
Normal
Sqaurewave
Jerk
DriU
Normal
Sqaurewave
Jerk
DriU
Absten/on
Caffeinated
Total
Number
of
ParIcipants
QualitaIve
Finding
FixaIon
On
Spontaneous
Gaze
LeU
Gaze
Right
0
2
4
6
8
10
12
14
16
Normal
Sqaurewave
Jerk
DriU
Normal
Sqaurewave
Jerk
DriU
Absten/on
Caffeinated
Total
Number
of
ParIcipants
QualitaIve
Finding
FixaIon
Off
Spontaneous
Gaze
LeU
Gaze
Right
Figure 7a. Qualitative results of gaze and spontaneous
evoked nystagmus assessments with fixation light on,
caffeinated and after abstention.
Figure 7b. Qualitative results of gaze and spontaneous
evoked nystagmus assessments with fixation light off,
caffeinated and after abstention.
Figure 8. Caffeine withdrawal assessment responses.