Nepse Technical Analysis 7 June 2015 - 11 June 2015
•
0 gefällt mir•294 views

Nepse Weekly Technical Analysis 7 June 2015 - 11 June 2015

Empfohlen
Empfohlen
Weitere ähnliche Inhalte
Was ist angesagt?
Was ist angesagt? (20)
Andere mochten auch
Andere mochten auch (8)
Ähnlich wie Nepse Technical Analysis 7 June 2015 - 11 June 2015
Ähnlich wie Nepse Technical Analysis 7 June 2015 - 11 June 2015 (18)
Mehr von Kriti Capital & Investments Ltd.
Mehr von Kriti Capital & Investments Ltd. (20)
Kürzlich hochgeladen
Kürzlich hochgeladen (20)
Nepse Technical Analysis 7 June 2015 - 11 June 2015
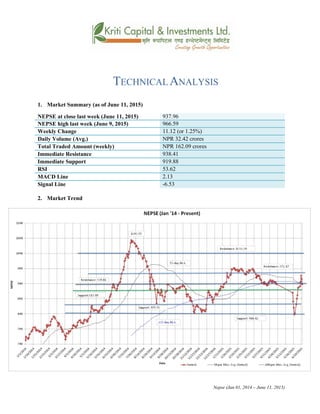
- 1. TECHNICAL ANALYSIS 1. Market Summary (as of June 11, 2015) NEPSE at close last week (June 11, 2015) 937.96 NEPSE high last week (June 9, 2015) 966.59 Weekly Change 11.12 (or 1.25%) Daily Volume (Avg.) NPR 32.42 crores Total Traded Amount (weekly) NPR 162.09 crores Immediate Resistance 938.41 Immediate Support 919.88 RSI 53.62 MACD Line 2.13 Signal Line -6.53 2. Market Trend Nepse (Jan 01, 2014 – June 11, 2015)
- 2. 3. RSI RSI is a form of leading indicator that is believed to be most effective during periods of sideways movement. Such indicators may create numerous buy and sell signals that are useful when the market is not clearly trending upwards or downwards. The RSI at the beginning of the week stood at 54.67 level. It was close to reach the 70 (overbought) zone in the middle of the week, as it ended at 64.22. This shows a buying pressure at the market during that particular period. Currently the RSI stands at 53.62 level. The trend shows that it has made a higher high than the previous peak. This indicates that it still might be heading towards the overbought zone. RSI (Jan 01, 2014 – June 11, 2015) 4. MACD The MACD is a momentum oscillator formed by using two different types of moving averages, which provides specific buying or selling signals. When a MACD line crosses above the signal line, it is considered to be a positive sign and indicates a time to buy, and vice-versa. As anticipated, the MACD Line has come out of the negative territory at the end of last week. Moreover, the crossover made by the Macd line over the signal line two weeks back shows a bullish trend, indicating that the bullish momentum is likely to continue over the coming days. Currently the Macd and Signal line stands at 2.13 and -6.53 respectively. MACD (Jan 01, 2014 – June 11, 2015) 5. Bollinger Bands The Bollinger Band is a technical indicator that consists of a moving average (21-day) along with two trading bands above (upper band) and below it (lower band). The bands are an indication of volatility, which are represented by calculating standard deviation.
- 3. The NEPSE index is hovering around the middle and upper Bollinger bands. This still indicates a bullish trend in the market. The gap between the upper and lower bands is still wide, indicating high market volatility. Bollinger Bands (Jan 01, 2014 – June 11, 2015) Overview: The NEPSE index surged most of last week. However, by the end of the week, it took a correction by losing most of what it had gained. Closing at 937.96, the index gained a total of 11.12 points (or 1.25%). The 50-day moving average is moving below the 200-day moving average. This shows that the overall outlook of the market does not look good. The average daily market volume soared last week to NPR 32.42 crores from NPR 25.90 crores the week prior. The RSI still stands at a neutral position, ending at 53.62 level. The Macd line has moved above the zero line, showing a bullish trend. The gap between the upper and lower Bollinger bands still suggests high market volatility. Although Nepse had surpassed its resistance level of 938.41, it fell below the level by the end of the week. Hence, its current support and resistance level stands the same at 919.88 and 938.41 respectively.
- 4. k|fljlwsljZn]if0f ahf/ ;f/f+z -h]i7@*, @)&@ ;Ddsf]_ aGb cªs -h]i7*, @)&@_ (#&=(^ pRr cªs -uPsf] ;ftf_ (^^=%( ;fKtflxs kl/jt{g !!=!@ -!=@%k|ltzt_ b}lgscf};t Jofkf/ ¿=#@=$@s/f]8 s'n ;fKtflxsJofkf/ ¿=!^@=)( s/f]8 tTsflng 6]jf (#*=$! tTsflngk|lt/f]w (!(=** cf/P;cfO{ %#=^@ PdP;L8L @=!# l;UgnnfO{g –^=%# बजारप्रवृित्त Nepse (Jan 01, 2014 – June 11,2015)
- 5. l/n]l6j :6«]Gy OG8]S; -cf/P;cfO{_ cf/P;cfO{ k|fljlwsljZn]if0fsf] o:tf] cf}hf/ xf], h;nfO{ Pstlkm{ ?kdfrln/x]sf] ahf/dfJofkf/ /0fgLlt agfpg a9L pkof]uL dflgG5 . To;}u/L, o;n] ahf/dfvl/b / ljlqmsf] :ki6 ;+s]t b]vfpg] u5{ . cf/P;cfO{n] ;ftfsf] z'?df %$=^&cªsdf /x]sf]lyof] . cf/P;cfO{ ;ftfsf] dWolt/ &) cªs -cf]e/ a6 hf]g_ sf] glhsk'uL ^$=@@ cªsnfO{ 5'g k'Uof] uof] h;n] Tof] ;do ahf/dflgs} lsGg] xf]8afhLsf] ;+s]t ub{5 . xfncf/P;cfO{ %#=^@ cªsdf /x]sf] 5 hf] uPsf] ;ftfeGbflgs} g} pRrxf] . clxn]sf] 6]G8«n] ahf/ ce} cf]e/a6sf l:]yltdf hfg ;Sg] ;+s]t ub{5 . RSI (Jan 01, 2014 – June 11, 2015) d'leª Pe/]hsGeh]{G; 8fOeh]{G; -PdP;L8L_ PdP;L8Ldf b'O{ cf]6f /]vf x'G5g, h;df Pp6fn] ahf/sf] lbzf kl/jt{gsf] ;+s]t u5{ eg] csf]{n] ahf/sf] k|j[lQ -6«]08_ b]vfpg] u5{ . olb PdP;L8L /]vfn] l;Ung /]vfnfO{ tnaf6 dfly sf6]dfo;nfO{ ;sf/fTds ;+s]tsf ?kdflnO{G5 / o;n] z]o/x? lsGg] ;+s]t ub{5 . PdP;L8L nfO{g ;f]r]sf] cg'?kC0ffTds If]qaf6 aflx/ lgSn]/ dflypSsn]sf] 5 . l;UgnnfO{gnfO{PdP;L8LnfO{g] sf6L dflypSsn]sf] cj:yfn] ahf/dfa'ln; 6]G8«sf] ;+s]t ub{5 / h'gcem} s]xLlbgrng ;Sg]5 . PdP;L8L nfO{g ;ftfsf] cGTolt/ @=!#dftyfl;UgnnfO{g –^=%#df /xguof] .
- 6. MACD (Jan 01, 2014 – June 11, 2015) af]lnªu/ Aof08 af]lnªu/ Aof08 Ps k|fljlwsljZn]if0f ;"rsxf] h;df @!–lbg] d'leËPe/]hsf ;fyb'O{ Aof08 -Pp6f dfly_ / Pp6f tn_ x'G5g . lo Aof08x?n] cl:y/tfsf] ;+s]t ub{5g, h'g :6fG88{ 8]leP;g u0fgf u/]/ kQfnufO{G5 . g]K;] kl/;"rsclxn] klgdWotyfpkNnf] Jof08sf] aLrdf g} /x]sf] 5 . h;n] ahf/dfa'ln; 6]«G8 /x]sf] ;+s]t ub{5 . pkNnf] tyftNnf] Jof08dfcem} w]/} b'/L /x]sf] cj:yfn] ahf/dfcl:y/tfcem} lgs} sfod /x]sf] 5 . Bollinger Bands (Jan 01, 2014 – June 11, 2015) ;du{dfM ;ftfsf] z'?df a9]sf] g]K;] kl/;"rscGTo km]l/ 36g uof] . ;ftfsf] cGTodf (#&=(^ cªsdfdf ;dfKtePsf] g]K;] kl/;"rsdfuPsf] ;ftfeGbf !!=!@cªssf] -!=@%Ü_ a[l4 /xof] . %)–lbg] d'leËPe/]hxfn@))–lbg] d'leËPe/]heGbftn /x]sf] cj:yfn] ahf/dfcl:y/tfcem} sfod /x]sf] ;+s]t ub{5 . cf};t sf/f]af/ /sddf ;d]t cl3Nnf] ;ftfeGbf j[l4 eO{ ?= #@=$@ s/f]8sf] sf/f]af/ eof]hf] cl3Nnf] ;ftf ?=@%=() s/f]8 /x]sf] lyof] . %#=^@ cªsdf /x]sf] cf/P;cfO{ xfn Go"6«n cj:yfdf/x]sf] 5 .
- 7. z"GonfO{g eGbfdfly r9]sf] PdP;L8LnfO{gn] ahf/dfa'ln; 6«]G8 /x]sf] ;+s]t ub{5 . pkNnf] tyftNnf] af]lnªu/ Jof08 aLrsf] b'/Ln] ahf/dfcem} lgs} g} cl:y/tf /x]sf] ;+s]t ub{5 . ;ftfsf] z'/dfk|lt/f]w cªskf/ u/]sf] g]K;] kl/;"rscGTodf ;f] eGbftn g} /xguof] . g]K;] kl/;"rsdfcfPsf] ;'wf/n]uPsf] ;ftfklg 6]jfcªs (!(=** cªs /xguPsf] 5 / k|lt/f]w cªs (#*=$! /x]sf] 5 .