2. 2
www.kinross.com
2
CAUTIONARY STATEMENT ON FORWARD-LOOKING
INFORMATION
All statements, other than statements of historical fact, contained or incorporated by reference in or made in giving this presentation, including but not limited to the
“Supplemental Information” slides and responses to questions, including but not limited to any information as to the future performance of Kinross, constitute “forward
looking statements” within the meaning of applicable securities laws, including the provisions of the Securities Act (Ontario) and the provisions for “safe harbour”
under the United States Private Securities Litigation Reform Act of 1995 and are based on expectations, estimates and projections as of the date of this presentation.
Forward-looking statements contained in this presentation include, but are not limited to, statements on slides with, and statements made under, the headings
“Compelling Opportunity”, “Enhances Our Portfolio”, “Good Fit With Kinross”, “Operating Estimates”, “Clear Sources of Upside Potential”, “South Area Mineral
Resources”, “Significant Exploration Opportunities”, “Upside Potential with Phase 7”, “Financial Discipline” and “Supplemental Information”, and statements with
respect to future estimates, forecasts and guidance and the realization of such thereof including but limited to the timing and amount of production; production costs
of sales, all-in cost of sales; capital expenditures; cash flow; mineral reserves and mineral resources; mine life, as well as references to other possible events
including, without limitation, opportunities, statements with respect to possible events or opportunities, such as continuous improvement initiatives; costs, timing and
potential of the development of projects and new deposits; exploration, development and mining activities; and project studies. The words “aim”, “believe”,
“contemplate”, “estimate”, “expect”, “flexibility”, “forecast”, “focus”, “forward”, “future”, “growth”, “initiative”, “model”, “objective”, “opportunity”, “optimize”, “path”,
“possible”, “potential”, “priority”, “pro-forma”, “project”, “prospective”, “risk”, “scoping”, “strategy”, “study”, “subject to”, “target”, “upside” or “view” or variations of such
words and phrases or statements that certain actions, events or results may, can, could, would, should, might, indicates, or will be taken, and similar expressions
identify forward looking statements. Forward-looking statements are necessarily based upon a number of estimates and assumptions that, while considered
reasonable by Kinross as of the date of such statements, are inherently subject to significant business, economic and competitive uncertainties and contingencies.
Statements representing management’s financial and other outlook have been prepared solely for purposes of expressing their current views regarding the
Company’s financial and other outlook and may not be appropriate for any other purpose. Many of these uncertainties and contingencies can affect, and could cause,
Kinross’ actual results to differ materially from those expressed or implied in any forward looking statements made by, or on behalf of, Kinross. There can be no
assurance that forward looking statements will prove to be accurate, as actual results and future events could differ materially from those anticipated in such
statements. All of the forward looking statements made in this presentation are qualified by these cautionary statements, and those made in our filings with the
securities regulators of Canada and the U.S., including but not limited to those cautionary statements made in the “Risk Factors” section of our most recently filed
Annual Information Form and the “Cautionary Statement on Forward-Looking Information” in our news release dated November 12, 2015, to which readers are
referred and which are incorporated by reference in this presentation, all of which qualify any and all forward‐looking statements made in this presentation. These
factors are not intended to represent a complete list of the factors that could affect Kinross. Kinross disclaims any intention or obligation to update or revise any
forward‐looking statements or to explain any material difference between subsequent actual events and such forward‐looking statements, except to the extent
required by applicable law.
Other information
Where we say "we", "us", "our", the "Company", or "Kinross" in this presentation, we mean Kinross Gold Corporation and/or one or more or all of its subsidiaries, as
may be applicable.
The technical information about Round Mountain and Bald Mountain (other than exploration activities) contained in this news release has been verified by Mr. John
Sims, an officer of the Company who is a “qualified person” within the meaning of National Instrument 43-101 (“NI 43-101”). The technical information about
exploration activities contained in this news release has been verified by Mr. Sylvain Guerard, an officer of the Company who is a “qualified person” within the
meaning of NI 43-101.
3. 3
www.kinross.com
3
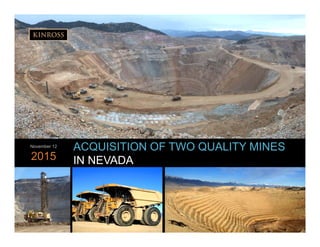
ACQUISITION OF QUALITY PRODUCING
MINES IN NEVADA
• Two quality producing mines in an excellent jurisdiction
• Enhances U.S. operating portfolio: adds production, mine life and projected free
cash flow, and lowers costs
• Clear upside potential at Bald Mountain and Round Mountain
• Maintains balance sheet strength: all cash transaction increases overall cash flow,
lowers costs and enhances credit metrics
4. 4
www.kinross.com
4
TRANSACTION OVERVIEW
TRANSACTION
DETAILS
• Kinross has agreed to acquire from Barrick:
100% of Bald Mountain
50% of Round Mountain
• Formation of a new 50/50 exploration joint venture at Bald Mountain
(outside of the Kinross 100%-owned mining areas which contain all of
currently reported mineral reserves and resources used to value the asset)
PURCHASE
PRICE
• US$610M cash
• 2% net smelter return royalty on future gold production exceeding 10
million ounces produced post-closing on lands 100% owned by Kinross
outside of the JV Zone
FINANCING • Cash on hand and available liquidity
CONDITIONS
• Clearance under U.S. Hart Scott Rodino Act (US Anti-Trust) and other
customary closing conditions
CLOSING • Expected by mid-January 2016
5. 5
www.kinross.com
5
ACQUISITION OF QUALITY PRODUCING MINES IN NEVADA
COMPELLING OPPORTUNITY
TWO QUALITY
PRODUCING MINES
• Adds production, forecasted near-term cash flow and increases average mine life in
Nevada, one of the world’s best mining districts
• Consolidates ownership of one of Kinross’ best-run and established mines
• Recent capital investments position Bald Mountain to be a low-cost producer
ENHANCES U.S.
OPERATING
PORTFOLIO
• Adds a combined 430koz. of expected average annual production(i) and is anticipated to
lower all-in sustaining costs
• Opportunity to leverage Kinross’ expertise and strong track record with open-pit heap leach
operations
CLEAR UPSIDE
POTENTIAL
• Multiple opportunities to increase mineral resource and mineral reserve estimates at Bald
Mountain, including known mineralization extensions at existing and previously-mined pits
• Large under-explored land package located on the southern extension of the
highly-prospective Carlin trend
• Opportunity to leverage Barrick’s knowledge and geologic expertise through exploration
partnership
• Increased exposure to ongoing operational improvements and optimization initiatives at
Round Mountain
MAINTAINS BALANCE
SHEET STRENGTH
• Proforma liquidity of $1.9B supports ongoing operations and capital programs
• All cash transaction increases overall cash flow, lowers costs and enhances credit metrics
Accretive on a number of key per share metrics, including production, cash flow, mineral
reserve and mineral resources
(i) Average for the period 2016-2018. Please refer to supplemental information provided on slides 20 – 21.
6. 6
www.kinross.com
6
1.9
6.5
0.3
0.9
US Portfolio Proforma
Measured & Indicated Inferred
3.2
5.2
US Portfolio Proforma
$697 $692
US Portfolio Proforma
701
1,092
US Portfolio Proforma
Note: Kinross US portfolio includes Fort Knox, Kettle River and Round Mountain (50%). Kinross’ proforma portfolio includes addition of Bald Mountain (100%) and Round Mountain (50%)
(i) Production and cash costs for the twelve months ended September 30, 2015
(ii) Based on "Production cost of sales/equivalent ounce sold" as reported by Kinross for all assets except for Bald Mountain, which is based on "cash costs" as reported by Barrick
LTM PRODUCTION(i)
(koz. Au Eq.)
LTM CASH COST(ii)
($/oz.)
RESERVES (1,2,3)
(Moz. Au)
RESOURCES (1,2,3)
(Moz. Au)
ENHANCES OUR PORTFOLIO
INCREASES U.S. OPERATING PRESENCE
Increased production and cash flow generation in Nevada
+56%
+62% +236%
Round
Mountain (50%)
Kettle River-
Buckhorn
Fort Knox
Existing U.S. Footprint Acquired Nevada Portfolio
Round Mountain
(50%)
Carlin Trend
Independence
TrendBattle Mtn.
Trend
Rabbit Creek
Trend
Bald Mountain
(1) Refer to endnote #1.
(2) Refer to endnote #2.
(3) Refer to endnote #3.
7. 7
www.kinross.com
7
QUALITY PRODUCING MINE IN NEVADA
BALD MOUNTAIN
GOOD FIT WITH KINROSS
• Open-pit run-of-mine heap leach operation
Opportunity to leverage Kinross’ expertise as a
world-class open-pit and heap leach operator
• Large estimated mineral resource base with multiple
sources of potential mineral reserve additions
• Excellent exploration potential with known targets and
additional brownfields and greenfields opportunities
SIGNIFICANT NEAR-TERM CASH FLOW FORECASTS
• Recent capital investment program expected to benefit
near-term production and all-in sustaining cost
Forecasting strong near-term cash flow with significant upside potential
8. 8
www.kinross.com
8
BALD MOUNTAIN
WELL-CAPITALIZED OPERATION
• Significant capital of approximately $385 million invested
over the past 5 years
New mobile equipment (electric shovels, haul
trucks and other heavy equipment)
Capitalized stripping and drilling
Heap leach pad
Truck shop
CIC plant
• Sustaining capital requirements expected to decline
post-2016 upon completion of current stripping campaign
Prior capital investments position mine to be a low-cost producer
(i) Does not include corporate overhead cost allocation, ARO accretion or sustaining exploration costs.
OPERATING ESTIMATES
2016 – 2018
Range
Remaining LOM
Range
Annual production (koz. Au Eq.) 175-300 150-180
Cash Costs ($/oz.) $450-$1,000 $560-$700
All-in Sustaining Cost ($/oz.)(i) $700-$1,130 $700-$900
9. 9
www.kinross.com
9
BALD MOUNTAIN
CLEAR SOURCES OF UPSIDE POTENTIAL
Multiple opportunities to increase mineral resource and mineral reserve estimates(3)
• Large, under-explored 600km2 land package
• NORTH ZONE: encompasses all of current mineral
reserve estimates and a portion of the mineral
resource estimate
• SOUTH ZONE: contains the remaining mineral
resource estimates
Claim boundary
~40km
~15km
North Zone
Kinross 100%
South Zone
Kinross
100%
JV Zone
(3) Refer to endnote #3.
10. 10
www.kinross.com
10
BALD MOUNTAIN
CLEAR SOURCES OF UPSIDE POTENTIAL
NORTH ZONE (100% Kinross)
• 40% of land package
• Estimated mineral resources over the active
mining areas remain open in multiple directions,
with drilling ending in mineralization
Claim boundary
~40km
~15km
North Zone
Kinross 100%
South Zone
Kinross
100%
JV Zone
Cross Section – Top Pit
(3) Refer to endnote #3.
Multiple opportunities to increase mineral resource and mineral reserve estimates(3)
11. 11
www.kinross.com
11
Claim boundary
~40km
~15km
North Zone
Kinross 100%
South Zone
Kinross
100%
JV Zone
SOUTH ZONE (100% Kinross)
• 20% of land package
• Estimated resources currently in the late stages
of permitting
• Additional potential for extensions as drill holes
end in mineralization – open in multiple directions
Cross Section – Vantage Pit
BALD MOUNTAIN
CLEAR SOURCES OF UPSIDE POTENTIAL
(3) Refer to endnote #3.
Multiple opportunities to increase mineral resource and mineral reserve estimates(3)
12. 12
www.kinross.com
12
BALD MOUNTAIN
CLEAR SOURCES OF UPSIDE POTENTIAL
• High percentage of estimated measured and
indicated mineral resources used in mine plan
EXAMPLES
• Mine plan conservatively assumes 20%
conversion of current estimated mineral resources
to mineral reserves upon receipt of permits and
modest infill drilling at Vantage located in the
South Zone (100% Kinross)
• Based on historical conversion rates, it also
assumes at least another 10% converted within
the remaining 100% owned areas
Claim boundary
~40km
~15km
North Zone
Kinross 100%
South Zone
Kinross
100%
JV Zone
(3) Refer to endnote #3.
Multiple opportunities to increase mineral resource and mineral reserve estimates(3)
13. 13
www.kinross.com
13
BALD MOUNTAIN
SIGNIFICANT EXPLORATION OPPORTUNITIES
Large, under-explored land package located on highly-prospective Carlin trend
• 600 km2 land package under-explored due to
competing capital requirements
One of the largest mine sites by area
in the U.S.
Numerous brownfield and greenfield
exploration targets
• Near-term exploration to focus on known
mineralization extensions of deposits in the
North and South Zones
JV ZONE (50/50 Kinross-Barrick)
• 40% of land package
• Opportunity to investigate under-explored land
package and leverage Barrick’s extensive
geologic knowledge and expertise
• Existing operations and currently estimated mineral
resources(3) are located outside of JV Zone
Claim boundaryResource Target
~15km
~40km
Winrock
Deep Top
LBM
Saga
Maverick
Rattlesnake
Dynasty
Vantage / North
Vantage
Yankee
JV Zone
>10gm
2-5gm
0.5-2gm
Grade x Thickness
5-10gm
(3) Refer to endnote #3.
14. 14
www.kinross.com
14
Consolidating ownership of one of Kinross’ best-run operations
QUALITY PRODUCING MINE IN NEVADA
ROUND MOUNTAIN
• Consistent annual outperformance driven by
best-in-class operating practices
• Continuous improvement programs benefiting
production and costs, with additional future
opportunities
UPSIDE OPPORTUNITIES WITH POTENTIAL
PHASE W
• Large zone of known mineralization exists at depth
and to the west of the main Round Mountain pit,
which is not currently included in Kinross’ mineral
reserve and resource estimates(i)
• Plan to initiate a scoping study in December 2015,
which will focus on rebuilding the mineral resource
model by incorporating new drilling information and
subsequent geologic interpretations to complete an
optimized mine plan
(i) As the material does not meet the economic or technical criteria required for inclusion in such classification. For more information regarding Round Mountain’s
estimated mineral reserves and mineral resources, please refer to endnotes #1 and #2.
15. 15
www.kinross.com
15
ROUND MOUNTAIN
CONTINUOUS IMPROVEMENT BENEFITS
PROCESS SOLUTION MANAGEMENT
• Ongoing, long-term continuous
improvement project
Better leach pad operation
Increasing recovery and recovery
timing
• Benefits contributing to increased
production and improved cost of sales
Achieving results from continuous improvement, with additional future opportunities
(i) Does not include corporate overhead cost allocation, ARO accretion or sustaining exploration costs.
81
97
116
Q1 2015 Q2 2015 Q3 2015
Koz.AuEq.
Production
STRONG OPERATING RESULTS (100%)
$890
$760
$687
Q1 2015 Q2 2015 Q3 2015
$/oz.AuEq.
Cost of Sales
OPERATING ESTIMATES
2016 – 2018
Range
Annual production (koz. Au Eq.) 340-430
Cash Costs ($/oz.) $820-$900
All-in Sustaining Cost ($/oz.)(i) $850-$1,000
16. 16
www.kinross.com
16
Technical expertise & experience successfully operating open-pit, heap leach mines
STRONG TRACK RECORD
DELIVERING OPERATIONAL EXCELLENCE
2012 2013 2014 YTD Q3 2015
MET or EXCEEDED annual
production guidance
MET or came in UNDER annual
cost of sales guidance
MET or came in UNDER annual
capital expenditures guidance
SUCCESSFULLY OPERATING IN A VARIETY OF CLIMATES AND GEOGRAPHIES
• Round Mountain, Nevada: operated by Kinross since 2003
• Fort Knox, Alaska: one of the world’s few cold climate heap leach operations
• Maricunga, Chile: high-altitude mine in the northern Andes
• Tasiast, Mauritania: run-of-mine heap leach in the Sahara desert
TRACK RECORD OF DELIVERING ON OUR OPERATIONAL COMMITMENTS
17. 17
www.kinross.com
17
MAINTAINING FINANCIAL FLEXIBILITY
• Significant proforma liquidity position of
$1.9B supports ongoing operations and
capital programs
• No near-term debt maturities after $250M
senior notes due in 2016
• Recently extended maturity of $1.5B credit
facility to 2020
FINANCIAL DISCIPLINE
MAINTAINS STRONG FINANCIAL POSITION
Maintaining balance sheet strength & financial flexibility remain priority objectives
NET DEBT / EBITDA (LTM)
2.9
2.6
1.9
1.4
1.3
1.2
0.6
Yamana Barrick Goldcorp Kinross Agnico Newmont Eldorado
Proforma(i)
Source: Bloomberg. Net debt and trailing twelve months Adjusted EBITDA as at September 30, 2015.
(i) Reflects the actual net debt to EBITDA ratio for Kinross as at September 30, 2015, adjusted for $610 million cash consideration paid to Barrick and the EBITDA for Bald Mountain
(100%) and the other 50% of Round Mountain (for the last 12 months).
18. 18
www.kinross.com
18
ACQUISITION OF QUALITY PRODUCING
MINES IN NEVADA
• Two quality producing mines in an excellent jurisdiction
• Enhances U.S. operating portfolio: adds production, mine life and projected free
cash flow, and lowers costs
• Clear upside potential at Bald Mountain and Round Mountain
• Maintains balance sheet strength: all cash transaction increases overall cash flow,
lowers costs and enhances credit metrics
20. 20
www.kinross.com
20
2016-2018
Range
Remaining
LOM Range
Tonnes processed (Mt) 13-19 10-13
Production (koz. Au. Eq.) 175-300 150-180
Cash cost ($/oz.) 450-1,000 560-700
AISC ($/oz.)(ii) 700-1,130 700-900
Sustaining capex ($M/yr) 20-60 10-20
Development capex ($M/yr) 5-70 0
OPERATING ESTIMATES
SUPPLEMENTAL INFORMATION
BALD MOUNTAIN (100%)
TONNES
(thousands)
GRADE
(g/t)
OUNCES
(thousands)
2P Reserves 60,477 0.70 1,361
M&I Resources 206,947 0.63 4,160
Inferred Resources 29,687 0.48 461
2014 GOLD RESERVE AND RESOURCE(3)
Tax
Kinross expects to remain an Alternative
Minimum Tax (“AMT”) payer (20% tax rate)
Recovery 72.5%
Depletion (YTD)(i) 176 koz. (6.8Mt @ 0.8g/t)
OTHER NOTES
(i) As at September 30, 2015
(ii) Does not include corporate overhead cost allocation, ARO accretion or sustaining
exploration costs. Current average cash cost estimates of $870/oz. (2016-2018)
expected to decline as a result of ongoing operational improvements and optimization
(3) Refer to endnote #3.
Our mine plan conservatively assumes 20% conversion of current estimated mineral
resources to mineral reserves upon receipt of permits and modest infill drilling at
Vantage in the South 100% owned area, and based on historical conversion rates at
least another 10% converted within the remaining 100% owned areas.
21. 21
www.kinross.com
21
2016-2018
Range
Tonnes processed (Mt) 19-24
Production (koz. Au. Eq.) 340-430
Cash cost ($/oz.) 820-900
AISC ($/oz.)(ii) 850-1,000
Sustaining capex ($M/yr) 25-50
Development capex ($M/yr) 0-7
SUPPLEMENTAL INFORMATION
ROUND MOUNTAIN (100%)
TONNES
(thousands)
GRADE
(g/t)
OUNCES
(thousands)
2P Reserves 54,600 0.79 1,378
M&I Resources 47,536 0.58 880
Inferred Resources 15,722 0.51 260
2014 GOLD RESERVE AND RESOURCE(2)
(i) As at September 30, 2015
(ii) Does not include corporate overhead cost allocation, ARO accretion or sustaining
exploration costs
Tax
Kinross expects to remain an Alternative
Minimum Tax (“AMT”) payer (20% tax rate)
Recovery 77.4%
Depletion (YTD)(i) 303koz. (19.9Mt @ 0.47g/t)
OTHER NOTES
(2) Refer to endnote #2.
OPERATING ESTIMATES
22. 22
www.kinross.com
22
ENDNOTES
1) From Bald Mountain, the increase would be 1.4Moz. in estimated proven and probable mineral reserves, 4.1Moz. in
measured and indicated resources and 0.5Moz. in estimated inferred mineral resources. At Round Mountain, the
increase would be 0.7Moz. in estimated proven and probable mineral reserves, 0.4Moz. in estimated measured and
indicated resources and 0.1Moz. in estimated inferred mineral resources.
2) For more information regarding Kinross’ mineral reserves and mineral resources estimates, please refer to our
Annual Mineral Reserve and Mineral Resource Statement as at December 31, 2014 (including the notes to that
statement) contained in our news release dated February 10, 2015, which is available on our website at
www.kinross.com. As operator, Kinross’ estimated mineral reserves and resources on a 100% basis as at December
31, 2014 but as at such date declared only its 50% share.
3) For more information regarding Barrick’s mineral reserves and mineral resources estimates, please refer to its
Annual Mineral Reserve and Mineral Resource Statement as at December 31, 2014 (including the notes to that
statement) contained in Barrick’s news release dated February 18, 2015, which is available at www.barrick.com.