![[object Object],[object Object],[object Object],[object Object],[object Object],[object Object],[object Object],[object Object],[object Object],Review of Power Grid Vulnerability to Space Weather](data:image/gif;base64,R0lGODlhAQABAIAAAAAAAP///yH5BAEAAAAALAAAAAABAAEAAAIBRAA7)
Empfohlen
Weitere ähnliche Inhalte
Ähnlich wie Kappenman Linked In
Ähnlich wie Kappenman Linked In (20)
Kappenman Linked In
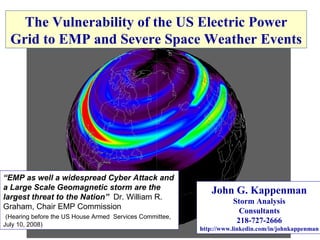
- 1. The Vulnerability of the US Electric Power Grid to EMP and Severe Space Weather Events John G. Kappenman Storm Analysis Consultants 218-727-2666 http://www.linkedin.com/in/johnkappenman “ EMP as well a widespread Cyber Attack and a Large Scale Geomagnetic storm are the largest threat to the Nation” Dr. William R. Graham, Chair EMP Commission (Hearing before the US House Armed Services Committee, July 10, 2008)
- 4. Historic Storm Impacts A Brief Overview of the Last Geomagnetic Superstorm and North American Power Grid Impacts March 13-14, 1989 This will provide some perspective on Potential Impacts from even larger Geomagnetic Storms and EMP Threats to this Critical Infrastructure
- 5. 5 minutes of storm conditions that precipitated the Quebec blackout A Quick Overview of the March 13-14, 1989 Geomagnetic Storm and North American Power Grid Impacts
- 6. 30 minutes of storm conditions later that day and impacts observed across the US A Quick Overview of the March 13-14, 1989 Geomagnetic Storm and North American Power Grid Impacts
- 8. Storms have Continent-Wide Footprints Field Disturbances from Electrojet Current Couple to Power Systems Geomagnetic Storms and Large Power Grids
- 9. Great Geomagnetic Storms March 1989 Superstorm & May 1921 Storm Comparisons Boundaries of Eastward Electrojet March 13, 1989 Position of Westward Electrojet
- 10. Great Geomagnetic Storms March 1989 Superstorm & May 1921 Storm Comparisons Estimated Boundaries of Eastward Electrojet for much larger May 14-15, 1921 Storm
- 11. EMP Effects Area – Fast Pulse EMP Threats to US Electric Grid Source: EMP Commission including an Executive Report
- 12. EMP Fast Pulse Exposure covers a total of 1765 substations exposed or ~83% of 2106 major HV and EHV substations. In addition some 35,000 to 40,000 Distribution Class Substations may also be of concern for Fast Pulse Exposure EMP Threats to US Electric Grid Major HV and EHV Substations
- 13. EMP Fast Pulse exposed power plants (Red) total 10,730 with a generation capacity that is ~74.4% of the U.S. total generation capability. EMP Threats to US Electric Grid Large Electric Generation Plants
- 15. Severe Geomagnetic Storm Disturbance Scenario Areas of Probable Power System Collapse Impacted Regions involve population of >130 Million Power System Disturbance and Outage Scenario of Unprecedented Scale
- 16. 365 Transformers At-Risk, ~300,000 MVA Rating ~Severe Storm Scenario has larger geographic footprint than all other Natural Hazards 33% 24% 55% 34% 17% 27% 18% 19% 47% 9% 21% 35% 30% 7% 7% 40% 1% 82% 97% 11% 7% 37% 39% 8% 17% 23% 24% 38% 12% 75% 55% 72% 6% 15% 32% 6% 26% 19% 36% 47% 30% Estimated that over 300 large EHV Transformers would have sufficient GIC exposure to be At-Risk of permanent damage & loss – replacement could extend into 4-10 years at current world production rates Severe Geomagnetic Storm Scenario At-Risk 345kV, 500kV & 765kV Transformers
Hinweis der Redaktion
- This animation provides a recreation of just 20 minutes of the geomagnetic storm events from 2:39-2:58 EST on March 13, 1989. It was during this time interval that the geomagnetic storm caused the Blackout to the entire Province of Quebec. As illustrated by this animation, storm activity was confined to very high latitudes (no population or infrastructures) and then it had a sudden onset and large geographic footprint of intense disturbances that developed along the US-Canada border. The speed and size of this onset is unlike traditional terrestrial weather threats that power grids are more commonly exposed to and better engineered to withstand. This animation shows the sequence of significant power grid impacts reported to NERC that developed due to the intense geomagnetic disturbances shown in the prior animation. As shown power system impacts were in the interconnected power grid along the US-Canada border. The most significant of these impacts was the complete Blackout to the Hydro Quebec grid and the entire Quebec province. They went from normal operating conditions to complete province-wide blackout in just 92 seconds. There was not even sufficient time available for system operators to even assess what was happening to the grid, let alone take any meaningful human intervention actions. For comparison purposes, it is important to note that the intensity of the disturbance over the Quebec region only reached ~500 nT/min, while data from historically larger storms indicate that intensities up to ~5000 nT/min are possible (10 times larger than this storm).
- This animation shows further intense geomagnetic storm conditions that happened later that day on March 13, 1989. The storm reached higher intensity levels and as a result it expanded to lower latitudes and as shown during this 50 minute time interval, the most intense storm activity is centered on mid-latitude portions of the US and at times has a continent-wide footprint. Also shown is even more intense activity that extends around the globe into northern Europe during this same time interval, clearly making this type of storm an event that can have a planetary reach. This animation shows the sequence of significant power grid events that again were reported to NERC. The NERC assessment of this storm concluded that major portions of the US Power grid came uncomfortably close to also experiencing a blackout of unprecedented scale. The area of blackout could have extended from the Wash DC area and surrounding mid-Atlantic states through the upper mid-west and even into the Pacific Northwest regions of the US. Again, these impacts were observed for intensities that generally were in the ~300 nT/min range, while very large storms could reach ~5000 nT/min in intensity.
- This is a picture of the Salem New Jersey Nuclear Plant GSU Transformer and permanent damage caused by the March 13, 1989 Geomagnetic Storm. The internal heating was so intense it melted portions of the low voltage windings of this transformer, windings and leads rated for ~3000 amps.
- As shown above, geomagnetic storms have a disturbance footprint that can easily span the continental US. These storms can cause multiple correlated failures that far exceed the traditional “N-1” design criteria used for the reliability design US Power Grid. The bottom illustration shows that large regional geomagnetic disturbance conditions arise due to a large electrojet current (multi-million amps) in the ionosphere at an altitude of ~100km due to the storm. Both a large eastward and westward electrojet current are created during storms and can span large portions of the planet as the storms increase in intensity. Rapid changes in the geomagnetic field can induce currents (geomagnetically-induced currents or GIC that is low frequency, ~near DC) that can flow into and out of the power grid through the neutral to ground connections of large EHV transformers. It is the flow of this GIC in the transformers that is the root-cause of all power system problems. EMP threat environments can also cause a geographically large geomagnetic field disturbance and lead to similar consequences to the exposed power grid.
- Illustration showing the large regions of geomagnetic field eastward and westward electrojet currents at time 22UT on March 13, 1989. This provides some perspective as we explore a comparison with even larger storms such as those in 1859, and as shown in the next slide May 1921, before power grids as we know them today existed.
- Data (in the form of strip charts) exists across North America for what many consider to be the largest geomagnetic storm of the 20 th Century. This historic data can be readily compared with the same data from the March 1989 storm to show not only the increase in intensity but also a dramatic increase in the geographic footprint of this large storm compared to the March 1989 storm. This comparative analysis indicates that not only is the 1921 storm as much as 4 to 10 times more intense than the March 1989 storm, but as shown by the white outlined areas, it would have an even larger geographic footprint that would extend across the entire continental US and it’s electric power grid.
- A high altitude nuclear burst can create both a Fast Pulse (E1) and a Slow Pulse (E3). This event can also have an extremely large geographic footprint which can expose a significant portion of the US Power Grid to potential damage from these threat environments. The E1 or Fast Pulse (footprint as shown above) produces an intense EM (electromagnetic field) with a fast rise-time (faster and more intense than lightning transients that power grids can also be exposed to). The E3 or slow pulse is a geomagnetic field disturbance similar to, but more intense than that produced by a severe geomagnetic storm.
- Both exposure to E1 and E3 pulses can impact EHV Substations. The E1 Pulse has the potential to damage sensitive electronic relay and control systems in each of these substations, while the E3 Pulse can produce large GIC’s that can trigger blackouts of the grid and damage EHV transformers. In addition, the E1 pulse has the potential to initiate multiple distribution line faults and permanently damage distribution line insulators due to the wide-spread and simultaneous exposure to lightning like pulse across the region.
- The E1 or fast pulse also has the potential to cause damage to sensitive electronic control systems in electric power plants as well. A well-placed device may have the potential to cause damage to this portion of the power grid infrastructure as well.
- As noted in this summary, both an EMP or Severe Geomagnetic Storm have the potential to cause electric power grid blackouts of unprecedented scale and with lengthy and unprecedented restoration times, perhaps multiple years. Unfortunately no design code has ever existed in the power industry to take into consideration these threat environments and in retrospect the engineering practices that were undertaken have in many cases unknowingly and greatly escalated the risks and potential impacts of these threat environments on this critical infrastructure. As shown in this economic analysis comparison performed for the FEMA assessment of Severe Geomagnetic Storms, this sort of storm could well be the most serious Natural Disaster that the country could ever face.
- This illustration shows the analysis results for a 4800 nT/min geomagnetic storm impulsive disturbance located at 50 degrees geomagnetic latitude (some 10 times stronger than the March 1989 storm and similar to that observed in the may 1921 storm). Using NERC disturbance criteria, the outlines of probable blackout regions are shown, progressive collapse could actually make initial blackout regions even larger than shown here. This would be a blackout of unprecedented scale and involve US population of over 130 million people. The red and green dots indicate the polarity and magnitude of GIC flow in each large EHV transformer in the US network. Red means flow of GIC into the transformer from ground, green means flow of GIC out of the transformer into ground. Polarity does not matter in that either polarity causes transformer half-cycle saturation and associated impacts. The size of th dot indicates magnitude, the larger the dot, the larger the GIC and it’s impacts on the transformer and electric power grid.
- This scenario also causes a large number of EHV transformers to experience large enough GIC Levels to be considered to be At-Risk of permanent damage due to this exposure. Each red dot indicates the location of an important At-Risk Transformer, also shown is the Percentage of Transformer in each state that is considered At-Risk, there are a number of states with At-Risk transsrformers at levels of ~50% or greater. This level of damage may prevent meaningful re-establishment of an interconnected power grid and raise many problems of transmitting and distributing electricity in these heavily impacted states.