1. Joel Heilman
Suitability of Club Ultimate Teams
Ultimate iscurrentlythe fastestgrowingsportinthe United States.The sportisdividedinto
three majordivisions:youth,college,andclub. Youthteamsandcollege teamsare typicallyassociated
witha school,butclub teamsare simplyformedinareaswithenoughplayers.Sowhattype of areasdo
clubteamsusuallyform? Iattemptedtomake a model showingwhichareasare mostsuitable forgood
newclubultimate teams.
Firstdata had to be collectedfromthe USA Ultimate website.Theylistthe teamsinorderof
rank and alsohave informationaboutthe team, includingwhattownthe teamisfrom.Notall the teams
listedtheirtown,andsome listedtwotowns.The firstteamlistedwasused,andafew teamswere
omittedbecause theirlocationcouldnotbe determined.There were alsoafew Canadianteamsthat
were omittedsince the projectfocusedonthe UnitedStates. The top100 cluband college teamswere
usedforthisproject
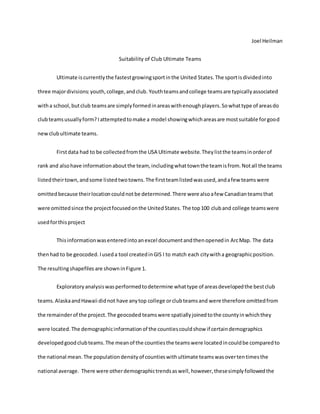
Thisinformationwasenteredintoanexcel documentandthenopenedin ArcMap. The data
thenhad to be geocoded. Iuseda tool createdinGIS I to match each citywitha geographicposition.
The resultingshapefiles are showninFigure 1.
Exploratoryanalysiswasperformedtodetermine whattype of areasdevelopedthe bestclub
teams. AlaskaandHawaii didnot have anytop college orclubteamsand were therefore omittedfrom
the remainderof the project.The geocoded teamswere spatiallyjoinedtothe countyinwhichthey
were located.The demographicinformationof the countiescouldshow if certaindemographics
developedgoodclubteams.The meanof the countiesthe teamswere locatedincouldbe comparedto
the national mean.The populationdensityof countieswithultimate teamswasovertentimesthe
national average. There were otherdemographictrendsaswell,however,thesesimplyfollowedthe
2. Figure 1: The geocodedteams.
trendsof higherpopulationdensities,suchasa lowermedianage andan increasedminoritypopulation.
In fact,90% of the topclub teamswere incitiesof over200,000. From thisI discernedthree criteriafora
newclubteam:near topcollege teams,nearlarge cities,andfarawayfrom currenttop clubteams.
The nextstepwas to constructthe model basedonthe three criteria (Figure 2).The selectby
attribute tool wasusedto make a newfeature classof citieswithapopulationover200,000. Thisclass
was usedalongwiththe geocodedcollege andclubteams. A Euclideandistance rasterwasmade from
each andreclassifiedtofitinthe weightedoverlaytool.Thisway,the tool couldfindareasnearcollege
teamsand large cities,butawayfromcurrent clubteams. The weightedoverlay tool wasweighted50%
citiesand25% forthe college andclubteamseach.The resultingrasterwasthenclippedtothe shape of
the 48 conterminousstatestoproduce the final map (Figure 3).
3. Figure 2: The model usedthree criteria:neartopcollege teams,nearlarge cities,andfarawayfrom
currenttop clubteams.
Figure 3: ClubUltimate Frisbee Suitability.
4. The resultingmapdisplayedpredictable results.Areaswiththe highestsuitabilityare areaslike
NewOrleans.Theyare nearhighcitiesandtop college teamsaswell asawayfromcurrenttop club
teams.The lowestareaswere faraway fromcitiesandtop college teamsandnearexistingclubteams,
like CrescentCity,California. InIowa,the DesMoinesareashowedupas the bestspotbecause of the
city’ssize anditsproximitytotopcollege teams.
I thenusedthe selectbyattribute tool tomake classesof onlythe top 25 college andclub
teams.I usedthose classesinthe same model toproduce anothermap (Figure 4).The resultswere
somewhatdifferent.Particularareasshoweddifferentresults.Forexample,PittsburghandOrlando
scoredmuch higheronthismap comparedto the othermap.
Figure 4: ClubUltimate Frisbee Suitabilitybasedonthe top25 teams.
5. The maps showedareasof high suitabilityscatteredaroundthe country.There didseemtobe
more hot spotsinthe southernhalf of the countrybecause of the numerouslarge citiesand
underdevelopmentof clubteamscomparedtothe north.The PacificNorthwestdidnotscore high
because italreadyhastop clubteams,while the northernplainsdon’thave large citiestosupporttop
clubteams. Most patternsare specifictoparticularregionsof the country.
The projectwas limitedbyitssimplicity.The model onlyusedthreefactorswheninrealitythere
are manyfactors that explainthe distributionof clubteams. Itwouldalsobe useful toweightthe model
basedon the teamrankingso that higherrankedteamsare more influential.
It may be interestingtosee howultimate teamsare locatedspatially,butmanynon-spatial
factors influence the locationof teams.Eachteamhasa unique storyandreasoningforforming.
However,geographictrendscanbe detectedtosee where there maybe goodpotential fornew teams
to form,and that wasthe goal of thisproject.In Iowa,there are plansalreadyinmotiontomake an elite
clubteam incentral Iowa,the same area predictedbythe model.