Beginners Guide to TikTok for Search - Rachel Pearson - We are Tilt __ Bright...
Back to the Futures Hedge Fund Journal Jan 2015
1. January 2015
1
fter a long dry spell in managed futures,
performance has improved. Investors
are asking important questions: why
has performance turned around, and is it likely
to continue? Does this mean that the managed
futures strategy isn’t broken? Should I reconsider
an allocation? In a recent Efficient client webinar
(after having the best quarter in our flagship fund’s
history since 2004) we outlined some of the market
conditions that have provided recent opportunity
for managed futures (or CTA) funds, and may very
well continue to provide strong performance looking
forward.
In the following article, we will list some of the
reasons behind the turnaround in performance, and
market conditions that may lead into a continued
strong CTA environment. We will then talk about
some of the new developments in the long-term
case for managed futures that have helped investors
better understand the source and character of CTA
returns. This can deepen the commitment to a
strategic long-term allocation. In short, we believe a
sound case can be made for a recommitment to the
CTA space.
REASONS FOR AN OPPORTUNISTIC
ALLOCATION TO MANAGED FUTURES NOW
The end of quantitative easing
The 2009-2013 period of unprecedented quantitative
easing and corresponding risk-on/risk-off market
behaviour, while successful in boosting equity
markets, was overall disappointing for CTAs. As
QE drew to a close in the autumn of 2013, we
anticipated it could open the door for a turnaround in
CTA funds. So far, that has been the case. Further, the
current divergence in central bank policy globally is
creating some meaningful trends in the currency and
fixed income markets.
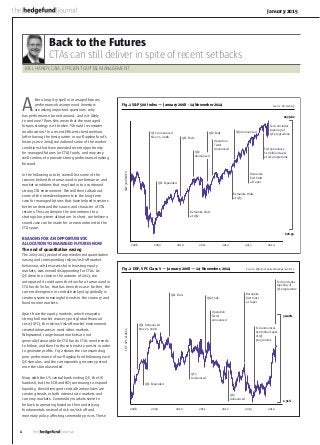
Apart from the equity markets, which enjoyed a
strong bull market recovery post global financial
crisis (GFC), the risk-on/risk-off market environment
created whipsaws in most other markets.
Whipsawed, range-bound markets are not
generally favourable for CTA funds. CTAs need trends
to follow, and then for those trends to persist in order
to generate profits. Fig.2 shows the corresponding
poor performance of our flagship fund following each
QE stimulus, and the corresponding recovery period
once the stimulus ended.
Now, with the US central bank ending QE, the UK
hawkish, but the ECB and BOJ continuing to expand
liquidity, these divergent central bank policies are
creating trends in both interest rate markets and
currency markets. Commodity markets seem to
be back to operating based on their underlying
fundamentals instead of risk on/risk off and
monetary policy affecting commodity prices. These
Back to the Futures
CTAs can still deliver in spite of recent setbacks
JOEL HANDY, CAIA, EFFICIENT CAPITAL MANAGEMENT
A Fig.1 S&P 500 Index — January 2008 - 14 November 2014 Source: Bloomberg
QE1 Announced
Nov 25, 2008
QE1 Expanded
QE1 Ends
Bernanke hints
at QE2
QE2
Announced
QE2 Ends
Operation
Twist
Announced
Bernanke Hints
at QE3
Bernanke
first hints
at Taper
QE3 Announced
Fed announces
$10 billion taper
of QE programme
2008 2009 2010 2011 2012 2013 2014
S&P500INDEX Fed concludes
tapering of
QE programme
676.53
2039.82
Fig.2 EDF, SPC Class S — January 2008 — 14 November, 2014 Source: Efficient Capital Management LLC
34.40%
QE1 Announced
Nov 25, 2008
QE1 Expanded
QE1 Ends
QE2
Announced
QE2 Ends
Operation
Twist
announced
Bernanke
first hints
at Taper
Fed announces
$10 billion taper
of QE
programme
Fed concludes
tapering of
QE programme
QE3
Announced
2008 2009 2010 2011 2012 2013 2014
2.31%
EDF,SPCCLASSS
2. January 2015
2
are macro developments and do not seem likely to
change in the near term. These developments have
provided the opportunities CTAs have captured over
the past several months, and if the environment
persists, are likely to keep providing CTAs opportunity.
Lowering inter-market correlations
Average correlations between markets have come
down to historically low levels. In general, one of
the good environmental factors forCTA performance
is having markets that act independently fromeach
other. Since CTA funds take a large number of
small bets in lots of different markets, a higher
diversification benefit from uncorrelated markets is
typically a good thing. CTAs are (mostly) systematic
strategies that follow trends in markets. They are
not (typically) market timers, able to reliably predict
which markets will trend in the future. CTAs build
systems that are good at systematically detecting
trends and following them as they occur. Therefore,
when markets trend independently from each
other, it is good for CTA strategies. They follow the
trends whenever and wherever they appear. Lower
inter-market correlations are typically better for
more diversified CTA programmes that trade more
markets, and have exposure beyond just the most
liquid markets.
In Fig.3 we show the average pairwise correlation of
the most liquid 70 futures markets from 1999-2014.
Correlations between markets rose substantially
during the GFC, and have been declining rapidly
in 2013-2014. This has helped with improved CTA
performance.
Bubbles and trends may be back
SEB is a CTA manager which has also published
research on why this could be an opportune time for
a tactical allocation. The following two points are
summarized from a recent SEB paper: “10 Reasons
to Invest in CTA Funds.” Over the past 18 months, the
market has not been so dominated by risk-on/risk-off
as in the prior 2009-2012 period. SEB suggests that
we are getting into the “greed” part of the cycle.
No one knows how long the market will continue to
expand, but perhaps we are starting to move into
equity bubble territory. Fig.4 from SEB shows the
relationship of price/earnings (PE) ratios and the
subsequent period of equity performance. High PE
ratios have tended to be predictive of poor future
equity performance.
Ratios of CTA to equity performance
Another point made by SEB concerns the historical
ratio between the CTA index and equity index: the
times in the past when the ratio was near 1 or
dropped below 1 were turning points for excellent
CTA performance and poor equity performance. In
this case, SEB uses the Barclay CTA Index and MSCI
World. We are currently at one of those lows, and
Fig.4 US equity market highly valued relative to its hitory Source: SEB “10 Reasons to Invest in CTA Funds”
-25.0%
-20.0%
-15.0%
-10.0%
-5.0%
0.0%
5.0%
10.0%
15.0%
20.0%
25.0%
Real Total Return (Inverted, LHS)
Shiller P/E (RHS)
1881
1889
1897
1906
1914
1922
1931
1939
1947
1956
1964
1972
1981
1989
1997
2006
PERCENTAGE
50
45
40
35
30
25
20
15
10
5
0
Fig.3 Rolling annual cross-sectional market correlation Source: Bloomberg, Efficient Capital Management LLC
Average Correlation
CORRELATION
0.35
0.3
0.25
0.2
0.15
0.1
0.05
0
12/31/1999
12/31/2000
12/31/2001
12/31/2002
12/31/2003
12/31/2004
12/31/2005
12/31/2006
12/31/2007
12/31/2008
12/31/2009
12/31/2010
12/31/2011
12/31/2012
12/31/2013
3. January 2015
3
it seems performance is already turning for CTAs.
This could be another signal towards improving CTA
performance.
A better CTA environment
In general, rising volatility, decreasing correlations,
and increased market diversification lead to better
performance from CTAs. The VIX is at historically low
levels. Correlations have dropped down to historically
low levels. Markets are operating independently
based more on idiosyncratic factors instead of risk-on/
risk-off caused by central banks. These environmental
factors tend to allow for better CTA performance.
A practical reality
In general, we at Efficient do not believe we are able
to time CTAs effectively. Even with a team of dozens
of professionals, decades of experience, an exclusive
focus on this space, one of the largest databases of
CTA information in the world, rigorous quantitative
research, and intensive qualitative research visiting
hundreds of managers on site, we can’t – even
though we’ve tried! We advise a strategic long-term
commitment to the managed futures space. That
said, the host of reasons offered above does seem like
a strong buying opportunity with CTAs. As investors
like Warren Buffett has said, “Buy when everyone
else is selling, and sell when everyone else is buying.”
This would have been great advice in 2009, post-GFC
and the strong CTA returns of 2008. It’s probably
great advice now.
NEW DEVELOPMENTS IN THE LONG-TERM CASE
FOR MANAGED FUTURES
The classic long-term case for managed futures is
well known by many, and almost every marketing
piece on CTAs includes it. That case (which is true)
is CTAs: 1) increase the Sharpe of the portfolio, 2)
reduce drawdowns, 3) have low correlation to stocks,
bonds, and other alternatives, 4) have convexity with
equity markets, i.e., they tend to perform best in
equity drawdowns when you need them most (aka
the “managed futures smile” seen in Fig.6 over the
page) 5) are liquid, 6) are transparent, and 7) are non-
directional, i.e., they can make money going long or
short with equal ease and typically no bias.
Newer developments
There are three newer developments that have
become more commonly accepted over the past
couple of years. These developments have further
explained and fortified the case for CTAs. They have
helped investors better understand CTA returns, and
have higher confidence in the strategy. The new
long-term case has three parts: 1) understanding the
economic behavioural fundamentals of why trends
and bubbles exist, and are likely to be a part of how
markets function as long as humans are key market
participants, 2) back-testing the performance of
trend-following systems over long-term data sets,
much longer than any previously available data,
and 3) explaining managed futures returns to a
meaningful degree through trend and momentum
systems, establishing trend as an “alternative beta.”
Understanding behavioural fundamentals
Before all the research on momentum and the
growth of behavioural finance, the underlying
sources of return in CTAs, and reasons for bubbles
and trends in markets, were not understood. CTAs
were often sold as “pure alpha”, seen by investors
as a “black boxes,” and many fundamental investors
could not see how trend following fits into modern
economic theory, efficient markets, and value-based
investing. For many investors, the behavioural
explanation for trends and momentum has provided
compelling underlying fundamental economic
understanding.Thinking about efficient markets has
become more nuanced over the years. In the past,
economic purists in support of the Efficient Market
Hypothesis (EMH) seemed unable to accept market
behaviour that seemed to contradict the theory.
The presence of some anomalies, and the tension
in some of the different explanatory theories has
now become more acceptable and commonplace.
The authors of the CFM paper, “Two centuries of
trend following,” point out an interesting example
of this nuanced tension. The 2013 Nobel economics
committee awarded prizes to both Eugene Fama who
declares that markets are efficient, and Robert Shiller
who declares the existence of bubbles caused by
“irrational exuberance.”
Fig.5 Is the tide turning in favour of CTAs again? Source: SEB “10 Reasons to Invest in CTA Funds”
3.00
2.50
2.00
1.50
1.00
0.50
0.00
Dec1986
Dec1988
Dec1990
Dec1992
Dec1994
Dec1996
Dec1998
Dec2000
Dec2002
Dec2004
Dec2006
Dec2008
Dec2010
Dec2012
Barclay CTA/MSCI World
Table 1 Hypothetical performance of time series momentum
Source: Brian Hurst, et all, “A Century of Trend Following”, white paper, AQR Capital Management, Fall 2012
Time period
Gross of fee
returns
(annualized)
Net of 2/20
fee returns
(annualized)
Realized
volatility
(annualized)
Sharpe ratio
net of fees
Correlation
to S&P
500 returns
Correlation
to US 10-year
bond returns
Full sample:
Jan 1903 - June 2012
By decade:
Jan 1903 - Dec 1912
Jan 1913 - Dec 1922
Jan 1923 - Dec 1932
Jan 1933 - Dec 1942
Jan 1943 - Dec 1952
Jan 1953 - Dec 1962
Jan 1963 - Dec 1972
Jan 1973 - Dec 1982
Jan 1983 - Dec 1992
Jan 1993 - Dec 2002
Jan 2003 - Dec 2012
20.0%
18.8%
17.1%
17.1%
9.7%
19.4%
24.8%
26.9%
40.3%
17.8%
19.3%
11.4%
14.3%
13.4%
11.9%
11.9%
6.0%
13.7%
18.4%
19.6%
30.3%
12.5%
13.6%
7.5%
9.9%
10.1%
10.4%
9.7%
9.2%
11.7%
10.00%
9.2%
9.2%
9.4%
8.4%
9.7%
1.00
0.84
0.70
0.92
0.66
1.08
1.51
1.42
1.89
0.53
1.04
0.61
-0.05
-0.30
-0.12
-0.07
0.00
0.21
0.21
-0.14
-0.19
0.15
-0.21
-0.22
-0.05
-0.59
-0.11
0.10
0.55
0.22
-0.18
-0.35
-0.40
0.13
0.32
0.20
4. January 2015
4
and portfolio results; second, this normally results in
a further primary benefit of lowering fees. Since all
the excess returns are not “pure alpha,” there is an
understandable and repeatable source of return that
can be captured in less expensive ways.
In order to demonstrate the performance of a simple
trend-following strategy, we built moving average
cross-over models over many timeframes and tested
them in 70 futures markets. This would be one way of
measuring a simple time series momentum strategy
style beta that could be regressed against active
manager returns.
It turns out that time series momentum is
persistent across markets and timeframes, produces
Shiller is a founding father of behavioural finance,
which has gone a long way to explaining why markets
sometimes have trends and bubbles. Human fear,
greed, optimism, and irrational bias play into market
participant behaviour, and therefore prices. As Cliff
Asness states – himself a University of Chicago PhD
and teaching assistant to Fama whose dissertation
was on momentum – value and momentum both
work. Trends and bubbles exist for periods of time
before true underlying value brings asset prices back
to where they should be. Markets are not perfectly
efficient all the time. Momentum and value both
work, at different times, and therefore, work really
well as complements to each other.
Back-testing over centuries of data
Another major development is that a number of
independent studies have back-tested trend and
momentum systems over very long data sets. These
studies tested centuries of data and confirmed the
long-term performance profile, excess returns, and
portfolio benefits of momentum-based trading.
In Table 1, AQR presents a time series momentum
model’s returns over a century, from 1903-2012.
It is noteworthy that AQR’s rule-based momentum
system provided over a century the benefits CTAs
have provided over the past 30 years – namely, strong
risk-adjusted returns on a stand-alone basis, with no
correlation to stocks and bonds.
Perhaps an extended poor performance period
like the industry has experienced post-2008 was
what was needed to encourage research into trend
following’s longer past. The CTA industry is only about
30 years old. Until recently, CTA indices had never
had a rolling three-year period of poor performance.
Many investors (and practitioners) starting asking if
something fundamental had changed about trend
following, so that it no longer worked.
AQR provided a drawdown table that showed
momentum systems can have extended drawdown
periods (see Table 2 over the page). In addition to
the AQR paper, Geczy and Samonov published, “212
Years of Price Momentum,” Bouchard, Potters, et al
published, “Two centuries of trend following,” and
ISAM published, “The Multi-Centennial View of Trend
Following Investing.” There is a consistent bottom line
of these four studies. Momentum-based strategies
demonstrate persistent excess returns, non-
correlation, and diversification properties. The longer
track records provide similar benefits as CTAs have
provided over their 30-year history. However, some of
the studies showed the potential of long, multi-year
drawdowns. So it seems that although CTAs are a
strong stand-alone performer over a long-term track
record, and a compelling diversifier in a portfolio,
there can be extended periods of non-performance,
as was experienced by recent investors in 2009-2013.
This is helpful for investors to understand recent
drawdowns in historical context, and have higher
confidence in the sustainability profile of trend and
momentum-based strategies.
An alternative beta
As mentioned above, there has been a strong
research movement in the investment world to
attempt to explain trend-following CTA returns
using time series momentum. Whenever investors
can explain hedge fund returns in a substantial way
through an alternative strategy style, through an
understandable and repeatable source of return, or
through what is sometimes called “alternative beta,”
then investors benefit in two ways primarily: first, by
adding predictability and higher confidence to returns
Fig.6 Managed futures “smile”
Source: Brian Hurst, et all, “Understanding Managed Futures”, white paper, AQR CapitalManagement, Winter 2010
-25 -20% -15% -10% -5%
-5%
-10%
-15%
5%
10%
10%
15%
15%
20%
20%
25%
25%
5%
2008 Q4
S&P 500 TOTAL RETURN (QUARTERLY)
SIMPLEMANAGEDFUTURESSTRATEGY
TOTALRETURNS(QUARTLERY)
This graph plots quarterly non-overlapping hypothetical returns of the Simple
Managed Futures Strategy (gross of transaction costs) versus the S&P 500 from 1985 to 2009.
Table 2 The largest drawdowns of time series momentum between 1903 and 2012
Source: Brian Hurst, et all, “A Century of Trend Following”, white paper, AQR Capital Management, Fall 2012
1
2
3
4
5
6
7
8
9
10
Mar - 1947
May - 1939
Oct - 1913
Feb - 1937
Oct - 1916
Feb - 2009
Jul - 1910
Nov - 1956
Oct - 2001
Dec - 1907
Dec - 1948
Jun - 1940
Mar - 1914
Apr - 1937
Apr - 1917
Jun - 2009
May - 1911
Mar - 1957
Apr - 2002
May - 1909
Mar - 1954
Jul - 1941
Oct - 1914
Dec - 1937
Nov - 1917
Jul - 2011
Dec - 1912
Jul - 1957
Jul - 2002
Jul - 1910
-26.3%
-20.7%
-15.2%
-14.4%
-13.8%
-13.5%
-11.3%
-11.2%
-10.8%
-10.4%
21
13
5
2
6
4
10
4
6
17
63
13
7
8
7
25
19
4
3
14
84
26
12
10
13
29
29
8
9
31
Rank
Start of
Drawdown
(Peak)
Lowest point
of Drawdown
(Trough)
End of
Drawdown
(Recovery)
Size of Peak-
to - Trough
Drawdown
Peak-to-Peak
Length
(Months)
Trough-to-
recovery
length (months)
Peak-to-
recovery
length (months)
5. January 2015
5
excess returns, and is highly explanatory of
trend following CTA managers. This is a strong
justification for considering trend following an
alternative beta, and understanding manager
returns.
In the heat maps in Fig.7, we show the performance
of simple moving average cross-over models over
many different time frames, as simple examples
of time series momentum, aka “trend following.”
The colours on the heat maps show the Sharpe
ratio of the different models. The “short lags” are
tested on every timeframe from 1-200 days, and
the “long lags” on every time frame from 2-500
days. We tested over 70 different futures markets
individually, but show the overall results of all the
markets in the heat maps. We also show results
over different historical periods. The overall dataset
was 1993-2013. “Ovrl I” was 1993-1999, “Ovrl II”
was 2000-2011, “Ovrl III” was 2011-2013.
Although there is strong, consistent performance
of these simple models across markets over long
periods of time, these heat maps do show that the
more recent past (2011-2013) was difficult for these
models. This helps put recent CTA performance into
context. Yet, the big picture point is clear: trend
following works consistently over different markets
and timeframes, with higher results towards the
longer-term models, and is explanatory of CTA
returns. THFJ
ABOUT THE AUTHOR
JOEL HANDY
Joel D. Handy is the director of client relations at
Efficient Capital Management, LLC. He is the head
of institutional sales for North America at Efficient,
overseeing relationships with consultants, pensions,
endowments, foundations, and family offices. Handy
is actively involved in the research and investment
process at Efficient. He holds a CAIA charter, a Series
3 license, and has been in the industry since 2008.
Fig.7 Performance of moving average cross-over models Source: Efficient Capital Management LLC
Long Lag
ShortLag
L&S ovrl
30 60 90120 250 300 400 500
1
3
5
7
10
50
100
150
200
−2
−1.5
−1
−0.5
0
0.5
Long Lag
ShortLag L&S ovrl I (1993-1999)
30 60 90120 250 300 400 500
1
3
5
7
10
50
100
150
200
−2
−1.5
−1
−0.5
0
0.5
1
1.5
Long Lag
ShortLag
L&S ovrl II (2000-2011)
30 60 90120 250 300 400 500
1
3
5
7
10
50
100
150
200
−2
−1.5
−1
−0.5
0
0.5
Long Lag
ShortLag
L&S ovrl III (2011-2013)
30 60 90120 250 300 400 500
1
3
5
7
10
50
100
150
200
−2
−1.5
−1
−0.5
0
0.5
“Perhaps an
extended poor
performance period
like the industry has
experienced post-
2008 was what was
needed to encourage
research into
trend following’s
longer past.”