SlideShare ist ein Scribd-Unternehmen logo
1 von 4
Excel 2007 - Gerando gráficos com linha de tendência 
Por mais que você trabalhe com um sistema empresarial (ERP) e não tenha que trabalhar com 
Excel, você um dia vai precisar gerar um gráfico para a gerência ou até mesmo para você, que quer 
controlar algum projeto pessoal, financeiro, etc. Vamos ensinar o passo a passo como gerar gráficos 
de forma simples. 
Abra um novo documento do Excel. 
Vamos criar uma tabela com alguns valores, e você pode formatar como quiser. (Bordas, cor, 
fonte) 
Meses 2006 2007 
Jan 100 120 
Fev 123 143 
Mar 154 174 
Abr 112 123 
Mai 145 165 
Jun 135 155 
Jul 180 210 
Ago 200 270 
Set 210 190 
Out 180 170 
Nov 170 190 
Dez 190 220 
Com os dados selecionados, clique em Inserir, depois no grupo Gráficos clique em Colunas e 
finalmente escolha a primeira opção em 2D, que são Colunas Agrupadas.
Veja o resultado: 
Vamos mostrar como customizar, mas fique a vontade para testar as opções que quiser. 
Selecione o gráfico (clique). Assim que você o selecionar, vai aparecer essa aba (Ferramentas de 
Gráfico). Nela contém: Design, Layout, Formatar. 
Clique em Design e você verá as opções abaixo... 
Aqui podemos alterar: - Tipo do Gráfico - Dados – Layout. Faça as alterações que melhor lhe 
atender. 
Linha de Tendência
Clique agora em Layout. Você terá diversas outras opções de personalização do seu gráfico. Mas a 
que mais interessa para o nosso treinamento é a aba “Análise”. Com o gráfico Selecionado Clique 
em Linha de Tendência (Círculo Laranja). Escolha a que você precisar. No nosso exemplo, vamos 
usar a Tendência Linear. 
Abaixo veja como a linha ficou. 
Outras Opções de Linha de Tendência: 
Clique em Linha de Tendência > Mais Opções de Linha de Tendência. Vai Abrir essa tela:
Nessa tela, você pode formatar sua linha, mudando a cor, sombrear, etc.

Weitere ähnliche Inhalte

Kürzlich hochgeladen

Expansão Marítima- Descobrimentos Portugueses século XV
Expansão Marítima- Descobrimentos Portugueses século XVExpansão Marítima- Descobrimentos Portugueses século XV
Expansão Marítima- Descobrimentos Portugueses século XV
lenapinto
 
19- Pedagogia (60 mapas mentais) - Amostra.pdf
19- Pedagogia (60 mapas mentais) - Amostra.pdf19- Pedagogia (60 mapas mentais) - Amostra.pdf
19- Pedagogia (60 mapas mentais) - Amostra.pdf
marlene54545
 
Artigo Científico - Estrutura e Formatação.ppt
Artigo Científico - Estrutura e Formatação.pptArtigo Científico - Estrutura e Formatação.ppt
Artigo Científico - Estrutura e Formatação.ppt
RogrioGonalves41
 
QUIZ ensino fundamental 8º ano revisão geral
QUIZ ensino fundamental 8º ano revisão geralQUIZ ensino fundamental 8º ano revisão geral
QUIZ ensino fundamental 8º ano revisão geral
AntonioVieira539017
 

Kürzlich hochgeladen (20)

Pesquisa Ação René Barbier Livro acadêmico
Pesquisa Ação René Barbier Livro  acadêmicoPesquisa Ação René Barbier Livro  acadêmico
Pesquisa Ação René Barbier Livro acadêmico
 
Expansão Marítima- Descobrimentos Portugueses século XV
Expansão Marítima- Descobrimentos Portugueses século XVExpansão Marítima- Descobrimentos Portugueses século XV
Expansão Marítima- Descobrimentos Portugueses século XV
 
3 2 - termos-integrantes-da-oracao-.pptx
3 2 - termos-integrantes-da-oracao-.pptx3 2 - termos-integrantes-da-oracao-.pptx
3 2 - termos-integrantes-da-oracao-.pptx
 
Aula 1 - Psicologia Cognitiva, aula .ppt
Aula 1 - Psicologia Cognitiva, aula .pptAula 1 - Psicologia Cognitiva, aula .ppt
Aula 1 - Psicologia Cognitiva, aula .ppt
 
19- Pedagogia (60 mapas mentais) - Amostra.pdf
19- Pedagogia (60 mapas mentais) - Amostra.pdf19- Pedagogia (60 mapas mentais) - Amostra.pdf
19- Pedagogia (60 mapas mentais) - Amostra.pdf
 
Texto dramático com Estrutura e exemplos.ppt
Texto dramático com Estrutura e exemplos.pptTexto dramático com Estrutura e exemplos.ppt
Texto dramático com Estrutura e exemplos.ppt
 
TCC_MusicaComoLinguagemNaAlfabetização-ARAUJOfranklin-UFBA.pdf
TCC_MusicaComoLinguagemNaAlfabetização-ARAUJOfranklin-UFBA.pdfTCC_MusicaComoLinguagemNaAlfabetização-ARAUJOfranklin-UFBA.pdf
TCC_MusicaComoLinguagemNaAlfabetização-ARAUJOfranklin-UFBA.pdf
 
Artigo Científico - Estrutura e Formatação.ppt
Artigo Científico - Estrutura e Formatação.pptArtigo Científico - Estrutura e Formatação.ppt
Artigo Científico - Estrutura e Formatação.ppt
 
LENDA DA MANDIOCA - leitura e interpretação
LENDA DA MANDIOCA - leitura e interpretaçãoLENDA DA MANDIOCA - leitura e interpretação
LENDA DA MANDIOCA - leitura e interpretação
 
6ano variação linguística ensino fundamental.pptx
6ano variação linguística ensino fundamental.pptx6ano variação linguística ensino fundamental.pptx
6ano variação linguística ensino fundamental.pptx
 
Plano de aula Nova Escola períodos simples e composto parte 1.pptx
Plano de aula Nova Escola períodos simples e composto parte 1.pptxPlano de aula Nova Escola períodos simples e composto parte 1.pptx
Plano de aula Nova Escola períodos simples e composto parte 1.pptx
 
Sistema de Bibliotecas UCS - Cantos do fim do século
Sistema de Bibliotecas UCS  - Cantos do fim do séculoSistema de Bibliotecas UCS  - Cantos do fim do século
Sistema de Bibliotecas UCS - Cantos do fim do século
 
QUIZ ensino fundamental 8º ano revisão geral
QUIZ ensino fundamental 8º ano revisão geralQUIZ ensino fundamental 8º ano revisão geral
QUIZ ensino fundamental 8º ano revisão geral
 
P P P 2024 - *CIEJA Santana / Tucuruvi*
P P P 2024  - *CIEJA Santana / Tucuruvi*P P P 2024  - *CIEJA Santana / Tucuruvi*
P P P 2024 - *CIEJA Santana / Tucuruvi*
 
GUIA DE APRENDIZAGEM 2024 9º A - História 1 BI.doc
GUIA DE APRENDIZAGEM 2024 9º A - História 1 BI.docGUIA DE APRENDIZAGEM 2024 9º A - História 1 BI.doc
GUIA DE APRENDIZAGEM 2024 9º A - História 1 BI.doc
 
Slides Lição 6, CPAD, As Nossas Armas Espirituais, 2Tr24.pptx
Slides Lição 6, CPAD, As Nossas Armas Espirituais, 2Tr24.pptxSlides Lição 6, CPAD, As Nossas Armas Espirituais, 2Tr24.pptx
Slides Lição 6, CPAD, As Nossas Armas Espirituais, 2Tr24.pptx
 
M0 Atendimento – Definição, Importância .pptx
M0 Atendimento – Definição, Importância .pptxM0 Atendimento – Definição, Importância .pptx
M0 Atendimento – Definição, Importância .pptx
 
Introdução às Funções 9º ano: Diagrama de flexas, Valor numérico de uma funçã...
Introdução às Funções 9º ano: Diagrama de flexas, Valor numérico de uma funçã...Introdução às Funções 9º ano: Diagrama de flexas, Valor numérico de uma funçã...
Introdução às Funções 9º ano: Diagrama de flexas, Valor numérico de uma funçã...
 
Historia de Portugal - Quarto Ano - 2024
Historia de Portugal - Quarto Ano - 2024Historia de Portugal - Quarto Ano - 2024
Historia de Portugal - Quarto Ano - 2024
 
Poesiamodernismo fase dois. 1930 prosa e poesiapptx
Poesiamodernismo fase dois. 1930 prosa e poesiapptxPoesiamodernismo fase dois. 1930 prosa e poesiapptx
Poesiamodernismo fase dois. 1930 prosa e poesiapptx
 

Empfohlen

Social Media Marketing Trends 2024 // The Global Indie Insights
Social Media Marketing Trends 2024 // The Global Indie InsightsSocial Media Marketing Trends 2024 // The Global Indie Insights
Social Media Marketing Trends 2024 // The Global Indie Insights
Kurio // The Social Media Age(ncy)
 
Good Stuff Happens in 1:1 Meetings: Why you need them and how to do them well
Good Stuff Happens in 1:1 Meetings: Why you need them and how to do them wellGood Stuff Happens in 1:1 Meetings: Why you need them and how to do them well
Good Stuff Happens in 1:1 Meetings: Why you need them and how to do them well
Saba Software
 

Empfohlen (20)

Content Methodology: A Best Practices Report (Webinar)
Content Methodology: A Best Practices Report (Webinar)Content Methodology: A Best Practices Report (Webinar)
Content Methodology: A Best Practices Report (Webinar)
 
How to Prepare For a Successful Job Search for 2024
How to Prepare For a Successful Job Search for 2024How to Prepare For a Successful Job Search for 2024
How to Prepare For a Successful Job Search for 2024
 
Social Media Marketing Trends 2024 // The Global Indie Insights
Social Media Marketing Trends 2024 // The Global Indie InsightsSocial Media Marketing Trends 2024 // The Global Indie Insights
Social Media Marketing Trends 2024 // The Global Indie Insights
 
Trends In Paid Search: Navigating The Digital Landscape In 2024
Trends In Paid Search: Navigating The Digital Landscape In 2024Trends In Paid Search: Navigating The Digital Landscape In 2024
Trends In Paid Search: Navigating The Digital Landscape In 2024
 
5 Public speaking tips from TED - Visualized summary
5 Public speaking tips from TED - Visualized summary5 Public speaking tips from TED - Visualized summary
5 Public speaking tips from TED - Visualized summary
 
ChatGPT and the Future of Work - Clark Boyd
ChatGPT and the Future of Work - Clark Boyd ChatGPT and the Future of Work - Clark Boyd
ChatGPT and the Future of Work - Clark Boyd
 
Getting into the tech field. what next
Getting into the tech field. what next Getting into the tech field. what next
Getting into the tech field. what next
 
Google's Just Not That Into You: Understanding Core Updates & Search Intent
Google's Just Not That Into You: Understanding Core Updates & Search IntentGoogle's Just Not That Into You: Understanding Core Updates & Search Intent
Google's Just Not That Into You: Understanding Core Updates & Search Intent
 
How to have difficult conversations
How to have difficult conversations How to have difficult conversations
How to have difficult conversations
 
Introduction to Data Science
Introduction to Data ScienceIntroduction to Data Science
Introduction to Data Science
 
Time Management & Productivity - Best Practices
Time Management & Productivity -  Best PracticesTime Management & Productivity -  Best Practices
Time Management & Productivity - Best Practices
 
The six step guide to practical project management
The six step guide to practical project managementThe six step guide to practical project management
The six step guide to practical project management
 
Beginners Guide to TikTok for Search - Rachel Pearson - We are Tilt __ Bright...
Beginners Guide to TikTok for Search - Rachel Pearson - We are Tilt __ Bright...Beginners Guide to TikTok for Search - Rachel Pearson - We are Tilt __ Bright...
Beginners Guide to TikTok for Search - Rachel Pearson - We are Tilt __ Bright...
 
Unlocking the Power of ChatGPT and AI in Testing - A Real-World Look, present...
Unlocking the Power of ChatGPT and AI in Testing - A Real-World Look, present...Unlocking the Power of ChatGPT and AI in Testing - A Real-World Look, present...
Unlocking the Power of ChatGPT and AI in Testing - A Real-World Look, present...
 
12 Ways to Increase Your Influence at Work
12 Ways to Increase Your Influence at Work12 Ways to Increase Your Influence at Work
12 Ways to Increase Your Influence at Work
 
ChatGPT webinar slides
ChatGPT webinar slidesChatGPT webinar slides
ChatGPT webinar slides
 
More than Just Lines on a Map: Best Practices for U.S Bike Routes
More than Just Lines on a Map: Best Practices for U.S Bike RoutesMore than Just Lines on a Map: Best Practices for U.S Bike Routes
More than Just Lines on a Map: Best Practices for U.S Bike Routes
 
Ride the Storm: Navigating Through Unstable Periods / Katerina Rudko (Belka G...
Ride the Storm: Navigating Through Unstable Periods / Katerina Rudko (Belka G...Ride the Storm: Navigating Through Unstable Periods / Katerina Rudko (Belka G...
Ride the Storm: Navigating Through Unstable Periods / Katerina Rudko (Belka G...
 
Barbie - Brand Strategy Presentation
Barbie - Brand Strategy PresentationBarbie - Brand Strategy Presentation
Barbie - Brand Strategy Presentation
 
Good Stuff Happens in 1:1 Meetings: Why you need them and how to do them well
Good Stuff Happens in 1:1 Meetings: Why you need them and how to do them wellGood Stuff Happens in 1:1 Meetings: Why you need them and how to do them well
Good Stuff Happens in 1:1 Meetings: Why you need them and how to do them well
 

105041152 excel-2007-gerando-graficos-com-linha-de-tendencia

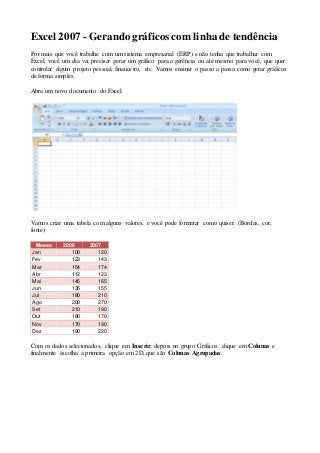
  • 1. Excel 2007 - Gerando gráficos com linha de tendência Por mais que você trabalhe com um sistema empresarial (ERP) e não tenha que trabalhar com Excel, você um dia vai precisar gerar um gráfico para a gerência ou até mesmo para você, que quer controlar algum projeto pessoal, financeiro, etc. Vamos ensinar o passo a passo como gerar gráficos de forma simples. Abra um novo documento do Excel. Vamos criar uma tabela com alguns valores, e você pode formatar como quiser. (Bordas, cor, fonte) Meses 2006 2007 Jan 100 120 Fev 123 143 Mar 154 174 Abr 112 123 Mai 145 165 Jun 135 155 Jul 180 210 Ago 200 270 Set 210 190 Out 180 170 Nov 170 190 Dez 190 220 Com os dados selecionados, clique em Inserir, depois no grupo Gráficos clique em Colunas e finalmente escolha a primeira opção em 2D, que são Colunas Agrupadas.
  • 2. Veja o resultado: Vamos mostrar como customizar, mas fique a vontade para testar as opções que quiser. Selecione o gráfico (clique). Assim que você o selecionar, vai aparecer essa aba (Ferramentas de Gráfico). Nela contém: Design, Layout, Formatar. Clique em Design e você verá as opções abaixo... Aqui podemos alterar: - Tipo do Gráfico - Dados – Layout. Faça as alterações que melhor lhe atender. Linha de Tendência
  • 3. Clique agora em Layout. Você terá diversas outras opções de personalização do seu gráfico. Mas a que mais interessa para o nosso treinamento é a aba “Análise”. Com o gráfico Selecionado Clique em Linha de Tendência (Círculo Laranja). Escolha a que você precisar. No nosso exemplo, vamos usar a Tendência Linear. Abaixo veja como a linha ficou. Outras Opções de Linha de Tendência: Clique em Linha de Tendência > Mais Opções de Linha de Tendência. Vai Abrir essa tela:
  • 4. Nessa tela, você pode formatar sua linha, mudando a cor, sombrear, etc.