SlideShare a Scribd company logo
1 of 6
5.2 Limits to Population Growth
Learning Outcomes:
2. Compare real population growth curves to models.
4. Apply a model of population growth to predict changes in population size.

Reminders: Midterm 1 Friday October 9th (Kingdoms to Eukaria is fair game. Put it on your cheat sheet!)

Modelling species carrying capacity:
Humans can modify the environment to enhance the growth and survival of select species. This can make
predictions of the carrying capacity for these species more difficult.
        e.g., we make more nutrients available to producers by - adding fertilizer to soils,
                                                                  - polluting waterways with effluent
        e.g., we remove predators would initially remove a limit on the abundance of the prey
              (removing wolves leads to and increase in the deer population)

Real populations do not always conform to the models
Environmental conditions can change dramatically as do community interactions. The size of real populations
will be impacted by these changes.

QUESTION: 1.Which segments of this figure could represent the following scenarios:
                                            1) disease or extreme climatic event? - Density
                                            dependant (corresponds to fast decreases in
                                            population)

                                                  2) rapid growth due to ample resources and lack of
                                                  predators? – exponential growth. no decreases in
                                                  population. Lasts till production RATE goes down

                                                  3) competition for resources and a gradual reduction of
                                                  reproductive rate?


Figure 1. Historic record wild sheep population   4) population grows beyond resources available?
growth
                                                  5) starvation and predation cause population crash?

Population cycles
Historic records from the Hudson Bay Company of the number of pelts traded by trappers indicated a pattern
of regular cycles.


                                     Figure 2. Population cycles of snowshoe hare and lynx in northern Canada
1. At high densities hares decimate the available shoots and twigs (reduce the food supply), predators remove
hares from the population.

2. Hares starve, are physiologically stressed and decrease in fertility. Their weak condition makes them easy
prey for the lynx. There is a further decrease in the number of hares.
QUESTION: 2. What type of factors are causing this decrease in the hare population?

3. Lynx prefer to feed on hare, and as the hare population decreases lynx need to search longer for prey.
They may switch to other less nutritious prey. The lynx find less suitable food and some starve. Their
weakened condition makes them more susceptible to parasites and disease as well as decreases their fertility.
Few lynx survive.

4. Vegetation recovers from herbivory. The surviving hares now have an abundant supply of food, and the
population begins to increase. One to two years later the lynx population also recovers.


    3. Label when each of these numbered events
    (1 – 4) occurs within the “boom-bust”
    population cycle on the graph at left.

        -   Red = Lynx
        -   Black – Hares

    Step 1 – at beginning of hare decline
    Step 2 – middle of decline
    Step 3 – bottom of decline
    Step 4 – beginning of incline


Human population growth
                                                                QUESTION: 4. What has caused great
                                                                increases in our population growth?
                                                                    -   Advances in medicine
                                                                    -   Agriculture advances
                                                                    -   Advances in science
                                                                    -   Labour previously performed by
                                                                        animals is now performed with
                                                                        machines: Steam engine, assembly
                                                                        line, electricity -> Fossil Fuels
                                                                    -   Urbanization
                                                                    -   Improvements in sanitation
Disparity among nations/societies in population growth


In major industrialized countries where societies are prosperous
- increases in levels of sanitation, nutrition and health care leads to a decrease in the death rate.
- the birth rate continues for several decades and then declines.
- the result is that initially there is an increase in population, but eventually leads to a decrease as people
develop different attitudes about family size (children needed for farm work or to ensure survival).

In developing countries
- birth rates and death rates are both high
- death rates decrease faster than birth rates
- the gap between birth and death rates means a significant and rapid increase in population.
- the adjustment of birth rates takes a significant period of time, during which high birth rates continue and
death rates are much lower.
QUESTION: 5. As a nation becomes more prosperous (transitions from developing to industrialized) what
factors contribute to a decline in human population growth rates?


The adjustment of birth and death rates are fundamental to demographic transition
- a positive correlation exists between high incomes and low birth rates.
- but birth rates can drop even with modest incomes as long as the economic gains are directed.
QUESTION 6 : Directed toward what end? What particular changes will cause lower birth rates?
    - making birth control more available
    - More educational and economic opportunities (eg: female literacy)
    - maneipation (religious beliefs)
    - Government Regulation (eg: China)


5-Stage Demographic Transition Model
http://www.geographyalltheway.com/igcse_geography/population_settlement/population/imagesetc/demographic_transitio
n_detailed.jpg
Predictions of global population change
A world clock located at this web site has continuously updated statistics on the human population.
http://www.poodwaddle.com/worldclock.swf
Since a peak in 1962 (2.19%) the rate of global
                                                         population growth has decreased.
                                                         The world population passed the 6 billion mark in
                                                         1999

                                                        UN estimates indicate that it will take until the middle
                                                        of next century before the impact of the post-World
                                                        WarII population explosion (baby boomers) relaxes.
                                                        Total world population is projected to reach more than
                                                        10 billion by 2100.
                                                        UN experts expect world population to stabilize
                                                        between 11 and 12 billion people.
                                                        The world population will still be growing but the
The rate of growth of the human population is correlated with the increase substantially lower thanfuels and
                                                        growth rate will be in the burning of fossil today.
CO2 emissions. Current scientific thinking suggests that energy resources will limit human endeavours and
population growth.

BIG QUESTIONS: 7. Where should we draw the line on the graph for carrying capacity? Have we
exceeded it already?
8. Are parts of the world already facing density dependent factors? – Disease, war, famine

9. Is habitat being degraded? – yes: clearcut logging polarbears -> ice break up pollution (disruption of food
chain)

Find your place in our population growth: http://www-popexpo.ined.fr/english.html Decide your
contribution.

Age-structure pyramids
                                                          Third world countries will account for more than
                                                          90% of world population growth.

                                                          In the developed regions, the changing age
                                                          structure within an almost stable population will
                                                          constitute the main problem rather than growth.

                                                          QUESTIONS: 10. What accounts for the
                                                          changes in Mexico’s age structure pyramid from
                                                          1975 to 2005?
                                                          – high mortality particularly in children. – high birth rate.
                                                          – lower infant mortality. – decreasing birth rate. – improved
                                                          health care.


                                                          11. As Mexico’s population becomes more stable
                                                          how will its shape continue to change? Draw on a
                                                          predicted line. (predicted line looks like a bulb.
                                                          Everything seems to even up)
12. How would you describe the country with this particular population? Is it more likely a developed
or developing country? How might you characterize this country in terms of birth rate, medical care,
economics and political stability?

   -   Hole in men population due to war.

More Related Content

More from JdccSeiki

8.1 Catching It
8.1 Catching It8.1 Catching It
8.1 Catching ItJdccSeiki
 
9.3 Prelude To Cancer
9.3 Prelude To Cancer9.3 Prelude To Cancer
9.3 Prelude To CancerJdccSeiki
 
9.2 Cell Cycle Disrupted
9.2 Cell Cycle Disrupted9.2 Cell Cycle Disrupted
9.2 Cell Cycle DisruptedJdccSeiki
 
9.1 Cell Division
9.1 Cell Division9.1 Cell Division
9.1 Cell DivisionJdccSeiki
 
8.3 Spreading It
8.3 Spreading It8.3 Spreading It
8.3 Spreading ItJdccSeiki
 
8.2 Fighting Back
8.2 Fighting Back8.2 Fighting Back
8.2 Fighting BackJdccSeiki
 
7.2 Cell Structure
7.2 Cell Structure7.2 Cell Structure
7.2 Cell StructureJdccSeiki
 
4.2 To Eat Or What To Eat
4.2 To Eat Or What To Eat4.2 To Eat Or What To Eat
4.2 To Eat Or What To EatJdccSeiki
 
4.1 Biotic Interactions
4.1 Biotic Interactions4.1 Biotic Interactions
4.1 Biotic InteractionsJdccSeiki
 
5.1 Population Potential
5.1 Population Potential5.1 Population Potential
5.1 Population PotentialJdccSeiki
 
6.3 Ecological Footprint
6.3 Ecological Footprint6.3 Ecological Footprint
6.3 Ecological FootprintJdccSeiki
 
6.1 Hippo (Part1)
6.1 Hippo (Part1)6.1 Hippo (Part1)
6.1 Hippo (Part1)JdccSeiki
 
3.3 Disturbances And A Changing Environment
3.3 Disturbances And A Changing Environment3.3 Disturbances And A Changing Environment
3.3 Disturbances And A Changing EnvironmentJdccSeiki
 
2.3 Phylogenetic Trees
2.3 Phylogenetic Trees2.3 Phylogenetic Trees
2.3 Phylogenetic TreesJdccSeiki
 
3.1 Organisms And Their Physical Environment
3.1 Organisms And Their Physical Environment3.1 Organisms And Their Physical Environment
3.1 Organisms And Their Physical EnvironmentJdccSeiki
 
3.2 Communities Of Species And Their Distribution
3.2 Communities Of Species And Their Distribution3.2 Communities Of Species And Their Distribution
3.2 Communities Of Species And Their DistributionJdccSeiki
 
2.1 Life As We Name It
2.1 Life As We Name It2.1 Life As We Name It
2.1 Life As We Name ItJdccSeiki
 

More from JdccSeiki (17)

8.1 Catching It
8.1 Catching It8.1 Catching It
8.1 Catching It
 
9.3 Prelude To Cancer
9.3 Prelude To Cancer9.3 Prelude To Cancer
9.3 Prelude To Cancer
 
9.2 Cell Cycle Disrupted
9.2 Cell Cycle Disrupted9.2 Cell Cycle Disrupted
9.2 Cell Cycle Disrupted
 
9.1 Cell Division
9.1 Cell Division9.1 Cell Division
9.1 Cell Division
 
8.3 Spreading It
8.3 Spreading It8.3 Spreading It
8.3 Spreading It
 
8.2 Fighting Back
8.2 Fighting Back8.2 Fighting Back
8.2 Fighting Back
 
7.2 Cell Structure
7.2 Cell Structure7.2 Cell Structure
7.2 Cell Structure
 
4.2 To Eat Or What To Eat
4.2 To Eat Or What To Eat4.2 To Eat Or What To Eat
4.2 To Eat Or What To Eat
 
4.1 Biotic Interactions
4.1 Biotic Interactions4.1 Biotic Interactions
4.1 Biotic Interactions
 
5.1 Population Potential
5.1 Population Potential5.1 Population Potential
5.1 Population Potential
 
6.3 Ecological Footprint
6.3 Ecological Footprint6.3 Ecological Footprint
6.3 Ecological Footprint
 
6.1 Hippo (Part1)
6.1 Hippo (Part1)6.1 Hippo (Part1)
6.1 Hippo (Part1)
 
3.3 Disturbances And A Changing Environment
3.3 Disturbances And A Changing Environment3.3 Disturbances And A Changing Environment
3.3 Disturbances And A Changing Environment
 
2.3 Phylogenetic Trees
2.3 Phylogenetic Trees2.3 Phylogenetic Trees
2.3 Phylogenetic Trees
 
3.1 Organisms And Their Physical Environment
3.1 Organisms And Their Physical Environment3.1 Organisms And Their Physical Environment
3.1 Organisms And Their Physical Environment
 
3.2 Communities Of Species And Their Distribution
3.2 Communities Of Species And Their Distribution3.2 Communities Of Species And Their Distribution
3.2 Communities Of Species And Their Distribution
 
2.1 Life As We Name It
2.1 Life As We Name It2.1 Life As We Name It
2.1 Life As We Name It
 

Recently uploaded

ICT Role in 21st Century Education & its Challenges.pptx
ICT Role in 21st Century Education & its Challenges.pptxICT Role in 21st Century Education & its Challenges.pptx
ICT Role in 21st Century Education & its Challenges.pptxAreebaZafar22
 
microwave assisted reaction. General introduction
microwave assisted reaction. General introductionmicrowave assisted reaction. General introduction
microwave assisted reaction. General introductionMaksud Ahmed
 
Measures of Central Tendency: Mean, Median and Mode
Measures of Central Tendency: Mean, Median and ModeMeasures of Central Tendency: Mean, Median and Mode
Measures of Central Tendency: Mean, Median and ModeThiyagu K
 
APM Welcome, APM North West Network Conference, Synergies Across Sectors
APM Welcome, APM North West Network Conference, Synergies Across SectorsAPM Welcome, APM North West Network Conference, Synergies Across Sectors
APM Welcome, APM North West Network Conference, Synergies Across SectorsAssociation for Project Management
 
Introduction to Nonprofit Accounting: The Basics
Introduction to Nonprofit Accounting: The BasicsIntroduction to Nonprofit Accounting: The Basics
Introduction to Nonprofit Accounting: The BasicsTechSoup
 
The basics of sentences session 2pptx copy.pptx
The basics of sentences session 2pptx copy.pptxThe basics of sentences session 2pptx copy.pptx
The basics of sentences session 2pptx copy.pptxheathfieldcps1
 
Nutritional Needs Presentation - HLTH 104
Nutritional Needs Presentation - HLTH 104Nutritional Needs Presentation - HLTH 104
Nutritional Needs Presentation - HLTH 104misteraugie
 
Holdier Curriculum Vitae (April 2024).pdf
Holdier Curriculum Vitae (April 2024).pdfHoldier Curriculum Vitae (April 2024).pdf
Holdier Curriculum Vitae (April 2024).pdfagholdier
 
Presentation by Andreas Schleicher Tackling the School Absenteeism Crisis 30 ...
Presentation by Andreas Schleicher Tackling the School Absenteeism Crisis 30 ...Presentation by Andreas Schleicher Tackling the School Absenteeism Crisis 30 ...
Presentation by Andreas Schleicher Tackling the School Absenteeism Crisis 30 ...EduSkills OECD
 
How to Give a Domain for a Field in Odoo 17
How to Give a Domain for a Field in Odoo 17How to Give a Domain for a Field in Odoo 17
How to Give a Domain for a Field in Odoo 17Celine George
 
1029 - Danh muc Sach Giao Khoa 10 . pdf
1029 -  Danh muc Sach Giao Khoa 10 . pdf1029 -  Danh muc Sach Giao Khoa 10 . pdf
1029 - Danh muc Sach Giao Khoa 10 . pdfQucHHunhnh
 
Key note speaker Neum_Admir Softic_ENG.pdf
Key note speaker Neum_Admir Softic_ENG.pdfKey note speaker Neum_Admir Softic_ENG.pdf
Key note speaker Neum_Admir Softic_ENG.pdfAdmir Softic
 
Advanced Views - Calendar View in Odoo 17
Advanced Views - Calendar View in Odoo 17Advanced Views - Calendar View in Odoo 17
Advanced Views - Calendar View in Odoo 17Celine George
 
Accessible design: Minimum effort, maximum impact
Accessible design: Minimum effort, maximum impactAccessible design: Minimum effort, maximum impact
Accessible design: Minimum effort, maximum impactdawncurless
 
Unit-V; Pricing (Pharma Marketing Management).pptx
Unit-V; Pricing (Pharma Marketing Management).pptxUnit-V; Pricing (Pharma Marketing Management).pptx
Unit-V; Pricing (Pharma Marketing Management).pptxVishalSingh1417
 
Grant Readiness 101 TechSoup and Remy Consulting
Grant Readiness 101 TechSoup and Remy ConsultingGrant Readiness 101 TechSoup and Remy Consulting
Grant Readiness 101 TechSoup and Remy ConsultingTechSoup
 
Activity 01 - Artificial Culture (1).pdf
Activity 01 - Artificial Culture (1).pdfActivity 01 - Artificial Culture (1).pdf
Activity 01 - Artificial Culture (1).pdfciinovamais
 
This PowerPoint helps students to consider the concept of infinity.
This PowerPoint helps students to consider the concept of infinity.This PowerPoint helps students to consider the concept of infinity.
This PowerPoint helps students to consider the concept of infinity.christianmathematics
 
Unit-IV- Pharma. Marketing Channels.pptx
Unit-IV- Pharma. Marketing Channels.pptxUnit-IV- Pharma. Marketing Channels.pptx
Unit-IV- Pharma. Marketing Channels.pptxVishalSingh1417
 

Recently uploaded (20)

ICT Role in 21st Century Education & its Challenges.pptx
ICT Role in 21st Century Education & its Challenges.pptxICT Role in 21st Century Education & its Challenges.pptx
ICT Role in 21st Century Education & its Challenges.pptx
 
microwave assisted reaction. General introduction
microwave assisted reaction. General introductionmicrowave assisted reaction. General introduction
microwave assisted reaction. General introduction
 
Measures of Central Tendency: Mean, Median and Mode
Measures of Central Tendency: Mean, Median and ModeMeasures of Central Tendency: Mean, Median and Mode
Measures of Central Tendency: Mean, Median and Mode
 
APM Welcome, APM North West Network Conference, Synergies Across Sectors
APM Welcome, APM North West Network Conference, Synergies Across SectorsAPM Welcome, APM North West Network Conference, Synergies Across Sectors
APM Welcome, APM North West Network Conference, Synergies Across Sectors
 
Introduction to Nonprofit Accounting: The Basics
Introduction to Nonprofit Accounting: The BasicsIntroduction to Nonprofit Accounting: The Basics
Introduction to Nonprofit Accounting: The Basics
 
The basics of sentences session 2pptx copy.pptx
The basics of sentences session 2pptx copy.pptxThe basics of sentences session 2pptx copy.pptx
The basics of sentences session 2pptx copy.pptx
 
Nutritional Needs Presentation - HLTH 104
Nutritional Needs Presentation - HLTH 104Nutritional Needs Presentation - HLTH 104
Nutritional Needs Presentation - HLTH 104
 
Holdier Curriculum Vitae (April 2024).pdf
Holdier Curriculum Vitae (April 2024).pdfHoldier Curriculum Vitae (April 2024).pdf
Holdier Curriculum Vitae (April 2024).pdf
 
Presentation by Andreas Schleicher Tackling the School Absenteeism Crisis 30 ...
Presentation by Andreas Schleicher Tackling the School Absenteeism Crisis 30 ...Presentation by Andreas Schleicher Tackling the School Absenteeism Crisis 30 ...
Presentation by Andreas Schleicher Tackling the School Absenteeism Crisis 30 ...
 
How to Give a Domain for a Field in Odoo 17
How to Give a Domain for a Field in Odoo 17How to Give a Domain for a Field in Odoo 17
How to Give a Domain for a Field in Odoo 17
 
1029 - Danh muc Sach Giao Khoa 10 . pdf
1029 -  Danh muc Sach Giao Khoa 10 . pdf1029 -  Danh muc Sach Giao Khoa 10 . pdf
1029 - Danh muc Sach Giao Khoa 10 . pdf
 
Key note speaker Neum_Admir Softic_ENG.pdf
Key note speaker Neum_Admir Softic_ENG.pdfKey note speaker Neum_Admir Softic_ENG.pdf
Key note speaker Neum_Admir Softic_ENG.pdf
 
Mehran University Newsletter Vol-X, Issue-I, 2024
Mehran University Newsletter Vol-X, Issue-I, 2024Mehran University Newsletter Vol-X, Issue-I, 2024
Mehran University Newsletter Vol-X, Issue-I, 2024
 
Advanced Views - Calendar View in Odoo 17
Advanced Views - Calendar View in Odoo 17Advanced Views - Calendar View in Odoo 17
Advanced Views - Calendar View in Odoo 17
 
Accessible design: Minimum effort, maximum impact
Accessible design: Minimum effort, maximum impactAccessible design: Minimum effort, maximum impact
Accessible design: Minimum effort, maximum impact
 
Unit-V; Pricing (Pharma Marketing Management).pptx
Unit-V; Pricing (Pharma Marketing Management).pptxUnit-V; Pricing (Pharma Marketing Management).pptx
Unit-V; Pricing (Pharma Marketing Management).pptx
 
Grant Readiness 101 TechSoup and Remy Consulting
Grant Readiness 101 TechSoup and Remy ConsultingGrant Readiness 101 TechSoup and Remy Consulting
Grant Readiness 101 TechSoup and Remy Consulting
 
Activity 01 - Artificial Culture (1).pdf
Activity 01 - Artificial Culture (1).pdfActivity 01 - Artificial Culture (1).pdf
Activity 01 - Artificial Culture (1).pdf
 
This PowerPoint helps students to consider the concept of infinity.
This PowerPoint helps students to consider the concept of infinity.This PowerPoint helps students to consider the concept of infinity.
This PowerPoint helps students to consider the concept of infinity.
 
Unit-IV- Pharma. Marketing Channels.pptx
Unit-IV- Pharma. Marketing Channels.pptxUnit-IV- Pharma. Marketing Channels.pptx
Unit-IV- Pharma. Marketing Channels.pptx
 

5.2 Limits To Population Growth

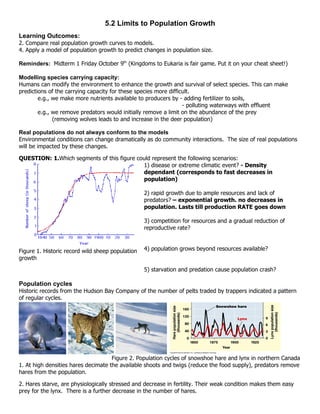
  • 1. 5.2 Limits to Population Growth Learning Outcomes: 2. Compare real population growth curves to models. 4. Apply a model of population growth to predict changes in population size. Reminders: Midterm 1 Friday October 9th (Kingdoms to Eukaria is fair game. Put it on your cheat sheet!) Modelling species carrying capacity: Humans can modify the environment to enhance the growth and survival of select species. This can make predictions of the carrying capacity for these species more difficult. e.g., we make more nutrients available to producers by - adding fertilizer to soils, - polluting waterways with effluent e.g., we remove predators would initially remove a limit on the abundance of the prey (removing wolves leads to and increase in the deer population) Real populations do not always conform to the models Environmental conditions can change dramatically as do community interactions. The size of real populations will be impacted by these changes. QUESTION: 1.Which segments of this figure could represent the following scenarios: 1) disease or extreme climatic event? - Density dependant (corresponds to fast decreases in population) 2) rapid growth due to ample resources and lack of predators? – exponential growth. no decreases in population. Lasts till production RATE goes down 3) competition for resources and a gradual reduction of reproductive rate? Figure 1. Historic record wild sheep population 4) population grows beyond resources available? growth 5) starvation and predation cause population crash? Population cycles Historic records from the Hudson Bay Company of the number of pelts traded by trappers indicated a pattern of regular cycles. Figure 2. Population cycles of snowshoe hare and lynx in northern Canada 1. At high densities hares decimate the available shoots and twigs (reduce the food supply), predators remove hares from the population. 2. Hares starve, are physiologically stressed and decrease in fertility. Their weak condition makes them easy prey for the lynx. There is a further decrease in the number of hares.
  • 2. QUESTION: 2. What type of factors are causing this decrease in the hare population? 3. Lynx prefer to feed on hare, and as the hare population decreases lynx need to search longer for prey. They may switch to other less nutritious prey. The lynx find less suitable food and some starve. Their weakened condition makes them more susceptible to parasites and disease as well as decreases their fertility. Few lynx survive. 4. Vegetation recovers from herbivory. The surviving hares now have an abundant supply of food, and the population begins to increase. One to two years later the lynx population also recovers. 3. Label when each of these numbered events (1 – 4) occurs within the “boom-bust” population cycle on the graph at left. - Red = Lynx - Black – Hares Step 1 – at beginning of hare decline Step 2 – middle of decline Step 3 – bottom of decline Step 4 – beginning of incline Human population growth QUESTION: 4. What has caused great increases in our population growth? - Advances in medicine - Agriculture advances - Advances in science - Labour previously performed by animals is now performed with machines: Steam engine, assembly line, electricity -> Fossil Fuels - Urbanization - Improvements in sanitation
  • 3. Disparity among nations/societies in population growth In major industrialized countries where societies are prosperous - increases in levels of sanitation, nutrition and health care leads to a decrease in the death rate. - the birth rate continues for several decades and then declines. - the result is that initially there is an increase in population, but eventually leads to a decrease as people develop different attitudes about family size (children needed for farm work or to ensure survival). In developing countries - birth rates and death rates are both high - death rates decrease faster than birth rates - the gap between birth and death rates means a significant and rapid increase in population.
  • 4. - the adjustment of birth rates takes a significant period of time, during which high birth rates continue and death rates are much lower. QUESTION: 5. As a nation becomes more prosperous (transitions from developing to industrialized) what factors contribute to a decline in human population growth rates? The adjustment of birth and death rates are fundamental to demographic transition - a positive correlation exists between high incomes and low birth rates. - but birth rates can drop even with modest incomes as long as the economic gains are directed. QUESTION 6 : Directed toward what end? What particular changes will cause lower birth rates? - making birth control more available - More educational and economic opportunities (eg: female literacy) - maneipation (religious beliefs) - Government Regulation (eg: China) 5-Stage Demographic Transition Model http://www.geographyalltheway.com/igcse_geography/population_settlement/population/imagesetc/demographic_transitio n_detailed.jpg Predictions of global population change A world clock located at this web site has continuously updated statistics on the human population. http://www.poodwaddle.com/worldclock.swf
  • 5. Since a peak in 1962 (2.19%) the rate of global population growth has decreased. The world population passed the 6 billion mark in 1999 UN estimates indicate that it will take until the middle of next century before the impact of the post-World WarII population explosion (baby boomers) relaxes. Total world population is projected to reach more than 10 billion by 2100. UN experts expect world population to stabilize between 11 and 12 billion people. The world population will still be growing but the The rate of growth of the human population is correlated with the increase substantially lower thanfuels and growth rate will be in the burning of fossil today. CO2 emissions. Current scientific thinking suggests that energy resources will limit human endeavours and population growth. BIG QUESTIONS: 7. Where should we draw the line on the graph for carrying capacity? Have we exceeded it already? 8. Are parts of the world already facing density dependent factors? – Disease, war, famine 9. Is habitat being degraded? – yes: clearcut logging polarbears -> ice break up pollution (disruption of food chain) Find your place in our population growth: http://www-popexpo.ined.fr/english.html Decide your contribution. Age-structure pyramids Third world countries will account for more than 90% of world population growth. In the developed regions, the changing age structure within an almost stable population will constitute the main problem rather than growth. QUESTIONS: 10. What accounts for the changes in Mexico’s age structure pyramid from 1975 to 2005? – high mortality particularly in children. – high birth rate. – lower infant mortality. – decreasing birth rate. – improved health care. 11. As Mexico’s population becomes more stable how will its shape continue to change? Draw on a predicted line. (predicted line looks like a bulb. Everything seems to even up)
  • 6. 12. How would you describe the country with this particular population? Is it more likely a developed or developing country? How might you characterize this country in terms of birth rate, medical care, economics and political stability? - Hole in men population due to war.