SlideShare a Scribd company logo
1 of 5
Download to read offline
Demographic and Housing Characteristics in the Blacksburg-Christiansburg-Radford, VA Metropolitan
Statistical Area
Jacqueline N. Tkac
10.05.2015
Introduction
This report provides a brief review of demographic characteristics and trends in the Blacksburg-
Christiansburg-Radford, Virginia Metropolitan Statistical Area, and its constituent jurisdictions. Data are
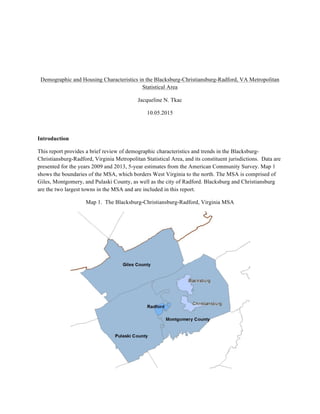
presented for the years 2009 and 2013, 5-year estimates from the American Community Survey. Map 1
shows the boundaries of the MSA, which borders West Virginia to the north. The MSA is comprised of
Giles, Montgomery, and Pulaski County, as well as the city of Radford. Blacksburg and Christiansburg
are the two largest towns in the MSA and are included in this report.
Map 1. The Blacksburg-Christiansburg-Radford, Virginia MSA
Population, Housing and Household Characteristics
Table 1 presents total population, households and persons per household for 2013 and the percent change
from 2009 to 2013. As shown in the Table 1, Giles and Pulaski County both had a decrease in population
between 2009 and 2013. Radford City was the only locality with a decrease in households during 2009-
2013. Giles Co., Pulaski Co., and the Town of Blacksburg all had a decrease in persons per household
between years 2009 and 2013.
2013
Percent+Change+
200912013 2013
Percent+Change+
200912013 2013
Percent+
Change+20091
2013
B/C/R+MSA 227,528 4.4% 84,775 4.2% 2.7 0.2%
Giles+Co. 17,111 10.5% 7,167 3.3% 2.4 13.6%
Montgomery+Co. 94,910 6.5% 34,789 6.0% 2.7 0.5%
Pulaski+Co. 34,768 10.4% 14,875 1.2% 2.3 11.6%
Radford+City 16,705 4.0% 5,516 11.2% 3.0 5.3%
Blacksburg 42,864+++++++++++++++ 3.0% 13,408 3.2% 3.2 10.2%
Christiansburg 21,170+++++++++++++++ 11.1% 9,020 8.5% 2.3 2.4%
Sources:+2009+and+2013+American+Community+51Year+Estimate
Persons+Per+Household
Table 1. Population, Households and Persons Per Household, 2013
Population Households
Figure 1. Shows the population in the town of Blacksburg in the year 2013, separated into categories by
both gender and age.
10000# 8000# 6000# 4000# 2000# 0# 2000# 4000# 6000# 8000# 10000#
Under#5##
10#to#14##
20#to#24##
30#to#34##
40#to#44##
50#to#54##
60#to#64##
70#to#74##
80#to#84##
Figure 1. Blacksburg, Population Pyramid, 2013
Female#
Male#
Table 2 provides the number of owner and renter occupied housing units for 2013 and the ownership rate
for 2013 and 2009. Giles County and Pulaski County both had an increase in ownership rates between
2009 and 2013.
Owner Renter
Percent*Own,*
2013
Percent*Own,*
2009
B/C/R*MSA 47,519*************** 37,256*********** 20.9% 21.3%
Giles*Co. 5,442**************** 1,725************ 31.8% 30.6%
Montgomery*Co. 19,012*************** 15,777*********** 20.0% 20.6%
Pulaski*Co. 10,816*************** 4,059************ 31.1% 30.0%
Radford*City 2,546**************** 2,970************ 15.2% 16.5%
Blacksburg 4,107**************** 9,301************ 9.6% 10.3%
Christiansburg 5,596**************** 3,424************ 26.4% 28.0%
Sources:*2009*and*2013*American*Community*5NYear*Estimate
Table 2. Owner and Renter Occupied Housing, 2013
Table 3 provides the percent of housing units that were vacant in 2009 and 2013. Christiansburg, Radford
City, and Montgomery County all had an overall increase in their housing vacancy rates between 2009
and 2013.
2009 2013
B/C/R*MSA 11.1% 11.1%
Giles*Co. 15.0% 13.7%
Montgomery*Co. 9.3% 9.9%
Pulaski*Co. 14.5% 13.5%
Radford*City 13.0% 14.5%
Blacksburg 11.5% 10.2%
Christiansburg 6.7% 8.4%
Sources:*2009*and*2013*American*Community*5KYear*Estimate
Table 3. Housing Vacancy Rates, 2009 and 2013
Household type describes whether a housing unit is occupied by a family (two or more people who are
related by blood or marriage) or a non-family (persons living alone or two or more unrelated individuals
living together in a housing unit). Table 4 shows Pulaski County having the highest percentage of
Husband-Wife Family housing in the MSA, on the other hand Pulaski County is also the locality with the
highest percentage of people living alone.
Husband(Wife
Spouse0Not0
Present Live0Alone
Live0with0
Others
B/C/R0MSA 43.0% 12.3% 64.4% 35.6%
Giles0Co. 50.0% 17.3% 87.5% 12.5%
Montgomery0Co. 44.5% 10.6% 61.0% 39.0%
Pulaski0Co. 50.8% 17.4% 87.8% 12.2%
Radford0City 30.7% 12.9% 62.4% 37.6%
Blacksburg 29.8% 5.8% 45.5% 54.5%
Christiansburg 45.4% 15.4% 80.6% 19.4%
Source:0020130American0Community0Survey05(Year0Estimate
Family Non(Family
Table 4. Household Types, 2013
Table 5 displays the median family and non-family incomes for all reported jurisdictions in the MSA. As
shown in Table 5, Husband-Wife family dynamics had the highest median income in 2013. Males
typically seemed to do better when they lived alone in a non-family household, where as females seemed
to do significantly better living with others in a non-family home. In family homes, when the wife was
not present, and it was just the husband, that situation had a better median income in most cases according
to this data.


Husband(Wife
Wife-not-
Present
Husband-not-
Present Live-Alone
Live-with-
Others Live-Alone
Live-with-
Others
B/C/R-MSA $74,003 $38,399 $25,978 $29,640 $21,987 $18,717 $29,789
Giles-Co. $65,919 $42,760 $32,826 $24,047 $35,395 $17,411 $38,929
Montgomery-Co. $76,778 $48,470 $24,571 $30,370 $22,337 $21,650 $21,556
Pulaski-Co. $62,228 $34,038 $27,385 $29,572 $21,637 $19,203 $38,021
Radford-City $73,255 $31,198 $20,385 $17,066 $21,250 $15,688 $18,868
Blacksburg $99,173 $18,105 $29,423 $29,707 $16,241 $18,231 $17,205
Christiansburg $74,750 $53,354 $20,081 $36,238 $64,423 $26,589 $50,000
Source:--2013-American-Community-Survey-5(Year-Estimate
Table 5. Median Incomes, 2013
Family Non(Family,-Male Non(Family,-Female
Table 6 provides unemployment and poverty rates for the total of all ages and for selected age groups. As
shown in Chart 1, the coefficient of determination is .05, which means the two variables do not have a
strong correlation at all, or a strong linear relationship. This means that 5% of the variance in one variable
can be predicted from the other. In other words, the correlation between the unemployment rates and
poverty rates are random and nonlinear.
Unemployment*
Rate Poverty*Rate
B/C/R*MSA 4% 22%
Giles*Co. 4% 13%
Montgomery*Co. 3% 22%
Pulaski*Co. 5% 13%
Radford*City 4% 31%
Blacksburg 4% 35%
Christiansburg 2% 13%
Source:**2013*American*Community*Survey*5JYear*Estimate
Table 6. Unemployment and Poverty, 2013
Chart 1. Shows linear relationship between poverty rate and unemployment rates throughout the MSA.

More Related Content

Similar to Demographic and Housing Characteristics in the Blacksburg-Christiansburg-Radford, VA Metropolitan Statistical Area

Characteristics of Households and Families 2015_1
Characteristics of Households and Families 2015_1Characteristics of Households and Families 2015_1
Characteristics of Households and Families 2015_1Coleen Duncan
 
Fredericksburg, VA Real Estate Market Report 2019
Fredericksburg, VA Real Estate Market Report 2019Fredericksburg, VA Real Estate Market Report 2019
Fredericksburg, VA Real Estate Market Report 2019Matthew Rathbun
 
Housing Virginia Rural Report - Nov 2016
Housing Virginia Rural Report - Nov 2016Housing Virginia Rural Report - Nov 2016
Housing Virginia Rural Report - Nov 2016Alise Newman
 
Q3 2013 nest report
Q3 2013 nest reportQ3 2013 nest report
Q3 2013 nest reportJeremy Hart
 
SC Economic Update
SC Economic UpdateSC Economic Update
SC Economic UpdateSummer Stone
 
Income Changes in Metro Atlanta: Meandering Through the Research
Income Changes in Metro Atlanta: Meandering Through the ResearchIncome Changes in Metro Atlanta: Meandering Through the Research
Income Changes in Metro Atlanta: Meandering Through the ResearchARCResearch
 
Jacksonville FL Real Estate Market Update for Q2 2013 NEFAR
Jacksonville FL Real Estate Market Update for Q2 2013 NEFARJacksonville FL Real Estate Market Update for Q2 2013 NEFAR
Jacksonville FL Real Estate Market Update for Q2 2013 NEFARSandy Neumann
 
Community Assessment Paper CPR
Community Assessment Paper CPRCommunity Assessment Paper CPR
Community Assessment Paper CPRADKHW
 

Similar to Demographic and Housing Characteristics in the Blacksburg-Christiansburg-Radford, VA Metropolitan Statistical Area (12)

Characteristics of Households and Families 2015_1
Characteristics of Households and Families 2015_1Characteristics of Households and Families 2015_1
Characteristics of Households and Families 2015_1
 
Farmington report
Farmington reportFarmington report
Farmington report
 
Fredericksburg, VA Real Estate Market Report 2019
Fredericksburg, VA Real Estate Market Report 2019Fredericksburg, VA Real Estate Market Report 2019
Fredericksburg, VA Real Estate Market Report 2019
 
Housing Virginia Rural Report - Nov 2016
Housing Virginia Rural Report - Nov 2016Housing Virginia Rural Report - Nov 2016
Housing Virginia Rural Report - Nov 2016
 
Q3 2013 nest report
Q3 2013 nest reportQ3 2013 nest report
Q3 2013 nest report
 
SC Economic Update
SC Economic UpdateSC Economic Update
SC Economic Update
 
Changes in Family Wealth, 1989 to 2013
Changes in Family Wealth, 1989 to 2013Changes in Family Wealth, 1989 to 2013
Changes in Family Wealth, 1989 to 2013
 
River Hills Indiana Regional Snapshot
River Hills Indiana Regional SnapshotRiver Hills Indiana Regional Snapshot
River Hills Indiana Regional Snapshot
 
Income Changes in Metro Atlanta: Meandering Through the Research
Income Changes in Metro Atlanta: Meandering Through the ResearchIncome Changes in Metro Atlanta: Meandering Through the Research
Income Changes in Metro Atlanta: Meandering Through the Research
 
Dr. James V. Koch's Economic Outlook for Eastern North Carolina
Dr. James V. Koch's Economic Outlook for Eastern North CarolinaDr. James V. Koch's Economic Outlook for Eastern North Carolina
Dr. James V. Koch's Economic Outlook for Eastern North Carolina
 
Jacksonville FL Real Estate Market Update for Q2 2013 NEFAR
Jacksonville FL Real Estate Market Update for Q2 2013 NEFARJacksonville FL Real Estate Market Update for Q2 2013 NEFAR
Jacksonville FL Real Estate Market Update for Q2 2013 NEFAR
 
Community Assessment Paper CPR
Community Assessment Paper CPRCommunity Assessment Paper CPR
Community Assessment Paper CPR
 

Recently uploaded

Statistics, Data Analysis, and Decision Modeling, 5th edition by James R. Eva...
Statistics, Data Analysis, and Decision Modeling, 5th edition by James R. Eva...Statistics, Data Analysis, and Decision Modeling, 5th edition by James R. Eva...
Statistics, Data Analysis, and Decision Modeling, 5th edition by James R. Eva...ssuserf63bd7
 
原版1:1定制南十字星大学毕业证(SCU毕业证)#文凭成绩单#真实留信学历认证永久存档
原版1:1定制南十字星大学毕业证(SCU毕业证)#文凭成绩单#真实留信学历认证永久存档原版1:1定制南十字星大学毕业证(SCU毕业证)#文凭成绩单#真实留信学历认证永久存档
原版1:1定制南十字星大学毕业证(SCU毕业证)#文凭成绩单#真实留信学历认证永久存档208367051
 
PKS-TGC-1084-630 - Stage 1 Proposal.pptx
PKS-TGC-1084-630 - Stage 1 Proposal.pptxPKS-TGC-1084-630 - Stage 1 Proposal.pptx
PKS-TGC-1084-630 - Stage 1 Proposal.pptxPramod Kumar Srivastava
 
INTERNSHIP ON PURBASHA COMPOSITE TEX LTD
INTERNSHIP ON PURBASHA COMPOSITE TEX LTDINTERNSHIP ON PURBASHA COMPOSITE TEX LTD
INTERNSHIP ON PURBASHA COMPOSITE TEX LTDRafezzaman
 
Easter Eggs From Star Wars and in cars 1 and 2
Easter Eggs From Star Wars and in cars 1 and 2Easter Eggs From Star Wars and in cars 1 and 2
Easter Eggs From Star Wars and in cars 1 and 217djon017
 
GA4 Without Cookies [Measure Camp AMS]
GA4 Without Cookies [Measure Camp AMS]GA4 Without Cookies [Measure Camp AMS]
GA4 Without Cookies [Measure Camp AMS]📊 Markus Baersch
 
Data Factory in Microsoft Fabric (MsBIP #82)
Data Factory in Microsoft Fabric (MsBIP #82)Data Factory in Microsoft Fabric (MsBIP #82)
Data Factory in Microsoft Fabric (MsBIP #82)Cathrine Wilhelmsen
 
Indian Call Girls in Abu Dhabi O5286O24O8 Call Girls in Abu Dhabi By Independ...
Indian Call Girls in Abu Dhabi O5286O24O8 Call Girls in Abu Dhabi By Independ...Indian Call Girls in Abu Dhabi O5286O24O8 Call Girls in Abu Dhabi By Independ...
Indian Call Girls in Abu Dhabi O5286O24O8 Call Girls in Abu Dhabi By Independ...dajasot375
 
Heart Disease Classification Report: A Data Analysis Project
Heart Disease Classification Report: A Data Analysis ProjectHeart Disease Classification Report: A Data Analysis Project
Heart Disease Classification Report: A Data Analysis ProjectBoston Institute of Analytics
 
Building on a FAIRly Strong Foundation to Connect Academic Research to Transl...
Building on a FAIRly Strong Foundation to Connect Academic Research to Transl...Building on a FAIRly Strong Foundation to Connect Academic Research to Transl...
Building on a FAIRly Strong Foundation to Connect Academic Research to Transl...Jack DiGiovanna
 
20240419 - Measurecamp Amsterdam - SAM.pdf
20240419 - Measurecamp Amsterdam - SAM.pdf20240419 - Measurecamp Amsterdam - SAM.pdf
20240419 - Measurecamp Amsterdam - SAM.pdfHuman37
 
While-For-loop in python used in college
While-For-loop in python used in collegeWhile-For-loop in python used in college
While-For-loop in python used in collegessuser7a7cd61
 
9711147426✨Call In girls Gurgaon Sector 31. SCO 25 escort service
9711147426✨Call In girls Gurgaon Sector 31. SCO 25 escort service9711147426✨Call In girls Gurgaon Sector 31. SCO 25 escort service
9711147426✨Call In girls Gurgaon Sector 31. SCO 25 escort servicejennyeacort
 
Advanced Machine Learning for Business Professionals
Advanced Machine Learning for Business ProfessionalsAdvanced Machine Learning for Business Professionals
Advanced Machine Learning for Business ProfessionalsVICTOR MAESTRE RAMIREZ
 
NLP Project PPT: Flipkart Product Reviews through NLP Data Science.pptx
NLP Project PPT: Flipkart Product Reviews through NLP Data Science.pptxNLP Project PPT: Flipkart Product Reviews through NLP Data Science.pptx
NLP Project PPT: Flipkart Product Reviews through NLP Data Science.pptxBoston Institute of Analytics
 
How we prevented account sharing with MFA
How we prevented account sharing with MFAHow we prevented account sharing with MFA
How we prevented account sharing with MFAAndrei Kaleshka
 
Student profile product demonstration on grades, ability, well-being and mind...
Student profile product demonstration on grades, ability, well-being and mind...Student profile product demonstration on grades, ability, well-being and mind...
Student profile product demonstration on grades, ability, well-being and mind...Seán Kennedy
 
RadioAdProWritingCinderellabyButleri.pdf
RadioAdProWritingCinderellabyButleri.pdfRadioAdProWritingCinderellabyButleri.pdf
RadioAdProWritingCinderellabyButleri.pdfgstagge
 
Machine learning classification ppt.ppt
Machine learning classification  ppt.pptMachine learning classification  ppt.ppt
Machine learning classification ppt.pptamreenkhanum0307
 

Recently uploaded (20)

Statistics, Data Analysis, and Decision Modeling, 5th edition by James R. Eva...
Statistics, Data Analysis, and Decision Modeling, 5th edition by James R. Eva...Statistics, Data Analysis, and Decision Modeling, 5th edition by James R. Eva...
Statistics, Data Analysis, and Decision Modeling, 5th edition by James R. Eva...
 
原版1:1定制南十字星大学毕业证(SCU毕业证)#文凭成绩单#真实留信学历认证永久存档
原版1:1定制南十字星大学毕业证(SCU毕业证)#文凭成绩单#真实留信学历认证永久存档原版1:1定制南十字星大学毕业证(SCU毕业证)#文凭成绩单#真实留信学历认证永久存档
原版1:1定制南十字星大学毕业证(SCU毕业证)#文凭成绩单#真实留信学历认证永久存档
 
PKS-TGC-1084-630 - Stage 1 Proposal.pptx
PKS-TGC-1084-630 - Stage 1 Proposal.pptxPKS-TGC-1084-630 - Stage 1 Proposal.pptx
PKS-TGC-1084-630 - Stage 1 Proposal.pptx
 
INTERNSHIP ON PURBASHA COMPOSITE TEX LTD
INTERNSHIP ON PURBASHA COMPOSITE TEX LTDINTERNSHIP ON PURBASHA COMPOSITE TEX LTD
INTERNSHIP ON PURBASHA COMPOSITE TEX LTD
 
Easter Eggs From Star Wars and in cars 1 and 2
Easter Eggs From Star Wars and in cars 1 and 2Easter Eggs From Star Wars and in cars 1 and 2
Easter Eggs From Star Wars and in cars 1 and 2
 
GA4 Without Cookies [Measure Camp AMS]
GA4 Without Cookies [Measure Camp AMS]GA4 Without Cookies [Measure Camp AMS]
GA4 Without Cookies [Measure Camp AMS]
 
Data Factory in Microsoft Fabric (MsBIP #82)
Data Factory in Microsoft Fabric (MsBIP #82)Data Factory in Microsoft Fabric (MsBIP #82)
Data Factory in Microsoft Fabric (MsBIP #82)
 
Indian Call Girls in Abu Dhabi O5286O24O8 Call Girls in Abu Dhabi By Independ...
Indian Call Girls in Abu Dhabi O5286O24O8 Call Girls in Abu Dhabi By Independ...Indian Call Girls in Abu Dhabi O5286O24O8 Call Girls in Abu Dhabi By Independ...
Indian Call Girls in Abu Dhabi O5286O24O8 Call Girls in Abu Dhabi By Independ...
 
Heart Disease Classification Report: A Data Analysis Project
Heart Disease Classification Report: A Data Analysis ProjectHeart Disease Classification Report: A Data Analysis Project
Heart Disease Classification Report: A Data Analysis Project
 
Building on a FAIRly Strong Foundation to Connect Academic Research to Transl...
Building on a FAIRly Strong Foundation to Connect Academic Research to Transl...Building on a FAIRly Strong Foundation to Connect Academic Research to Transl...
Building on a FAIRly Strong Foundation to Connect Academic Research to Transl...
 
20240419 - Measurecamp Amsterdam - SAM.pdf
20240419 - Measurecamp Amsterdam - SAM.pdf20240419 - Measurecamp Amsterdam - SAM.pdf
20240419 - Measurecamp Amsterdam - SAM.pdf
 
While-For-loop in python used in college
While-For-loop in python used in collegeWhile-For-loop in python used in college
While-For-loop in python used in college
 
9711147426✨Call In girls Gurgaon Sector 31. SCO 25 escort service
9711147426✨Call In girls Gurgaon Sector 31. SCO 25 escort service9711147426✨Call In girls Gurgaon Sector 31. SCO 25 escort service
9711147426✨Call In girls Gurgaon Sector 31. SCO 25 escort service
 
Advanced Machine Learning for Business Professionals
Advanced Machine Learning for Business ProfessionalsAdvanced Machine Learning for Business Professionals
Advanced Machine Learning for Business Professionals
 
Call Girls in Saket 99530🔝 56974 Escort Service
Call Girls in Saket 99530🔝 56974 Escort ServiceCall Girls in Saket 99530🔝 56974 Escort Service
Call Girls in Saket 99530🔝 56974 Escort Service
 
NLP Project PPT: Flipkart Product Reviews through NLP Data Science.pptx
NLP Project PPT: Flipkart Product Reviews through NLP Data Science.pptxNLP Project PPT: Flipkart Product Reviews through NLP Data Science.pptx
NLP Project PPT: Flipkart Product Reviews through NLP Data Science.pptx
 
How we prevented account sharing with MFA
How we prevented account sharing with MFAHow we prevented account sharing with MFA
How we prevented account sharing with MFA
 
Student profile product demonstration on grades, ability, well-being and mind...
Student profile product demonstration on grades, ability, well-being and mind...Student profile product demonstration on grades, ability, well-being and mind...
Student profile product demonstration on grades, ability, well-being and mind...
 
RadioAdProWritingCinderellabyButleri.pdf
RadioAdProWritingCinderellabyButleri.pdfRadioAdProWritingCinderellabyButleri.pdf
RadioAdProWritingCinderellabyButleri.pdf
 
Machine learning classification ppt.ppt
Machine learning classification  ppt.pptMachine learning classification  ppt.ppt
Machine learning classification ppt.ppt
 

Demographic and Housing Characteristics in the Blacksburg-Christiansburg-Radford, VA Metropolitan Statistical Area

  • 1. Demographic and Housing Characteristics in the Blacksburg-Christiansburg-Radford, VA Metropolitan Statistical Area Jacqueline N. Tkac 10.05.2015 Introduction This report provides a brief review of demographic characteristics and trends in the Blacksburg- Christiansburg-Radford, Virginia Metropolitan Statistical Area, and its constituent jurisdictions. Data are presented for the years 2009 and 2013, 5-year estimates from the American Community Survey. Map 1 shows the boundaries of the MSA, which borders West Virginia to the north. The MSA is comprised of Giles, Montgomery, and Pulaski County, as well as the city of Radford. Blacksburg and Christiansburg are the two largest towns in the MSA and are included in this report. Map 1. The Blacksburg-Christiansburg-Radford, Virginia MSA
  • 2. Population, Housing and Household Characteristics Table 1 presents total population, households and persons per household for 2013 and the percent change from 2009 to 2013. As shown in the Table 1, Giles and Pulaski County both had a decrease in population between 2009 and 2013. Radford City was the only locality with a decrease in households during 2009- 2013. Giles Co., Pulaski Co., and the Town of Blacksburg all had a decrease in persons per household between years 2009 and 2013. 2013 Percent+Change+ 200912013 2013 Percent+Change+ 200912013 2013 Percent+ Change+20091 2013 B/C/R+MSA 227,528 4.4% 84,775 4.2% 2.7 0.2% Giles+Co. 17,111 10.5% 7,167 3.3% 2.4 13.6% Montgomery+Co. 94,910 6.5% 34,789 6.0% 2.7 0.5% Pulaski+Co. 34,768 10.4% 14,875 1.2% 2.3 11.6% Radford+City 16,705 4.0% 5,516 11.2% 3.0 5.3% Blacksburg 42,864+++++++++++++++ 3.0% 13,408 3.2% 3.2 10.2% Christiansburg 21,170+++++++++++++++ 11.1% 9,020 8.5% 2.3 2.4% Sources:+2009+and+2013+American+Community+51Year+Estimate Persons+Per+Household Table 1. Population, Households and Persons Per Household, 2013 Population Households Figure 1. Shows the population in the town of Blacksburg in the year 2013, separated into categories by both gender and age. 10000# 8000# 6000# 4000# 2000# 0# 2000# 4000# 6000# 8000# 10000# Under#5## 10#to#14## 20#to#24## 30#to#34## 40#to#44## 50#to#54## 60#to#64## 70#to#74## 80#to#84## Figure 1. Blacksburg, Population Pyramid, 2013 Female# Male#
  • 3. Table 2 provides the number of owner and renter occupied housing units for 2013 and the ownership rate for 2013 and 2009. Giles County and Pulaski County both had an increase in ownership rates between 2009 and 2013. Owner Renter Percent*Own,* 2013 Percent*Own,* 2009 B/C/R*MSA 47,519*************** 37,256*********** 20.9% 21.3% Giles*Co. 5,442**************** 1,725************ 31.8% 30.6% Montgomery*Co. 19,012*************** 15,777*********** 20.0% 20.6% Pulaski*Co. 10,816*************** 4,059************ 31.1% 30.0% Radford*City 2,546**************** 2,970************ 15.2% 16.5% Blacksburg 4,107**************** 9,301************ 9.6% 10.3% Christiansburg 5,596**************** 3,424************ 26.4% 28.0% Sources:*2009*and*2013*American*Community*5NYear*Estimate Table 2. Owner and Renter Occupied Housing, 2013 Table 3 provides the percent of housing units that were vacant in 2009 and 2013. Christiansburg, Radford City, and Montgomery County all had an overall increase in their housing vacancy rates between 2009 and 2013. 2009 2013 B/C/R*MSA 11.1% 11.1% Giles*Co. 15.0% 13.7% Montgomery*Co. 9.3% 9.9% Pulaski*Co. 14.5% 13.5% Radford*City 13.0% 14.5% Blacksburg 11.5% 10.2% Christiansburg 6.7% 8.4% Sources:*2009*and*2013*American*Community*5KYear*Estimate Table 3. Housing Vacancy Rates, 2009 and 2013
  • 4. Household type describes whether a housing unit is occupied by a family (two or more people who are related by blood or marriage) or a non-family (persons living alone or two or more unrelated individuals living together in a housing unit). Table 4 shows Pulaski County having the highest percentage of Husband-Wife Family housing in the MSA, on the other hand Pulaski County is also the locality with the highest percentage of people living alone. Husband(Wife Spouse0Not0 Present Live0Alone Live0with0 Others B/C/R0MSA 43.0% 12.3% 64.4% 35.6% Giles0Co. 50.0% 17.3% 87.5% 12.5% Montgomery0Co. 44.5% 10.6% 61.0% 39.0% Pulaski0Co. 50.8% 17.4% 87.8% 12.2% Radford0City 30.7% 12.9% 62.4% 37.6% Blacksburg 29.8% 5.8% 45.5% 54.5% Christiansburg 45.4% 15.4% 80.6% 19.4% Source:0020130American0Community0Survey05(Year0Estimate Family Non(Family Table 4. Household Types, 2013 Table 5 displays the median family and non-family incomes for all reported jurisdictions in the MSA. As shown in Table 5, Husband-Wife family dynamics had the highest median income in 2013. Males typically seemed to do better when they lived alone in a non-family household, where as females seemed to do significantly better living with others in a non-family home. In family homes, when the wife was not present, and it was just the husband, that situation had a better median income in most cases according to this data.         Husband(Wife Wife-not- Present Husband-not- Present Live-Alone Live-with- Others Live-Alone Live-with- Others B/C/R-MSA $74,003 $38,399 $25,978 $29,640 $21,987 $18,717 $29,789 Giles-Co. $65,919 $42,760 $32,826 $24,047 $35,395 $17,411 $38,929 Montgomery-Co. $76,778 $48,470 $24,571 $30,370 $22,337 $21,650 $21,556 Pulaski-Co. $62,228 $34,038 $27,385 $29,572 $21,637 $19,203 $38,021 Radford-City $73,255 $31,198 $20,385 $17,066 $21,250 $15,688 $18,868 Blacksburg $99,173 $18,105 $29,423 $29,707 $16,241 $18,231 $17,205 Christiansburg $74,750 $53,354 $20,081 $36,238 $64,423 $26,589 $50,000 Source:--2013-American-Community-Survey-5(Year-Estimate Table 5. Median Incomes, 2013 Family Non(Family,-Male Non(Family,-Female
  • 5. Table 6 provides unemployment and poverty rates for the total of all ages and for selected age groups. As shown in Chart 1, the coefficient of determination is .05, which means the two variables do not have a strong correlation at all, or a strong linear relationship. This means that 5% of the variance in one variable can be predicted from the other. In other words, the correlation between the unemployment rates and poverty rates are random and nonlinear. Unemployment* Rate Poverty*Rate B/C/R*MSA 4% 22% Giles*Co. 4% 13% Montgomery*Co. 3% 22% Pulaski*Co. 5% 13% Radford*City 4% 31% Blacksburg 4% 35% Christiansburg 2% 13% Source:**2013*American*Community*Survey*5JYear*Estimate Table 6. Unemployment and Poverty, 2013 Chart 1. Shows linear relationship between poverty rate and unemployment rates throughout the MSA.