Scientific Plotting in Python
•
9 likes•6,796 views

Matplotlib has wonderfully served the Python community as the cornerstone of scientific graphics. Recently, many additional Python plotting options have surfaced, aimed to make it easier to create graphics that are interactive and web-publishable. These slides outline some of the new options with links to easy-to-follow, IPython notebooks.

Recommended
Recommended
More Related Content
What's hot
What's hot (20)
Similar to Scientific Plotting in Python
Similar to Scientific Plotting in Python (20)
Recently uploaded
Recently uploaded (20)
Scientific Plotting in Python
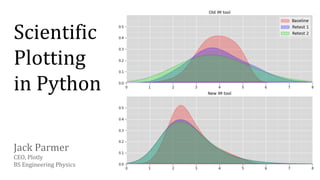
- 1. Scientific Plotting in Python Jack Parmer CEO, Plotly BS Engineering Physics
- 2. Developed over 10+ years. Cornerstone of scientific graphing in Python. Open-source.
- 3. New Expectations for Scientific Graphics ● Interactive ● Shareable on the Web ● Data is accessible ● Informed aesthetics
- 4. Technology Roadblock Matplotlib generates raster images. ● Not interactive ● Data is lost from graph ● No free anti-aliasing or fonts from browser technology
- 5. New Project - mplexporter Extract matplotlib “graph DNA” to a universal JSON format, that anyone can read. IPython Notebook: http://nbviewer.ipython.org/github/plotly/IPython-plotly/blob/master/See%20more/Plotly%20and%20mpld3.ipynb GitHub Repo: https://github.com/mpld3/matplotlylib mplexporter
- 6. mplexport Improves Data Liquidity x: [ 10.0, 20.0, 30.0 ] y: [ 100.0, 200.0, 300.0 ] Data is sent to matplotlib figure. A matplotlib figure object. Extract figure data and layout with mplexporter. Data can be reused for a different purpose. Goal is to make data transfer bidirectional - Data can be put in *and* taken out of figures. Plans to expand Matplotlib so that all figure objects include and expose their data.
- 7. SVG and Web Graphics are Incredible Several projects are leveraging rich web graphics technology for plotting with Python ● mpld3 (Using SVG / d3.js) ● http://mpld3.github.io/ ● Plotly (Using SVG / d3.js) ● http://plot.ly/python/ ● Bokeh (Using HTML5 Canvas) ● http://bokeh.pydata.org/
- 8. SVG and Web Graphics are Interactive Using JavaScript, scientific figures rendered with Python can have interactive elements. Zoom, pan, hover... http://nbviewer.ipython.org/gist/jackparmer/7729584
- 9. Aesthetic Layering for Matplotlib Several projects work with Matplotlib to improve its default styling, without using web graphics technology (SVG or Canvas). ● prettyplotlib ● http://olgabot.github.io/prettyplotlib/ ● Seaborn ● http://www.stanford. edu/~mwaskom/software/seaborn/
- 11. Sharing Scientific Plots on the Web Plotly syncs graphs and data to its cloud for free with its Python API. Each graph is given a unique URL https://plot.ly/~jackp/1544 Graphs are always kept with their original data. fig1 = plt.figure() x = np.arange(0,1.0,0.01) y1 = np.sin(2*np.pi*x) y2 = np.cos(4*np.pi*x) ax = fig1.add_subplot(111) ax.plot(x, y1, 'b--', label='sin') ax.plot(x, y2, 'ro', label='cos') ax.set_title("It's a Sign") ax.set_xlabel('time') ax.set_ylabel('amplitude') fig_to_plotly(fig1, plotly_username, plotly_api_key, notebook=True) https://plot.ly/~jackp/1544