Empfohlen

Empfohlen
Weitere ähnliche Inhalte
Was ist angesagt?
Andere mochten auch
Andere mochten auch (15)
Ähnlich wie Detroit Office Q2 2015 Leasing Report
Ähnlich wie Detroit Office Q2 2015 Leasing Report (20)
Mehr von JLL_Midwest_Great_Lakes_Research
Mehr von JLL_Midwest_Great_Lakes_Research (20)
Kürzlich hochgeladen
Kürzlich hochgeladen (20)
Detroit Office Q2 2015 Leasing Report
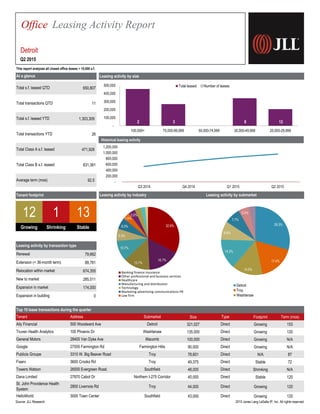
- 1. Office Leasing Activity Report Detroit Q2 2015 This report analyzes all closed office leases > 10,000 s.f. Leasing activity by size 650,807 11 1,303,309 26 471,928 831,381 92.5 Growing Shrinking Stable 79,662 89,781 674,355 285,511 174,000 0 Top 10 lease transactions during the quarter Size Footprint Term (mos) 321,027 Growing 153 135,000 Growing 120 100,000 Growing N/A 90,000 Growing N/A 78,601 N/A 87 49,375 Stable 72 48,000 Shrinking N/A 45,000 Stable 120 44,000 Growing 120 43,000 Growing 120HelloWorld 3000 Town Center Southfield Direct Dana Limited 27870 Cabot Dr Northern I-275 Corridor Direct St. John Providence Health System 2800 Livernois Rd Troy Direct Fiserv 3600 Crooks Rd Troy Publicis Groupe Direct Towers Watson 26555 Evergreen Road. Southfield Direct Direct 100 Phoenix Dr WashtenawTruven Health Analytics General Motors Google Direct 27555 Farmington Rd Farmington Hills Direct 3310 W. Big Beaver Road Troy Type 500 Woodward Ave Detroit DirectAlly Financial Tenant Address Submarket Direct 28405 Van Dyke Ave Macomb At a glance Total s.f. leased QTD Total transactions QTD Total s.f. leased YTD Tenant footprint 12 1 13 Total transactions YTD Leasing activity by transaction type Leasing activity by submarketLeasing activity by industry Total Class A s.f. leased Expansion in market Expansion in building Renewal Extension (< 36-month term) Relocation within market New to market Average term (mos) Total Class B s.f. leased 2 3 - 8 12 - 100,000 200,000 300,000 400,000 500,000 100,000+ 75,000-99,999 50,000-74,999 30,000-49,999 20,000-29,999 Total leased Number of leases 29.3% 17.4% 14.5% 14.3% 8.8% 7.7% 5.0% 3.1% Detroit Troy Washtenaw 32.6% 16.7% 13.7% 10.7% 6.3% 6.0% 3.6% 3.5% Banking finance insurance Other professional and business services Healthcare Manufacturing and distribution Technology Marketing advertising communications PR Law firm - 200,000 400,000 600,000 800,000 1,000,000 1,200,000 Q3 2014 Q4 2014 Q1 2015 Q2 2015 Historical leasing activity Source: JLL Research 2015 Jones Lang LaSalle IP, Inc. All rights reserved.