European Industrial & Logistics Capital Markets Q3 2016
•
2 gefällt mir•1,275 views

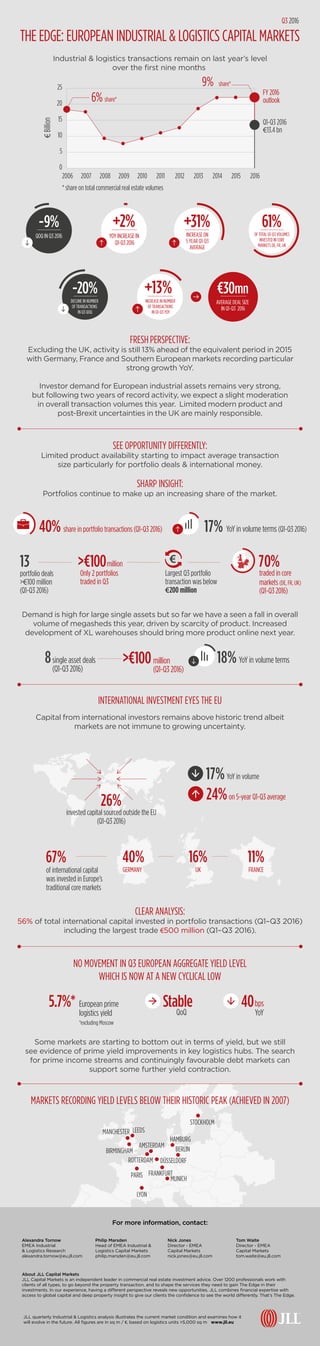
Despite challenges, 2016 could be a record year for investment in the industrial and logistics real estate sector. As investor demand remains robust, boosted by international capital, we explore some of the key drivers behind this trend. This infographic takes a close look at the main investment trends we saw in Q3 2016 across Europe.
Empfohlen

Empfohlen
Weitere ähnliche Inhalte
Was ist angesagt?
Was ist angesagt? (20)
Andere mochten auch
Andere mochten auch (7)
Ähnlich wie European Industrial & Logistics Capital Markets Q3 2016
Ähnlich wie European Industrial & Logistics Capital Markets Q3 2016 (20)
Mehr von JLL
Mehr von JLL (20)
Kürzlich hochgeladen
Kürzlich hochgeladen (20)
European Industrial & Logistics Capital Markets Q3 2016
- 1. single asset deals (Q1-Q3 2016) 8 YoY in volume terms18% Industrial & logistics transactions remain on last year’s level over the first nine months THE EDGE: EUROPEAN INDUSTRIAL & LOGISTICS CAPITAL MARKETS 9% share* * share on total commercial real estate volumes FY 2016 outlook Q3 2016 Q1-Q3 2016 €13.4 bn 25 20 15 10 5 201220112007 2008 2009 2010 2014 20152013 6%share* €Billion 0 2006 2016 FRESHPERSPECTIVE: Excluding the UK, activity is still 13% ahead of the equivalent period in 2015 with Germany, France and Southern European markets recording particular strong growth YoY. Investor demand for European industrial assets remains very strong, but following two years of record activity, we expect a slight moderation in overall transaction volumes this year. Limited modern product and post-Brexit uncertainties in the UK are mainly responsible. Demand is high for large single assets but so far we have a seen a fall in overall volume of megasheds this year, driven by scarcity of product. Increased development of XL warehouses should bring more product online next year. Capital from international investors remains above historic trend albeit markets are not immune to growing uncertainty. -9% QOQ IN Q3 2016 SHARP INSIGHT: Portfolios continue to make up an increasing share of the market. SEE OPPORTUNITY DIFFERENTLY: Limited product availability starting to impact average transaction size particularly for portfolio deals & international money. INTERNATIONAL INVESTMENT EYES THE EU AMSTERDAM BERLIN HAMBURG STOCKHOLM DÜSSELDORF FRANKFURT MUNICH LYON PARIS ROTTERDAM BIRMINGHAM MANCHESTER LEEDS NO MOVEMENT IN Q3 EUROPEAN AGGREGATE YIELD LEVEL WHICH IS NOW AT A NEW CYCLICAL LOW invested capital sourced outside the EU (Q1-Q3 2016) 26% YoY in volume 24%on 5-year Q1-Q3 average 17% 67% 40% 11%16% of international capital was invested in Europe’s traditional core markets YoY 40bps QoQ Stable5.7%* European prime logistics yield *excluding Moscow MARKETS RECORDING YIELD LEVELS BELOW THEIR HISTORIC PEAK (ACHIEVED IN 2007) GERMANY FRANCEUK CLEAR ANALYSIS: 56% of total international capital invested in portfolio transactions (Q1–Q3 2016) including the largest trade €500 million (Q1–Q3 2016). Some markets are starting to bottom out in terms of yield, but we still see evidence of prime yield improvements in key logistics hubs. The search for prime income streams and continuingly favourable debt markets can support some further yield contraction. For more information, contact: JLL quarterly Industrial & Logistics analysis illustrates the current market condition and examines how it will evolve in the future. All figures are in sq m / €, based on logistics units >5,000 sq m www.jll.eu Alexandra Tornow EMEA Industrial & Logistics Research alexandra.tornow@eu.jll.com Philip Marsden Head of EMEA Industrial & Logistics Capital Markets philip.marsden@eu.jll.com Tom Waite Director - EMEA Capital Markets tom.waite@eu.jll.com Nick Jones Director - EMEA Capital Markets nick.jones@eu.jll.com About JLL Capital Markets JLL Capital Markets is an independent leader in commercial real estate investment advice. Over 1200 professionals work with clients of all types, to go beyond the property transaction, and to shape the services they need to gain The Edge in their investments. In our experience, having a different perspective reveals new opportunities. JLL combines financial expertise with access to global capital and deep property insight to give our clients the confidence to see the world differently. That’s The Edge. -20% DECLINE IN NUMBER OF TRANSACTIONS IN Q3 QOQ +31% INCREASE ON 5 YEAR Q1-Q3 AVERAGE 61% OF TOTAL Q1-Q3 VOLUMES INVESTED IN CORE MARKETS DE, FR, UK +2% YOY INCREASE IN Q1-Q3 2016 +13% INCREASE IN NUMBER OF TRANSACTIONS IN Q1-Q3 YOY AVERAGE DEAL SIZE IN Q1-Q3 2016 ¤30mn million (Q1-Q3 2016) >¤100 share in portfolio transactions (Q1-Q3 2016)40% YoY in volume terms (Q1-Q3 2016)17% portfolio deals >€100 million (Q1-Q3 2016) 13 Only 2 portfolios traded in Q3 million>¤100 traded in core markets (DE, FR, UK) (Q1-Q3 2016) 70% Largest Q3 portfolio transaction was below €200 million