ICT Role in 21st Century Education & its Challenges.pptx
Teoria dos candlesticks
1. 1
Teoria dos candlesticks
Análise gráfica das cotações, originária do Japão, que se baseia no valor máximo, mínimo, de abertura
e fecho de uma cotação. O intervalo de preços entre a abertura e o fecho é representado por um
rectângulo. Se o preço de fecho for superior ao preço de abertura, o corpo da vela será branco. Se o
preço de fecho for inferior ao preço de abertura, o corpo da vela é negro. O máximo e o mínimo são as
sombras e representadas apenas por um linha.
Padrões de inversão
Harami e Harami Cross
Padrão de inversão segundo a teoria dos Candlesticks que assinala o nascimento de uma nova
tendência de curto-prazo.
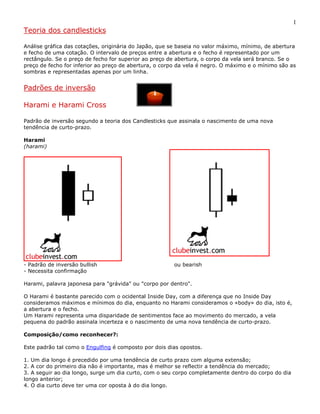
Harami
(harami)
- Padrão de inversão bullish ou bearish
- Necessita confirmação
Harami, palavra japonesa para "grávida" ou "corpo por dentro".
O Harami é bastante parecido com o ocidental Inside Day, com a diferença que no Inside Day
consideramos máximos e mínimos do dia, enquanto no Harami consideramos o «body» do dia, isto é,
a abertura e o fecho.
Um Harami representa uma disparidade de sentimentos face ao movimento do mercado, a vela
pequena do padrão assinala incerteza e o nascimento de uma nova tendência de curto-prazo.
Composição/como reconhecer?:
Este padrão tal como o Engulfing é composto por dois dias opostos.
1. Um dia longo é precedido por uma tendência de curto prazo com alguma extensão;
2. A cor do primeiro dia não é importante, mas é melhor se reflectir a tendência do mercado;
3. A seguir ao dia longo, surge um dia curto, com o seu corpo completamente dentro do corpo do dia
longo anterior;
4. O dia curto deve ter uma cor oposta à do dia longo.
2. 2
Interpretação do padrão:
Harami Bullish: existe uma tendência descendente de curto prazo há algum tempo. Um grande dia
longo (negro) ocorre, com volume médio, o que ajuda a perpetuar o sentimento bearish no mercado.
No dia seguinte, os preços abrem em alta, questionando as expectativas dos Bears menos convictos,
que correm a fechar as suas posições short. Este movimento de «short covering» faz com que os
preços subam. A subida da cotação é travada por aqueles que tinham uma perspectiva Bear, mas que
tinham perdido o início da tendência. Assim, estavam a aguardar uma oportunidade para entrarem
curtos no mercado. O volume neste segundo dia é superior ao do dia anterior, o que sugere a
existência de um grande «short covering». Uma abertura em alta no terceiro dia seria a confirmação
de que a tendência de curto prazo se teria invertido, de baixa para alta.
Harami Bearish: existe uma tendência ascendente de curto prazo há algum tempo. Um grande dia
longo (branco) ocorre com forte volume. No dia seguinte, os preços abrem em baixa e evoluem
durante a sessão dentro um intervalo apertado, para fechar abaixo da abertura mas dentro do corpo
do dia anterior. As convicções Bull ficam abaladas com esta segunda sessão que travou a tendência de
alta em vigor. A confirmação da inversão bearish vem com um fecho no terceiro dia abaixo do
segundo.
Harami Cross (Bearish)
(harami yose sen)
( Bullish)
(
- Padrão de inversão bullish ou bearish
- Confirmação não é um requisito, mas é recomendada.
O padrão Harami consiste num dia longo seguido de um dia mais curto (em termos de corpo, claro). É
a dimensão relativa dos dois corpos que determina a importância do Harami. O Harami Cross como as
figuras demonstram, é uma variação do padrão Harami em que a segundo vela é um Doji (vela em
que a abertura é igual ao fecho e que representa dias de indecisão), o que torna este padrão e as suas
indicações mais fiáveis que o normal acima descrito.
Composição/ como reconhecer?:
1. Um dia longo é precedido por uma tendência de curto prazo com alguma extensão;
2. A cor do primeiro dia não é importante, mas é melhor se reflectir a tendência do mercado;
3. O segundo dia do padrão é um Doji;
4. O segundo dia fica dentro do corpo do dia anterior.
Interpretação do padrão:
A interpretação dada ao Harami Cross é praticamente a mesma que a do Harami normal, com uma
pequena e importante diferença. O facto de o segundo dia fechar igual à abertura, formando o Doji,
3. 3
reflecte ainda mais a falta de convicção do mercado em continuar a tendência em vigor. Uma
significativa inversão de tendência de curto prazo terá ocorrido.
Flexibilidade do padrão:
A abertura e fecho do Doji não têm de ser exactamente iguais, mas é necessário que estejam bastante
próximos, para que num gráfico de médio prazo seja quase imperceptível a diferença.
Hammer e Hanging Man
(kanazuchi/tonkachi e kubitsuri)
- Padrão de inversão bullish (Hammer) ou bearish (Hanging Man)
- Necessita confirmação
Composição:
O Hammer e o Hanging Man são constituídos por uma única linha de Candlesticks. Têm grandes
sombras inferiores e um pequeno corpo, que está colocado no topo ou muito perto do topo da linha.
O Hammer acontece numa tendência de baixa, e é assim chamado por estar a «martelar» num
possível fundo de mercado. A palavra japonesa para Hammer (tonkachi), também significa chão ou
solo.
O Hanging Man acontece durante ou no topo de uma tendência de alta. O nome vem do facto desta
linha de candlestick realmente se assemelhar à figura de um homem enforcado.
Para que o Hammer e o Hanging Man se verifiquem realmente, é necessário que a sombra inferior
tenha no mínimo o dobro do comprimento do corpo.
Como reconhecer?
1. O pequeno corpo está no topo do trading range.
2. A cor do corpo tem pouca relevância. No entanto, um Hammer com corpo branco e um Hanging
Man com corpo preto, ou seja com cor contrária à da tendência, têm normalmente mais força.
3. A sombra inferior deverá ser muito mais longa do que o corpo. Normalmente terá um comprimento
de 2 a 3 vezes o do corpo.
4. Não deverá existir uma sombra superior, ou se existir, deverá ser muito pequena.
4. 4
Interpretação do padrão:
Hammer
O mercado tem estado numa tendência de curto prazo descendente. Abre num ponto e cai
abruptamente nas horas seguintes. No entanto, o sell-off começa a perder força e o mercado volta
para perto do máximo do dia. O falhanço do mercado em continuar a queda reduz o sentimento Bear,
e a maioria dos traders sentir-se-á preocupado com as posições short que possa deter. Se o
fechamento acabar por ser acima da abertura, causando um corpo branco, a situação é ainda mais
favorável aos bulls. A confirmação da inversão de tendência de curto prazo acontecerá se o mercado
no dia seguinte abrir em alta e fechar ainda mais alto.
Hanging Man
O mercado está em tendência de curto-prazo ascendente. Abre e sofre um sell-off negociando grande
parte da sessão bem abaixo da abertura, depois verifica-se um rally para um fechamento perto do
máximo do dia. Este comportamento intra diário leva à formação da longa sombra inferior que dá
indicações de que o mercado poderá ter começado um sell-off mais alargado. Se o mercado abrir em
baixa na sessão seguinte, a pressão vendedora tende a aumentar, com o fechamento perto dos
mínimos a confirmar os sinais de inversão do padrão.
Piercing Line
Padrão de inversão Bullish segundo a Teoria
dos Candlesticks.
Piercing Line
(kirikomi)
- Padrão de inversão bullish
- É aconselhável esperar pela confirmação, embora esta não seja uma exigência
Composição – Duas velas de cor oposta num mercado em tendência descendente. A primeira vela
tem corpo real negro reflectindo a tendência do mercado, a segunda vela tem corpo real branco
abrindo num novo mínimo para fechar acima do ponto intermédio (“mid-point”) do corpo dia anterior.
Pode-se dizer que é a versão bullish do Dark Cloud Cover.
Nota: O “Mid-point” é calculado somando metade da a amplitude do corpo real duma vela ao seu
valor de fecho. Ou seja, (Abertura – Fecho)/2 + Fecho = Mid-point
5. 5
Como reconhecer?
1- O primeiro dia é uma longa vela negra que dá continuidade à tendência de baixa em vigor;
2- O segundo dia é uma vela de corpo real branco que abre abaixo do mínimo do dia anterior;
3- O segundo dia fecha dentro do corpo da vela anterior e acima do seu ponto intermédio.
Factores que reforçam o sinal de inversão dado pelo padrão Piercing Line:
1- Quanto maior for o grau de penetração no corpo da primeira vela do padrão, maior a probabilidade
de sucesso da inversão assinalada; (Se o fecho do segundo dia for acima da abertura da primeira vela.
Estamos na presença dum Bullish Engulfing )
2- As velas que formam o Piercing Line devem ser longas.
3- É imprescindível que o segundo dia feche acima do ponto intermédio do corpo da primeira vela.
Caso contrário o padrão não existe e pode ser considerado um dos seguintes padrões de continuação:
On-neck, In-Neck e Thrusting
4- Numa tendência de baixa prolongada, em que uma forte vela negra abre nos seus máximos para
fechar nos mínimos da sessão e é seguida de uma longa vela branca que abre nos mínimos e fecha
nos máximos, o sinal de inversão sai reforçado;
5- Se o segundo dia do padrão abrir abaixo dum importante suporte para depois vir a fechar acima do
mesmo. Verificou-se uma falsa ruptura, os bears foram incapazes de manter o controlo do mercado e
o suporte funcionou como tal.
A interpretação dada a este padrão é a seguinte: o mercado está em tendência descendente, a
formação duma vela negra reforça esse tendência. No dia que se segue o mercado abre em gap-down,
reforçando as convicções bearish do mercado, segue-se uma subida intra diária que termina com um
fecho acima do ponto intermédio do dia anterior. Os bears ficam com dúvidas em relação ás suas
posições curtas e os bulls convencem-se que os mínimos estão fixados e é altura para entrar longo.
Padrão Engulfing
Explicação de mais um padrão de inversão
segundo a Teoria dos Candlesticks - Engulfing.
ENGULFING
(tsutsumi)
Bullish Engulfing Bearish Engulfing
6. 6
- Padrão de inversão bullish ou bearish
- Necessita confirmação
Composição – Duas velas com cor oposta, em que o corpo da segunda “engole/abraça” o corpo da
primeira.
Como reconhecer?
1- O mercado apresenta uma tendência de alta ou de baixa bem definida;
2- Duas velas formam o padrão Engulfing acima descrito. O corpo da segunda vela tem de engolir
(“engulf”) o da primeira. As sombras não são consideradas;
3- A cor da primeira vela reflecte a tendência em vigor: encarnado se esta for de baixa e branco se for
de alta;
4- A cor da segunda vela é oposta à da primeira vela. (Pode-se fazer uma excepção no caso de o
corpo da primeira vela ser tão pequeno que possa ser ou seja mesmo um doji)
A confirmação do sinal de inversão dado por este tipo de padrão é dado no “terceiro dia”, com o
mercado a manter-se abaixo da segunda vela no caso do Bearish Engulfing ou acima no caso da
Bullish Engulfing.
Factores que reforçam o sinal de inversão dado pelo padrão Engulfing:
1- O corpo da primeira vela do padrão é muito pequeno quando comparado com o corpo longo da
segunda vela. A interpretação dada é que, a primeira vela mostra por si só um abrandar/travar da
tendência em vigor que sai confirmado no dia seguinte, com uma longa vela a contrariar a tendência e
a assinalar uma inversão da mesma;
2- O Engulfing aparece depois de um rápido movimento. Um movimento rápido “estica o mercado”
tornando-o mais vulnerável a tomadas de mais-valias que resultam numa inversão desse movimento;
3- Se o padrão aparece no seguimento de um movimento sustentado é menor a probabilidade de
haver força no mercado para continuar esse movimento. Isto é, uma vez que o movimento tem já
algum tempo a força compradora ou vendedora pode estar esgotada, faltando munições para
contrariar o sinal dado pelo padrão;
4- O volume no dia da segunda vela é claramente superior ao da primeira. O interesse do mercado
mudou de lado, essa mudança é dada por um aumento de volume do lado contrário ao da tendência
que vinha a vigorar;
5- O segundo dia “engole” mais do que um corpo.
7. 7
Exemplo: Gráfico do BPI
Sticky Sandwich Sticky Sandwich
(gyakusashi niten zoko)
- Padrão de inversão bullish
8. 8
- Necessita confirmação
Composição - Duas velas negras que têm entre elas o corpo de uma vela branca. O fecho das duas
velas negras deve ser igual. Foi encontrada uma zona de suporte de curto-prazo (nos dois fechos das
velas negras) existindo uma oportunidade de inversão junto a esse valor.
Como reconhecer?
1- Numa tendência descendente uma vela de corpo negro é seguida de uma vela de corpo branco que
negocia acima do fecho da vela negra.
2 - O terceiro dia é negro com um fecho igual ao do primeiro dia do padrão
Neste padrão, por regra, apenas são considerados os corpos das velas, ou seja, as sombras são
ignoradas dando maior consistência ao suporte identificado pelo padrão. Existem no entanto, alguns
autores que optam por ser mais flexiveis e usam os mínimos das velas negras como suporte quando
estes não coincidem com o fecho.
A confirmação do padrão deverá vir com um fecho acima do ponto intermédio do corpo terceira vela,
com a cotação a distanciar-se em alta da mesma nas sessões seguintes.
-----------------------------------------------------------
Bibliografia: "Candlestick Charting Explained" de Gregory L. Morris
- Japanese Candlestick Charting Techniques, de Steve Nison
Padrões de Continuação
Thrusting Line
Padrão de continuação que resulta do Piercing Line.
Thrusting
(sashikomi)
- Padrão de continuação bearish
- Necessita confirmação
O Thrusting é a mais forte das três variações possíveis do padrão de inversão bullish Piercing Line.
Como reconhecer?
9. 9
- Uma vela negra é formada durante uma tendência de baixa;
- O segundo dia do padrão é uma vela branca que abre abaixo do mínimo do dia anterior, acabando
por fechar bem dentro do corpo real da vela negra, mas abaixo do seu ponto intermédio (mid-point).
O “Mid-point” é calculado somando metade da a amplitude do corpo real duma vela ao seu valor de
fecho. Ou seja, (Abertura – Fecho)/2 + Fecho = Mid-point
A interpretação dada ao Thrusting é muito simples, o padrão representa uma tentativa falhada de
inversão durante uma tendência de baixa.
(Nota: O padrão Thrusting pode ser considerado bullish quando aparece a meio de uma tendência de
alta, ou quando num mercado em baixa ocorre mais do uma vez num curto espaço de dias).
In Neck
Padrão de continuação que resulta do Piercing Line.
In Neck
(iri kubi)
- Padrão de continuação bearish
- Necessita é sugerida
O On-neck é uma das três variações possíveis do padrão de inversão bullish Piercing Line.
Como reconhecer?
- Uma vela negra é formada durante uma tendência de baixa;
- O segundo dia do padrão é uma vela branca que abre abaixo do mínimo do dia anterior;
- O fecho do segundo dia é praticamente ou mesmo igual ao do dia anterior, fazendo com a segunda
vela entre por muito pouco no corpo real da primeira.
A interpretação é precisamente a mesma que a dada ao On-neck, com a excepção de que a
probabilidade de continuação da tendência de baixa diminui em resultado do fecho mais alto.
Nota: Se o volume do segundo dia for alto, a probabilidade de continuação da tendência é maior.
10. 10
On Neck
Padrão de continuação que resulta do Piercing Line
On Neck
(ate kubi)
- Padrão de continuação bearish
- Necessita é sugerida
O On-neck é uma das três variações possíveis do padrão de inversão bullish Piercing Line.
Como reconhecer?
- Uma vela negra é formada durante uma tendência de baixa;
- O segundo dia do padrão é uma vela branca que abre abaixo do mínimo do dia anterior e que
normalmente apresenta um corpo real pequeno. Formações com uma longa segunda vela parecem-se
com o padrão bullish, Meeting Line.
- O segundo dia fecha no mínimo da primeira vela.
A interpretação dada ao On-neck é a seguinte: o sentimento bearish é reforçado com o
aparecimento de uma primeira longa vela negra num mercado em queda. No dia seguinte o mercado
abre em gap down, abaixo do mínimo da vela negra, mas sem dar continuidade à descida. A cotação
sobe durante a sessão para encontrar resistência no mínimo do dia anterior, acabando por fechar a
esse valor e lançando dúvidas na mente dos que tentaram adivinhar um fundo de curto-prazo. O
regresso de pressão vendedora ao mercado nas sessões seguintes, leva o mercado a novos mínimos e
confirma as indicações bearish do Padrão On-neck.
Nota: Se o volume do segundo dia for alto, a probabilidade de continuação da tendência é maior.
Rising e Falling Three Methods
Segue-se a explicação do Rising e Falling Three Methods, padrões de continuação que assinalam
um abrandar da tendência em vigor sem que uma inversão esteja em causa. São dias de descanso
que podem ser boas oportunidades de entrada ou reforço de posições a favor da tendência.
Rising Three Methods
(uwa banare sanpoo ohdatekomi)
11. 11
- Padrão de continuação bullish
- Não necessita confirmação
Composição/ Como reconhecer:
1- Uma longa vela branca é formada a meio de uma tendência de alta;
2- segue-se um grupo de velas com corpo pequeno que demonstram alguma resistência à tendência
de alta, mantendo-se dentro da amplitude ("range") da vela branca, máximos e mínimos.
O número ideal de velas de corpo pequeno é como nome do padrão indica o 3, no entanto formações
com apenas duas ou mais de três velas podem ser aceitas desde que estas não fechem acima ou
abaixo da vela branca. A cor destas velas de corpo pequeno é indiferente, sendo mais comum que
estas sejam pretas;
3- O último dia do padrão é novamente uma vela branca de corpo longo que abre acima do fecho da
sessão anterior e fecha igualmente acima do fecho da primeira vela do padrão a favor da tendência.
Falling Three Methods
(shita banare sanpoo ohdatekomi)
Padrão de continuação bearish
- Não necessita confirmação
Composição/ Como reconhecer:
12. 12
1- Uma longa vela negra é formada a meio de uma tendência de baixa;
2- segue-se um grupo de velas com corpo pequeno que demonstram alguma resistência à tendência
de baixa, mantendo-se dentro da amplitude ("range") da vela negra, máximos e mínimos.
O número ideal de velas de corpo pequeno é como nome do padrão indica o 3, no entanto formações
com apenas duas ou mais de três velas podem ser aceites desde que estas não fechem acima ou
abaixo da vela negra. A cor destas velas de corpo pequeno é indiferente, sendo mais comum que estas
sejam brancas;
3- O último dia do padrão é novamente uma vela negra de corpo longo que abre abaixo do fecho da
sessão anterior e fecha igualmente abaixo do fecho da primeira vela do padrão a favor da tendência.
-----------------------------------------------------------
A interpretação dada a estes dois padrões é muito simples, o mercado está a "descansar" da
tendência em vigor, as velas de corpo pequeno representam precisamente esse descanso e um
recuperar de forças para que se possa retomar o sentido da tendência.
Os dias de "descanso" são de grande conflito entre bulls e bears, lançando dúvidas quanto à
possiblidade de continuação ou não da tendência.
O facto de no caso do Rising, máximo da primeira vela não ser quebrado em fecho deixa os bulls
reticentes e a questionar a tendência de alta, com as aproximações aos mínimos da mesma vela a
alimentarem as esperanças dos bears. Esta indecisão termina quando a última vela distancia-se em
força dos máximos com o mercado a mostrar que a tendência de alta era para continuar. (Podemos
fazer a interpretação oposta para o Falling Three Methods)
Em ambos os casos, existe alguma flexibilidade na identificação do padrão sendo permitido que as
sombras das velas pequenas ultrapassem o máximo ou o mínimo, conforme o caso, da primeira vela .
Caso haja esta flexiblidade, é aconselhável que as velas pequenas cheguem a cobrir o range do
primeiro dia.
Depois de formado e confirmado o padrão Rising Three Methods pode ser resumido a uma só longa
vela branca que suporta a continuação bullish. O padrão Falling Three Methods resume-se logicamente
a uma longa vela negra que suporta uma continuação bearish.
Bibliografia utilizada:
-Japanese Candlestick Charting Techniques, de Steve Nison (disponível na loja do Clube);
- Candlestick Charting Explained, de Gregory L. Morris;
- The Candlestick Course, de Steve Nison.
13. 13
CANDLESTICK TERMS
REAL BODY
The real body is the 2-dimensional rectangle made by the difference between the open and close
of the trading day. The real body will be white on days that the stock closes higher than it opens,
and black on days that it closes lower than it opens.
UPPER AND LOWER SHADOWS
The upper shadow is the vertical line drawn from the top of the candlestick's real body to the day's
high. The lower shadow is the vertical line drawn from the bottom of the candlestick's real body to
the day's low.
SPECIAL CANDLESTICKS
LONG DAY
A candlestick that has a long day is one in which there has been a big difference in opening and
closing price compared with typical trading days in the previous five to ten days.
SHORT DAY
A candlestick that has a short day is one in which there has been a small difference in opening
and closing price compared with typical trading days in the previous five to ten days.
MARUBOZU
A marubozu candlestick is one that exhibits no (or very little) upper or lower shadow. For a white
candlestick this means that its open is equal to its low, and its close is equal to its high. For a
black candlestick it means that its open is equal to its high, and its close is equal to its low.
SPINNING TOP
A spinning top is candlestick with a small real body and long upper and lower shadows.
DOJI
A doji is the most extreme case of a spinning top. It occurs when the real body exists as a line
(when the day's open and close are the same). A long legged doji has long upper and lower
shadows. A gravestone doji has a long upper shadow and no lower shadow. A dragonfly doji
has no upper shadow and a long lower shadow. And a four price doji has no upper or lower
shadows (the open, high, low, and close are the same).
STAR
A star is a small real body that gaps above or below a long candlestick occurring the previous day.
UMBRELLA and INVERTED UMBRELLA
An umbrella is similar to a dragonfly doji: a small real body with no upper shadow and a long lower
shadow. An inverted umbrella is similar to a gravestone doji: a small real body with a long upper
shadow and no lower shadow.
ANALYSIS TERMS
INDICATOR
An indicator is a group of candlesticks (as many as five or as few as one) that meet a set of
predetermined criteria. These criteria may include prior trend, real body and/or shadow length,
long and short days, opening and closing gaps, etc. Associated with each indicator are a trend
(bullish or bearish) and a pattern (reversal or continuation) that should ensue for the short-term.
TREND (Tendência)
The term trend is used to sum up the general movement of a stock's value over a period of time. If
a stock's price is generally increasing over a short period of time it is said to be in a bullish trend. If
14. 14
a stock's price is generally decreasing over a short period of time it is said to be in a bearish
trend. In candlestick charting the previous trend is used as a criteria for identifying most indicators.
The method we employ is the Three Line Break graph; a technique that is well-suited to
candlestick charting.
PATTERN (Padrão)
When an indicator is identified, a pattern is associated with it. This pattern could be a Continuation
pattern, meaning that if a stock is in a bullish trend it should continue to stay bullish, or if a stock is
in a bearish trend it should continue to stay bearish. If the pattern is a Reversal pattern, it means
that if a stock is currently bullish it likely to turn bearish, or if it is bearish it is likely to turn bullish
RELIABILITY (Confiabilidade)
Reliability is a term we use to loosely classify how adequate indicators are at determining the
short-term future of an investment. Some indicators are, of course, more decisive than others (the
indicators that take a three or more days develop or those that have strong candlesticks, such as
stars or marubozus tend to have a higher rate of success). We have segregated indicators by
High, Moderate, and Low reliability's based on their success rates on historical market data.
Glossary of Candlestick Indicators
Bullish Indicators Bearish Indicators
• Abandoned Baby • Abandoned Baby
• Belt Hold • Advance Block
• Breakaway • Belt Hold
• Concealing Baby Swallow • Breakaway
• Doji Star • Dark Cloud Cover
• Dragonfly Doji • Deliberation
• Engulfing • Downside Gap Three Methods
• Gravestone Doji • Downside Tasuki Gap
• Hammer • Doji Star
• Harami • Dragonfly Doji
• Harami Cross • Engulfing
• Homing Pigeon • Evening Doji Star
• Inverted Hammer • Evening Star
• Kicking • Falling Three Methods
• Ladder Bottom • Gravestone Doji
• Mat Hold • Hanging Man
• Matching Low • Harami
• Meeting Lines • Harami Cross
• Morning Doji Star • Identical Three Crows
• Morning Star • In Neck
• Piercing Line • Kicking
• Rising Three Methods • Meeting Lines
• Separating Lines • On Neck
• Side By Side White Lines • Separating Lines
• Stick Sandwich • Shooting Star
• Three Inside Up • Side By Side White Lines
• Three Line Strike • Three Black Crows
• Three Outside Up • Three Inside Down
• Three Stars In The South • Three Line Strike
• Three White Soldiers • Three Outside Down
• Tri Star • Thrusting
• Unique Three River Bottom • Tri Star
15. 15
• Upside Gap Three Methods • Two Crows
• Upside Tasuki Gap • Upside Gap Two Crows
Bullish Indicators
Abandoned Baby Bullish
Pattern: Reversal
Trend: Bullish
Reliability: High
How to Identify it
• First day is usually a long black day
• Second day is a doji that gaps in the direction of the previous trend
• The third day is a white day, gapping in the opposite direction, with no overlapping
shadows
What it Means
In a downtrend, the market bolsters the bearish trend with a long black day and gaps open on the
second day. However, the second day trades within a small range and closes at or near its open.
This scenario definitely shows the potential for a rally, as many positions have been changed.
Confirmation of the trend reversal is given by the white third day, and is well defined by the
upward gap.
Belt Hold Bullish
Pattern: Reversal
Trend: Bullish
Reliability: Low
How to Identify it
• A white body occurs in a downtrend with no lower shadow
What it Means
In a downtrend, a white body occurs with an open that is also the low for the day. This may signify
a rally for the bulls.
16. 16
Breakaway Bullish
Pattern: Reversal
Trend: Bullish
Reliability: Moderate
How to Identify it
• The first day is a long black day
• The second day is a black day that gaps below the first day
• The third and fourth days continue to in the direction of the second with lower
consecutive closes
• The fifth day is a long white day that closes into the gap between the first and
second days
What it Means
A downtrend sees prices bottoming out and leveling off. The result is a long white day which does
not close the gap into the body of the first day. This suggests a short term reversal.
Concealing Baby Swallow Bullish
Pattern: Reversal
Trend: Bullish
Reliability: High
How to Identify it
• The first two days are Black Marubozu days
• The third day is black day that gaps downward, but trades into the body of the
second day
• The fourth day is a Black Marubozu day that engulfs the third day
What it Means
In a strong downtrend, highlighted by two consecutive Black Marubozu days, a gapping black day
trades into the body of the previous day. The last day, another Black Marubozu, shows investors
selling off, as it closes at a new low. This provides an opening for the shorts to cover their
positions. A bullish reversal should ensue.
17. 17
Doji Star Bullish
Pattern: Reversal
Trend: Bullish
Reliability: Moderate
How to Identify it
• First day is a long black day
• Second day is a doji that gaps in the direction of the previous trend
• The shadows of the doji should not be long
What it Means
In a downtrend, the market bolsters the bears with a long black day and gaps open on the second
day. However, the second day trades within a small range and closes at or near its open. This
scenario generally shows the potential for a rally, as many positions have been changed.
Confirmation of the trend reversal would be a higher open on the next trading day.
Hammer / Dragonfly Doji Bullish
Pattern: Reversal
Trend: Bullish
Reliability: Low/Moderate
How to Identify it
• Small real body at the upper end of the trading range
• Lower shadow at least twice as long as the real body
• No (or almost no) upper shadow
What it Means
There is a sharp sell off after the market opens during a downtrend. However, by the end of the
trading day, the market closes at or near its high for the day. This signifies a weakening of the
previous bearish sentiment, especially if the real body is white (the close is higher than the open
price). Since the certainty for a Hammer indicator is low, the trend reversal can be confirmed by a
higher open and an even higher close on the next trading day. If the open and the close are
identical, the indicator is considered a Dragonfly Doji. The Dragonfly Doji has a higher reliability
associated with it than a Hammer.
Engulfing Bullish
18. 18
Pattern: Reversal
Trend: Bullish
Reliability: Moderate
How to Identify it
• A long black day occurs
• The second day is a white that completely engulfs the real body of the first day
What it Means
Occurring in a downtrend, the Engulfing depicts an opening at a new low, followed by a high buy-
in that closes at or above the previous day’s open. This signifies that the downtrend has lost
momentum and the bulls may be gaining strength. The Engulfing indicator is also the first two
days of the Three Outside patterns.
Inverted Hammer / Gravestone Doji Bullish
Pattern: Reversal
Trend: Bullish
Reliability: Low/Moderate
How to Identify it
• Small real body at the lower end of the trading range
• Upper shadow usually no more than twice as long as the real body
• No (or almost no) lower shadow
What it Means
As the market opens below the close of the previous day, the bulls rally briefly, but not enough to
close above the previous day’s close. As this leaves shorts in a losing position, the Inverted
Hammer presents the potential for an upcoming rally. Confirmation of the trend reversal would by
an opening above the body of the Inverted Hammer on the next trading day. If the open and the
close are identical, the indicator is considered a Gravestone Doji. The Gravestone Doji has a
higher reliability associated with it than an Inverted Hammer.
Hammer / Dragonfly Doji Bullish
19. 19
Pattern: Reversal
Trend: Bullish
Reliability: Low/Moderate
How to Identify it
• Small real body at the upper end of the trading range
• Lower shadow at least twice as long as the real body
• No (or almost no) upper shadow
What it Means
There is a sharp sell off after the market opens during a downtrend. However, by the end of the
trading day, the market closes at or near its high for the day. This signifies a weakening of the
previous bearish sentiment, especially if the real body is white (the close is higher than the open
price). Since the certainty for a Hammer indicator is low, the trend reversal can be confirmed by a
higher open and an even higher close on the next trading day. If the open and the close are
identical, the indicator is considered a Dragonfly Doji. The Dragonfly Doji has a higher reliability
associated with it than a Hammer.
Harami Bullish
Pattern: Reversal
Trend: Bullish
Reliability: Low
How to Identify it
• A long black day occurs
• The second day is a white day where the real body is completely engulfed by the
real body of the first
What it Means
After a long black day at the low end of a downtrend, a white candlestick opens higher than the
previous day’s close. The price is driven up, as many shorts are covered, which encourages
further buy-ins. The Harami indicator should be confirmed with the next trading day’s candlestick
following the reversal trend. The Harami pattern is also the first two days of the Three Inside
patterns.
Harami Cross Bullish
20. 20
Pattern: Reversal
Trend: Bullish
Reliability: Low
How to Identify it
• A long black day occurs
• The second day is a doji within the real body of the previous day
What it Means
After a long black day at the low end of a downtrend, the market opens higher than the previous
day’s close and closes at the open. The Harami Cross indicator is more definite than the basic
Harami indicator, and signifies a reversal for the bulls.
Homing Pigeon Bullish
Pattern: Reversal
Trend: Bullish
Reliability: Moderate
How to Identify it
• The first day is a long black day
• The second day is a smaller black day that is within the body of the first day
What it Means In a downtrend, the bears continue to have their way. However, the second day
opening and closing within the body of the first day suggests an erosion of the downtrend.
Ensuing sell-offs, followed by buy-ins could result in a bullish reversal.
Inverted Hammer / Gravestone Doji Bullish
Pattern: Reversal
Trend: Bullish
Reliability: Low/Moderate
How to Identify it
• Small real body at the lower end of the trading range
• Upper shadow usually no more than twice as long as the real body
• No (or almost no) lower shadow
What it Means
21. 21
As the market opens below the close of the previous day, the bulls rally briefly, but not enough
to close above the previous day’s close. As this leaves shorts in a losing position, the Inverted
Hammer presents the potential for an upcoming rally. Confirmation of the trend reversal would by
an opening above the body of the Inverted Hammer on the next trading day. If the open and the
close are identical, the indicator is considered a Gravestone Doji. The Gravestone Doji has a
higher reliability associated with it than an Inverted Hammer.
Kicking Bullish
Pattern: Reversal
Trend: Bullish
Reliability: High
How to Identify it
• The first day is a Black Marubuzo day
• The second day is a White Marubuzo day that gaps upward
What it Means
This pattern is a strong sign that the market is headed upward. With this indicator, the previous
market direction is not as important as with other indicators.
Ladder Bottom Bullish
Pattern: Reversal
Trend: Bullish
Reliability: Moderate
How to Identify it
• Three black days occur with consecutively lower opens and closes
• The fourth day is black with some upper shadow
• The fifth day is a white day that opens above the body of the fourth day
What it Means
In a considerable downtrend, the shorts may have a chance to sell and take in any profits by the
fourth day. This results in a gap upward on the fifth day. If the body of the fifth day is long, or the
volume of trading is high, a bullish reversal has likely occurred.
Mat Hold Bullish
22. 22
Pattern: Continuation
Trend: Bullish
Reliability: High
How to Identify it
• The first day is a long white day
• The second day gaps up and is a black day
• The second, third, and fourth days have small real bodies and follow a brief
downtrend pattern, but stay within the range of the first day
• The fifth day is a long white day that closes above the close of the first day
What it Means
The Mat Hold pattern is similar to the Rising Three Methods pattern. In an uptrend, a long white
day occurs, following by three days of small real bodies that fall into a short downtrend. On the
fifth day, the bulls come in strong to close at a new high. It appears that attempts to reverse the
trend occurred, but failed. The upward trend should continue.
Matching Low Bullish
Pattern: Reversal
Trend: Bullish
Reliability: Moderate
How to Identify it
• The first day is a long black day
• The second day is a black day with a close equivalent to the first day’s close
What it Means In a downtrend two black days occur with equal closes. This suggests short-
term support, and can cause a reversal on the next day of trading.
Meeting Lines Bullish
Pattern: Reversal
Trend: Bullish
Reliability: Moderate
How to Identify it
• The first day is a long black day, and has a body that is lower than the previous trend
23. 23
• The second day is a long white day, and has a body that is also lower than the
previous trend.
• Both days have identical closes
What it Means In a downtrend two days open below the previous trend. Even though the
second day open low, it rallies to close at the close of the previous day. This typically means a
benchmark has be defined by traders, and a reversal is likely.
Morning Doji Star Bullish
Pattern: Reversal
Trend: Bullish
Reliability: High
How to Identify it
• First day is a long black day
• Second day is a doji that gaps in the direction of the previous trend
• The third day is a white day
What it Means In a downtrend, the market bolsters the bearish trend with a long black day and
gaps open on the second day. However, the second day trades within a small range and closes at
or near its open. This scenario generally shows the potential for a rally, as many positions have
been changed. Confirmation of the trend reversal is given by the white third day. The Morning Doji
Star is a fully realized bullish Doji Star pattern.
Morning Star Bullish
Pattern: Reversal
Trend: Bullish
Reliability: High
How to Identify it
• First day is a long black day
• Second day is a small day that gaps in the direction of the previous trend
• The third day is a white day
What it Means In a downtrend, the market bolsters the bearish trend with a long black day
and gaps open on the second day. However, the second day trades within a small range and
closes at or near its open. This scenario generally shows the potential for a rally, as many
positions have been changed. Confirmation of the trend reversal is given by the white third day.
Piercing Line Bullish
24. 24
Pattern: Reversal
Trend: Bullish
Reliability: Moderate
How to Identify it
• First day is a long black day
• Second day is a white day with an open below previous days low
• Second days close is within but above the midpoint of the first days body
What it Means In a downtrend the market gaps open, but rallies strong to close above the
previous days midpoint. This pattern suggests an opportunity for the bulls to enter the market and
support the trend reversal. The Piercing Line pattern is the opposite of the Dark Cloud Cover.
Rising Three Methods Bullish
Pattern: Continuation
Trend: Bullish
Reliability: High
How to Identify it
• The first day is a long white day
• The second, third, and fourth days have small real bodies and follow a brief
downtrend pattern, but stay within the range of the first day
• The fifth day is a long white day that closes above the close of the first day
What it Means In an uptrend, a long white day occurs, following by three days of small real
bodies that fall into a short downtrend. On the fifth day, the bulls come in strong to close at a new
high. This small downtrend, in between two long white days, is consistent with investors taking a
break. The upward trend should continue.
Separating Lines Bullish
Pattern: Continuation
Trend: Bullish
Reliability: Low
How to Identify it
• The first day is a black day
• The second day is a white day that has the same opening price as the first day
25. 25
What it Means In an uptrend a long black day occurs. The second day, however, picks up
where the previous day’s trading left off and rallies to close higher. This suggests that the uptrend
should remain intact.
Side-by-Side White Lines Bullish
Pattern: Continuation
Trend: Bullish
Reliability: High
How to Identify it
• The first day is a white day
• The second day is a white day that gaps up
• The third day is a white day of about the same body length and close as the second
day
What it Means In an uptrend three white days occur with an upward gap between the first two
and a similar body length and close for the last two. This suggests a definite building of the
uptrend.
Stick Sandwich Bullish
Pattern: Reversal
Trend: Bullish
Reliability: Moderate
How to Identify it
• The first day is a black day
• The second day is a white day that trades above the close of the first day
• The third day is a black day with a close equivalent to the first day
What it Means This pattern shows three days consecutive higher opens, but results in an
eventual close equal to the first day’s close. This pattern is indicative of the market finding a
support price. The overall trend has the potential to reverse, building on the new support price.
Three Inside Up Bullish
26. 26
Pattern: Reversal
Trend: Bullish
Reliability: High
How to Identify it
• A bullish Harami pattern occurs in the first two days
• The third day is a white day with a higher close than the second day
What it Means This pattern is a more reliable addition to the standard Harami pattern. The
third day is confirmation of the bullish trend reversal.
Three-Line Strike Bullish
Pattern: Continuation
Trend: Bullish
Reliability: Low
How to Identify it
• Three long white days occur with consecutively higher closes
• The fourth day opens higher and closes below the open of the first day
What it Means The black day drives prices back to where they were at the start of the pattern.
If the bullish trend was strong before the pattern, then it should continue.
Three Outside Up Bullish
Pattern: Reversal
Trend: Bullish
Reliability: High
How to Identify it
• A bullish Engulfing pattern occurs in the first two days
• The third day is a white day with a higher close than the second day
What it Means This pattern is a more reliable addition to the standard Engulfing pattern. The
third day is confirmation of the bullish trend reversal.
Three Stars in the South Bullish
27. 27
Pattern: Reversal
Trend: Bullish
Reliability: Moderate
How to Identify it
• The first day is a long black day with a long lower shadow
• The second day is a black day similar to the first, but smaller, with a low above the
first days low
• The third day is a small Black Marubozu that lies within the second days trading
range
What it Means In a downtrend three black days occur. However each day is consecutively
weaker within the trend, suggesting that some buying is occurring. Small rallies on each day keep
the market’s lows from reaching that of the first day. All indications are that the tide is slowly
turning toward the bulls.
Three White Soldiers Bullish
Pattern: Reversal
Trend: Bullish
Reliability: High
How to Identify it
• Three long white days occur, each with a higher close than the previous day
• Each day opens within the body of the previous day and closes near the high of the
day
What it Means In a downtrend three long white days occur with consecutively higher closes.
Generally this suggests future market fortitude, as a reversal is in progress that is building on
moderate upward steps.
Tri Star Bullish
Pattern: Reversal
Trend: Bullish
Reliability: Moderate
How to Identify it
28. 28
• A doji occurs on three consecutive trading days
• The second doji gaps below the first and third
What it Means In an long downtrend, the market shows signs of a rally as the real bodies have
grown progressively smaller. The trend culminates with the bullish Tri Star, identifying that many
bearish positions may be reversing.
Unique Three River Bottom Bullish
Pattern: Reversal
Trend: Bullish
Reliability: Moderate
How to Identify it
• The first day is a long black day
• The second is a black Harami day, with a shadow that sets a new low
• The third day is a short white day which closes below the close of the second day
What it Means Two black days occur consecutively, with the second day’s body within that of
the first day. However, the long lower shadow shows the bearish tide may be reversing. The third
day opens lower, reinforcing the indecision of the market and ends in a rally. The bulls should take
over.
Upside Gap Three Methods Bullish
Pattern: Continuation
Trend: Bullish
Reliability: Moderate
How to Identify it
• Two long white days occur with a gap between them
• The third day is a black day that fills the gap between the first two days
What it Means An uptrend is followed by two long white days with a gap upward between
them. The third day is a black day, but one that closes the gap between the first two. This should
be seen as support for the upward trend, and may be caused by temporary profit taking.
Upside Tasuki Gap Bullish
29. 29
Pattern: Continuation
Trend: Bullish
Reliability: Moderate
How to Identify it
• The first two days are white days with an opening gap
• The third day is a black day that opens within the body of the second day and closes
within the gap of the first two days
What it Means In an uptrend a white day occurs, followed by another white day that gaps up. A
black day ensues, and is likely the result of temporary profit taking. The trend should continue to
follow the direction of the upward gap.
Bearish Indicators
Abandoned Baby Bearish
Pattern: Reversal
Trend: Bearish
Reliability: High
How to Identify it
• First day is usually a long white day
• Second day is a doji that gaps in the direction of the previous trend
• The third day is a black day, gapping in the opposite direction, with no overlapping
shadows
What it Means In an uptrend, the market builds strength on a long white day and gaps open on
the second day. However, the second day trades within a small range and closes at or near its
open. This scenario definitely shows an erosion of confidence in the current trend. Confirmation of
the trend reversal is the black third day, which is given extra validation by the downward gap.
Advance Block Bearish
30. 30
Pattern: Reversal
Trend: Bearish
Reliability: Moderate
How to Identify it
• Three long white days occur, each with a higher close than the previous day
• Each day opens within the body of the previous day and closes near the high of the
day
• Each days body is significantly smaller than the previous days body
• The second and third days should exhibit long upper shadows
What it Means In an uptrend three long days occur with consecutively higher closes. This
pattern is similar to the Three White Soldiers pattern, however, in this case, each successive day
is weaker than the one preceding it. This suggests that the previous rally is losing strength, and
preparing for a reversal.
Belt Hold Bearish
Pattern: Reversal
Trend: Bearish
Reliability: Low
How to Identify it
• A black body occurs in an uptrend with no upper shadow
What it Means In an uptrend, a black body occurs with an open that is also the high for the day.
This may cause many positions to be sold, perpetuating a bearish reversal.
Breakaway Bearish
Pattern: Reversal
Trend: Bearish
Reliability: Moderate
How to Identify it
• The first day is a long white day
• The second day is a white day that gaps above the first day
31. 31
• The third and fourth days continue to in the direction of the second with higher
consecutive closes
• The fifth day is a long black day that closes into the gap between the first and
second days
What it Means An uptrend sees a bullish surge that eventually weakens. The result is a long
black day that does not close the gap into the body of the first day. This suggests a short-term
reversal.
Dark Cloud Cover Bearish
Pattern: Reversal
Trend: Bearish
Reliability: High
How to Identify it
• First day is a long white day
• Second day is black with an open above the high of the previous day
• Second day closes within but below the midpoint of the first day’s body
What it Means In an uptrend the market gaps open, but loses ground to fall below the midpoint
of the previous day. The Dark Cloud Cover pattern suggests an opportunity for the shorts to
capitalize on the next day’s open: a warning sign to bullish investors. The Dark Cloud Cover
pattern is the opposite of the Piercing line pattern.
Deliberation Bearish
Pattern: Reversal
Trend: Bearish
Reliability: Moderate
How to Identify it
• Two long white days occur, the second with a higher close than the first
• A third white day is a spinning top or doji that gaps above the second day
What it Means In an uptrend three white days occur with consecutively higher closes. This
pattern is a derivative of the Three White Soldiers pattern and is very similar to the Advance Block
pattern. Even though an uptrend continues, the small third body suggests that the previous rally is
losing strength and preparing for a reversal.
32. 32
Downside Gap Three Methods Bearish
Pattern: Continuation
Trend: Bearish
Reliability: Moderate
How to Identify it
• Two long black days occur with a gap between them
• The third day is a white day that fills the gap between the first two days
What it Means A downtrend is followed by two long black days with a gap downward between
them. The third day is a white day, but one that closes the gap between the first two. This should
be seen as support for the downward trend.
Downside Tasuki Gap Bearish
Pattern: Continuation
Trend: Bearish
Reliability: Moderate
How to Identify it
• The first two days are black days with an opening gap
• The third day is a white day that opens within the body of the second day and closes
within the gap of the first two days
What it Means In a downtrend a black day occurs, followed by another black day that gaps
down. A white day ensues, and is likely the result of investors temporarily taking advantage of the
low buying price. The trend should continue to follow the direction of the downward gap.
Doji Star Bearish
Pattern: Reversal
Trend: Bearish
Reliability: Moderate
33. 33
How to Identify it
• First day is a long white day
• Second day is a doji that gaps in the direction of the previous trend
• The shadows of the doji should not be long
What it Means In an uptrend, the market builds strength on a long white day and gaps open on
the second day. However, the second day trades within a small range and closes at or near its
open. This scenario generally shows erosion of confidence in the current trend. Confirmation of a
trend reversal would be a lower open on the next trading day.
Hanging Man / Dragonfly Doji Bearish
Pattern: Reversal
Trend: Bearish
Reliability: Low/Moderate
How to Identify it
• Small real body at the upper end of the trading range
• Lower shadow at least twice as long as the real body
• No (or almost no) upper shadow
What it Means There is a sharp sell off after the market opens during an uptrend. However, by
the end of the trading day, the market closes at or near its high for the day. This signifies the
potential for further sell-offs. Since the certainty for a Hanging Man indicator is low, the trend
reversal can be confirmed by a black candlestick or a large down gap on the next trading day
accompanied by a lower close. If the open and the close are identical, the indicator is considered
a Dragonfly Doji. The Dragonfly Doji has a higher reliability associated with it than a Hanging Man.
Engulfing Bearish
Pattern: Reversal
Trend: Bearish
Reliability: Moderate
How to Identify it
• A long white day occurs
• The second day is a black day that completely engulfs the real body of the first day
What it Means Occurring in an uptrend, the Engulfing depicts an opening at a new high,
followed by a high volume sell-off that closes at or below the previous day’s open. This signifies
that the uptrend has been hurt and the bears may be gaining strength. The Engulfing indicator is
also the first two days of the Three Outside patterns.
Evening Doji Star Bearish
34. 34
Pattern: Reversal
Trend: Bearish
Reliability: High
How to Identify it
• First day is a long white day
• Second day is a doji that gaps in the direction of the previous trend
• The third day is a black day
What it Means In an uptrend, the market builds strength on a long white day and gaps open on
the second day. However, the second day trades within a small range and closes at or near its
open. This scenario generally shows an erosion of confidence in the current trend. Confirmation of
the trend reversal is the black third day. The Evening Doji Star indicator is the fully realized
bearish Doji Star pattern.
Evening Star Bearish
Pattern: Reversal
Trend: Bearish
Reliability: High
How to Identify it
• First day is a long white day
• Second day is a small day that gaps in the direction of the previous trend
• The third day is a black day
What it Means In an uptrend, the market builds strength on a long white day and gaps open on
the second day. However, the second day trades within a small range and closes at or near its
open. This scenario generally shows an erosion of confidence in the current trend. Confirmation of
the trend reversal is the black third day.
Falling Three Methods Bearish
Pattern: Continuation
Trend: Bearish
Reliability: High
How to Identify it
• The first day is a long black day
35. 35
• The second, third, and fourth days have small real bodies and follow a brief
uptrend pattern, but stay within the range of the first day
• The fifth day is a long black day that closes below the close of the first day
What it Means In a downtrend, a long black day occurs, following by three days of small real
bodies that fall into a short uptrend. On the fifth day, the bears come in strong to close at a new
low. This small uptrend, in between two long black days, is consistent with investors taking a
break. The downward should continue.
Shooting Star / Gravestone Doji Bearish
Pattern: Reversal
Trend: Bearish
Reliability: Low/Moderate
How to Identify it
• Small real body at the lower end of the trading range
• Prices gap open
• Upper shadow usually at least three times as long as the real body
• No (or almost no) lower shadow
What it Means The market gaps open above the previous day’s close in an uptrend. It rallies to
a new high then loses strength and closes near its low: a bearish change of momentum.
Confirmation of the trend reversal would by an opening below the body of the Shooting Star on
the next trading day. If the open and the close are identical, the indicator is considered a
Gravestone Doji. The Gravestone Doji has a higher reliability associated with it than a Shooting
Star.
Hanging Man / Dragonfly Doji Bearish
Pattern: Reversal
Trend: Bearish
Reliability: Low/Moderate
How to Identify it
• Small real body at the upper end of the trading range
• Lower shadow at least twice as long as the real body
• No (or almost no) upper shadow
What it Means There is a sharp sell off after the market opens during an uptrend. However, by
the end of the trading day, the market closes at or near its high for the day. This signifies the
potential for further sell-offs. Since the certainty for a Hanging Man indicator is low, the trend
reversal can be confirmed by a black candlestick or a large down gap on the next trading day
accompanied by a lower close. If the open and the close are identical, the indicator is considered
a Dragonfly Doji. The Dragonfly Doji has a higher reliability associated with it than a Hanging Man.
36. 36
Harami Bearish
Pattern: Reversal
Trend: Bearish
Reliability: Low
How to Identify it
• A long white day occurs
• The second day is a black day that is completely engulfed by the real body of the
first day
What it Means After a long white day at the high end of an uptrend, a black candlestick opens
lower than the previous day’s close. Trading is typically light and the day ends with a close lower
than the open and within body of the first day; a signal that the current uptrend is losing strength.
The Harami indicator should be confirmed with the next trading day’s candlestick following the
reversal trend. The Harami pattern is also the first two days of the Three Inside patterns.
Harami Cross Bearish
Pattern: Reversal
Trend: Bearish
Reliability: Moderate
How to Identify it
• A long white day occurs
• The second day is a doji that is within the range of the previous day’s real body
What it Means After a long white day at the high end of an uptrend, the market opens lower
than the previous day’s close. Trading is typically light and the day ends with a close at the same
price as the open and within body of the first day; an even stronger signal than the basic Harami
pattern that the current uptrend is losing strength.
Identical Three Crows Bearish
37. 37
Pattern: Reversal
Trend: Bearish
Reliability: High
How to Identify it
• Three black days occur, each with a close below the previous day
• Each day opens at the close of the previous day
What it Means In an uptrend three long black days occur that open at the previous day’s close.
This pattern is similar to the Three Black Crows pattern but typifies a more severe loss of buying
power. A bearish trend is almost certain.
In Neck Bearish
Pattern: Continuation
Trend: Bearish
Reliability: Moderate
How to Identify it
• The first day is a long black day
• The second is a white day that opens below the low of the previous day and closes
barely above or equal to the close of the previous day
What it Means The In Neck pattern is a less severe relative of the On Neck pattern. A small
rally is built by the second day, but ends near the close of the previous black day. Although, as in
the case of the On Neck pattern, the downtrend should prevail, it may take longer to evolve.
Kicking Bearish
Pattern: Reversal
Trend: Bearish
Reliability: High
How to Identify it
• The first day is a White Marubuzo day
38. 38
• The second day is a Black Marubuzo day that gaps downward
What it Means This pattern is a strong sign that the market is headed downward. With this
indicator, the previous market direction is not as important as with other indicators.
Meeting Lines Bearish
Pattern: Reversal
Trend: Bearish
Reliability: Moderate
How to Identify it
• The first day is a long white day, and has a body that is above the previous trend
• The second day is a long black day, and has a body that is also above the previous
trend.
• Both days have identical closes
What it Means In an uptrend two days open above the previous trend. Even though the second
day opens high, it rallies to close at the close of the previous day. This typically means a
benchmark has be defined by traders, and a reversal is likely. The bearish Meeting Lines pattern
is similar to, but less reliable than the Dark Cloud Cover pattern.
On Neck Bearish
Pattern: Continuation
Trend: Bearish
Reliability: Moderate
How to Identify it
• The first day is a long black day
• The second is a white day (not long) that opens below the low of the previous day
and closes at the low of the previous day
What it Means The On Neck pattern is typical in a downtrend. The fact that a small rally is built
by the second day, but ends at the low of the previous black day indicates that the bears should
prevail.
Separating Lines Bearish
39. 39
Pattern: Continuation
Trend: Bearish
Reliability: Low
How to Identify it
• The first day is a white day
• The second day is a black day that has the same opening price as the first day
What it Means In downtrend a long white day occurs. The second day, however, picks up
where the previous day’s trading left off and rallies to close lower. This suggests that the
downtrend should remain intact.
Shooting Star / Gravestone Doji Bearish
Pattern: Reversal
Trend: Bearish
Reliability: Low/Moderate
How to Identify it
• Small real body at the upper end of the trading range
• Prices gap open
• Upper shadow usually at least three times as long as the real body
• No (or almost no) lower shadow
What it Means The market gaps open above the previous day’s close in an uptrend. It rallies to
a new high then loses strength and closes near its low: a bearish change of momentum.
Confirmation of the trend reversal would by an opening below the body of the Shooting Star on
the next trading day. If the open and the close are identical, the indicator is considered a
Gravestone Doji. The Gravestone Doji has a higher reliability associated with it than a Shooting
Star.
Side-by-Side White Lines Bearish
Pattern: Continuation
Trend: Bearish
Reliability: Moderate
How to Identify it
40. 40
• The first day is a black day
• The second day is a white day that gaps down
• The third day is a white day of about the same body length and close as the second
day
What it Means In a downtrend a black day is followed by two white that are gapped below the
first day. This typically means the shorts are covering their positions, and no reversal is about to
occur. The downtrend should remain intact for the near future.
Three Black Crows Bearish
Pattern: Reversal
Trend: Bearish
Reliability: High
How to Identify it
• Three black days occur, each with a close below the previous day
• Each day opens within the body of the previous day
• Each day closes near or at its lows
What it Means In an uptrend three long black days occur with consecutively lower closes. This
pattern suggests that the market has been at a high price for too long, and investors are beginning
to compensate for it.
Three Inside Down Bearish
Pattern: Reversal
Trend: Bearish
Reliability: High
How to Identify it
• A bearish Harami pattern occurs in the first two days
• The third day is a black day with a lower close than the second day
What it Means This pattern is a more reliable addition to the standard Harami pattern. The third
day is confirmation of the bearish trend reversal.
Three-Line Strike Bearish
41. 41
Pattern: Continuation
Trend: Bearish
Reliability: Low
How to Identify it
• Three long black days occur with consecutively lower closes
• The fourth day opens lower, but closes above the open of the first day
What it Means The white day drives prices back to where they were at the start of the pattern.
If the bearish trend was strong before the pattern, then it should continue.
Three Outside Down Bearish
Pattern: Reversal
Trend: Bearish
Reliability: High
How to Identify it
• A bearish Engulfing pattern occurs in the first two days
• The third day is a black day with a lower close than the second day
What it Means This pattern is a more reliable addition to the standard Engulfing pattern. The
third day is confirmation of the bearish trend reversal.
Thrusting Bearish
Pattern: Continuation
Trend: Bearish
Reliability: Low
How to Identify it
• The first day is a long black day
• The second is a white day that opens below the low of the previous day and closes
into the body of the previous day, but below the midpoint
What it Means The Thrusting pattern is a weaker relative of the On Neck and In Neck
continuation patterns. A rally is built by the second day, and closes well into the body of the
previous black day. However, since the second day’s close doesn’t even reach the midpoint of the
first day’s body, the bulls will likely be discouraged and the downtrend will continue.
42. 42
Tri Star Bearish
Pattern: Reversal
Trend: Bearish
Reliability: Moderate
How to Identify it
• A doji occurs on three consecutive trading days
• The second doji gaps above the first and third
What it Means In an long uptrend, the market shows signs of weakness as the real bodies have
grown progressively smaller. The trend culminates with the Tri Star, identifying that there is little
strength left, and signaling a return of the bears.
Two Crows Bearish
Pattern: Reversal
Trend: Bearish
Reliability: Moderate
How to Identify it
• The first day is a long white day
• The second day is a black day that gaps above the first day
• The third day is a black day that opens within the body of the second day and closes
within the body of the first day
What it Means In an uptrend the market closes lower after an opening gap upwards. This is
followed by another black day which fills the gap. The Two Crows pattern suggests the erosion of
the uptrend, and foreshadows a trend reversal.
Upside Gap Two Crows Bearish
Pattern: Reversal
Trend: Bearish
Reliability: High
How to Identify it
43. 43
• The first day is a long white day continuing in an uptrend
• The second day is black and gaps up
• The third day is also black and engulfs the previous black day, but still closes above
the first day
What it Means In an uptrend the market falters, but still closes above the previous day’s close.
The next day, it falters more but remains above the first day’s close. This is a signal that the
market can no longer hold its position and is in for a bearish ride.
Bullish Patterns
Abandoned Baby Belt Hold
Breakaway
Hammer/
Engulfing Dragonfly Doji
Concealing Baby
Swallow
Harami Harami Cross Homing Pigeon
Inverted Hammer/
Gravestone Doji Kicking
Ladder Bottom
Matching Low Morning Doji Star
Meeting Lines
44. 44
Piercing Line Stick Sandwich
Morning Star
Three Inside Up Three Outside Up
Three Stars In The South
Tri Star Unique Three River
Doji Star
Bottom
Rising Three Methods
Mat Hold Separating Lines
Side By Side White Three White Soldiers Upside Gap Three
Lines Methods
Three Line Strike
Upside Tasuki Gap
45. 45
Bearish Patterns
Abandoned Baby Advance Block Belt Hold
Dark Cloud Cover
Breakaway
Deliberation
Engulfing Evening Doji Star
Evening Star
Hanging Man/
Dragonfly Doji Harami Harami Cross
Kicking Meeting Lines
Identical Three Crows
Shooting Star/ Three Inside Down Three Outside Down
Gravestone Doji
46. 46
Tri Star
Two Crows Upside Gap Two Crows
Doji Star
Downside Gap Three
Methods Downside Tasuki Gap
Falling Three Methods
In Neck On Neck
Separating Lines Three Black Crows
Side By Side White Lines
Three Line Strike Thrusting
47. 47
Introduction to Candlesticks
Print
History
The Japanese began using technical analysis to trade rice in the 17th century. While this early version of
technical analysis was different from the US version initiated by Charles Dow around 1900, many of the
guiding principles were very similar:
• The "what" (price action) is more important than the "why" (news, earnings, and so on).
• All known information is reflected in the price.
• Buyers and sellers move markets based on expectations and emotions (fear and greed).
• Markets fluctuate.
• The actual price may not reflect the underlying value.
According to Steve Nison, candlestick charting first appeared sometime after 1850. Much of the credit for
candlestick development and charting goes to a legendary rice trader named Homma from the town of
Sakata. It is likely that his original ideas were modified and refined over many years of trading eventually
resulting in the system of candlestick charting that we use today.
Formation
In order to create a candlestick chart, you must have a data set that contains open, high, low and close
values for each time period you want to display. The hollow or filled portion of the candlestick is called
"the body" (also referred to as "the real body"). The long thin lines above and below the body represent the
high/low range and are called "shadows" (also referred to as "wicks" and "tails"). The high is marked by the
top of the upper shadow and the low by the bottom of the lower shadow. If the stock closes higher than
its opening price, a hollow candlestick is drawn with the bottom of the body representing the opening price
48. 48
and the top of the body representing the closing price. If the stock closes lower than its opening price, a
filled candlestick is drawn with the top of the body representing the opening price and the bottom of the
body representing the closing price.
Compared to traditional bar charts, many traders consider candlestick charts more visually appealing and
easier to interpret. Each candlestick provides an easy-to-decipher picture of price action. Immediately a
trader can see compare the relationship between the open and close as well as the high and low. The
relationship between the open and close is considered vital information and forms the essence of
candlesticks. Hollow candlesticks, where the close is greater than the open, indicate buying pressure. Filled
candlesticks, where the close is less than the open, indicate selling pressure.
Long versus Short Bodies
Generally speaking, the longer the body is, the more intense the buying or selling pressure. Conversely,
short candlesticks indicate little price movement and represent consolidation.
49. 49
Long white candlesticks show strong buying pressure. The longer the white candlestick is, the further the
close is above the open. This indicates that prices advanced significantly from open to close and buyers
were aggressive. While long white candlesticks are generally bullish, much depends on their position within
the broader technical picture. After extended declines, long white candlesticks can mark a potential turning
point or support level. If buying gets too aggressive after a long advance, it can lead to excessive
bullishness.
Long black candlesticks show strong selling pressure. The longer the black candlestick is, the further the
close is below the open. This indicates that prices declined significantly from the open and sellers were
aggressive. After a long advance, a long black candlestick can foreshadow a turning point or mark a future
resistance level. After a long decline a long black candlestick can indicate panic or capitulation.
Even more potent long candlesticks are the Marubozu brothers, Black and White. Marubozu do not have
upper or lower shadows and the high and low are represented by the open or close. A White Marubozu
forms when the open equals the low and the close equals the high. This indicates that buyers controlled the
price action from the first trade to the last trade. Black Marubozu form when the open equals the high and
the close equals the low. This indicates that sellers controlled the price action from the first trade to the last
trade.
50. 50
Long versus Short Shadows
The upper and lower shadows on candlesticks can provide valuable information about the trading session.
Upper shadows represent the session high and lower shadows the session low. Candlesticks with short
shadows indicate that most of the trading action was confined near the open and close. Candlestick with
long shadows show that traded extended well past the open and close.
Candlesticks with a long upper shadow and short lower shadow indicate that buyers dominated during the
session, and bid prices higher. However, sellers later forced prices down from their highs, and the weak
close created a long upper shadow. Conversely, candlesticks with long lower shadows and short upper
shadows indicate that sellers dominated during the session and drove prices lower. However, buyers later
resurfaced to bid prices higher by the end of the session and the strong close created a long lower shadow.
Candlesticks with a long upper shadow, long lower shadow and small real body are called spinning tops.
One long shadow represents a reversal of sorts; spinning tops represent indecision. The small real body
(whether hollow or filled) shows little movement from open to close, and the shadows indicate that both
bulls and bears were active during the session. Even though the session opened and closed with little
51. 51
change, prices moved significantly higher and lower in the meantime. Neither buyers nor sellers could
gain the upper hand and the result was a standoff. After a long advance or long white candlestick, a spinning
top indicates weakness among the bulls and a potential change or interruption in trend. After a long decline
or long black candlestick, a spinning top indicates weakness among the bears and a potential change or
interruption in trend.
Doji
Doji are important candlesticks that provide information on their own and as components of in a number of
important patterns. Doji form when a security's open and close are virtually equal. The length of the upper
and lower shadows can vary and the resulting candlestick looks like a cross, inverted cross or plus sign.
Alone, doji are neutral patterns. Any bullish or bearish bias is based on preceding price action and future
confirmation. The word "Doji" refers to both the singular and plural form.
Ideally, but not necessarily, the open and close should be equal. While a doji with an equal open and close
would be considered more robust, it is more important to capture the essence of the candlestick. Doji
convey a sense of indecision or tug-of-war between buyers and sellers. Prices move above and below the
opening level during the session, but close at or near the opening level. The result is a standoff. Neither
bulls nor bears were able to gain control and a turning point could be developing.
52. 52
Different securities have different criteria for determining the robustness of a doji. A $20 stock could form a
doji with a 1/8 point difference between open and close, while a $200 stock might form one with a 1 1/4
point difference. Determining the robustness of the doji will depend on the price, recent volatility, and
previous candlesticks. Relative to previous candlesticks, the doji should have a very small body that appears
as a thin line. Steven Nison notes that a doji that forms among other candlesticks with small real bodies
would not be considered important. However, a doji that forms among candlesticks with long real bodies
would be deemed significant.
Doji and Trend
The relevance of a doji depends on the preceding trend or preceding candlesticks. After an advance, or long
white candlestick, a doji signals that the buying pressure is starting to weaken. After a decline, or long black
candlestick, a doji signals that selling pressure is starting to diminish. Doji indicate that the forces of supply
and demand are becoming more evenly matched and a change in trend may be near. Doji alone are not
enough to mark a reversal and further confirmation may be warranted.
53. 53
After an advance or long white candlestick, a doji signals that buying pressure may be diminishing and
the uptrend could be nearing an end. Whereas a security can decline simply from a lack of buyers, continued
buying pressure is required to sustain an uptrend. Therefore, a doji may be more significant after an uptrend
or long white candlestick. Even after the doji forms, further downside is required for bearish confirmation.
This may come as a gap down, long black candlestick, or decline below the long white candlestick's open.
After a long white candlestick and doji, traders should be on the alert for a potential evening doji star.
After a decline or long black candlestick, a doji indicates that selling pressure may be diminishing and the
downtrend could be nearing an end. Even though the bears are starting to lose control of the decline, further
strength is required to confirm any reversal. Bullish confirmation could come from a gap up, long white
candlestick or advance above the long black candlestick's open. After a long black candlestick and doji,
traders should be on the alert for a potential morning doji star.
Long-legged Doji
Long-legged doji have long upper and lower shadows that are almost equal in length. These doji reflect a
great amount of indecision in the market. Long-legged doji indicate that prices traded well above and below
54. 54
the session's opening level, but closed virtually even with the open. After a whole lot of yelling and
screaming, the end result showed little change from the initial open.
Dragon Fly Doji
Dragon fly doji form when the open, high and close are equal and the low creates a long lower shadow. The
resulting candlestick looks like a "T" with a long lower shadow and no upper shadow. Dragon fly doji
indicate that sellers dominated trading and drove prices lower during the session. By the end of the session,
buyers resurfaced and pushed prices back to the opening level and the session high.
The reversal implications of a dragon fly doji depend on previous price action and future confirmation. The
long lower shadow provides evidence of buying pressure, but the low indicates that plenty of sellers still
loom. After a long downtrend, long black candlestick, or at support, a dragon fly doji could signal a
potential bullish reversal or bottom. After a long uptrend, long white candlestick or at resistance, the long
lower shadow could foreshadow a potential bearish reversal or top. Bearish or bullish confirmation is
required for both situations.
Gravestone Doji
Gravestone doji form when the open, low and close are equal and the high creates a long upper shadow. The
resulting candlestick looks like an upside down "T" with a long upper shadow and no lower shadow.
Gravestone doji indicate that buyers dominated trading and drove prices higher during the session.
However, by the end of the session, sellers resurfaced and pushed prices back to the opening level and the
session low.
As with the dragon fly doji and other candlesticks, the reversal implications of gravestone doji depend on
previous price action and future confirmation. Even though the long upper shadow indicates a failed rally,
the intraday high provides evidence of some buying pressure. After a long downtrend, long black
candlestick, or at support, focus turns to the evidence of buying pressure and a potential bullish reversal.
After a long uptrend, long white candlestick or at resistance, focus turns to the failed rally and a potential
bearish reversal. Bearish or bullish confirmation is required for both situations.
Before turning to the single and multiple candlestick patterns, there are a few general guidelines to cover.
55. 55
Bulls vs. Bear
A candlestick depicts the battle between Bulls (buyers) and Bears (sellers) over a given period of time. An
analogy to this battle can be made between two football teams, which we can also call the Bulls and the
Bears. The bottom (intra-session low) of the candlestick represents a touchdown for the Bears and the top
(intra-session high) a touchdown for the Bulls. The closer the close is to the high, the closer the Bulls are to
a touchdown. The closer the close is to the low, the closer the Bears are to a touchdown. While there are
many variations, I have narrowed the field to 6 types of games (or candlesticks):
1. Long white candlesticks indicate that the Bulls controlled the ball (trading) for most of the game.
2. Long black candlesticks indicate that the Bears controlled the ball (trading) for most of the game.
3. Small candlesticks indicate that neither team could move the ball and prices finished about where
they started.
4. A long lower shadow indicates that the Bears controlled the ball for part of the game, but lost control
by the end and the Bulls made an impressive comeback.
5. A long upper shadow indicates that the Bulls controlled the ball for part of the game, but lost control
by the end and the Bears made an impressive comeback.
6. A long upper and lower shadow indicates that the both the Bears and the Bulls had their moments
during the game, but neither could put the other away, resulting in a standoff.
What Candlesticks Don't Tell You
Candlesticks do not reflect the sequence of events between the open and close, only the relationship
between the open and the close. The high and the low are obvious and indisputable, but candlesticks (and
bar charts) cannot tell us which came first.