1. LABOR FORCE ESTIMATES
CPS BENCHMARK: 2011 NON SEASONALLY ADJUSTED EMPLOYMENT BENCHMARK: 2011
THESE ESTIMATES ARE PREPARED IN COOPERATION WITH THE U. S. BUREAU OF LABOR STATISTICS (BLS) AND HAVE BEEN ADJUSTED TO
THE CURRENT POPULATION SURVEY (CPS) FOR USE IN ALLOCATING FEDERAL FUNDS. BECAUSE OF IRREGULAR FLUCTUATIONS IN MONTH
TO MONTH CHANGES, THE READER SHOULD USE CAUTION WHEN VIEWING THESE ESTIMATES AS INDICATORS OF ECONOMIC CHANGE.
Seasonally
Adjusted
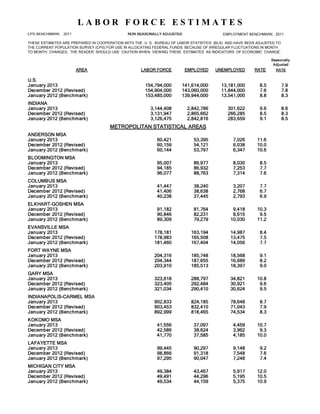
AREA LABOR FORCE EMPLOYED UNEMPLOYED RATE RATE
U.S.
January 2013 154,794,000 141,614,000 13,181,000 8.5 7.9
December 2012 (Revised) 154,904,000 143,060,000 11,844,000 7.6 7.8
January 2012 (Benchmark) 153,485,000 139,944,000 13,541,000 8.8 8.3
INDIANA
January 2013 3,144,408 2,842,786 301,622 9.6 8.6
December 2012 (Revised) 3,131,947 2,865,662 266,285 8.5 8.3
January 2012 (Benchmark) 3,126,475 2,842,816 283,659 9.1 8.5
METROPOLITAN STATISTICAL AREAS
ANDERSON MSA
January 2013 60,421 53,395 7,026 11.6
December 2012 (Revised) 60,159 54,121 6,038 10.0
January 2012 (Benchmark) 60,144 53,797 6,347 10.6
BLOOMINGTON MSA
January 2013 95,007 86,977 8,030 8.5
December 2012 (Revised) 94,185 86,932 7,253 7.7
January 2012 (Benchmark) 96,077 88,763 7,314 7.6
COLUMBUS MSA
January 2013 41,447 38,240 3,207 7.7
December 2012 (Revised) 41,406 38,638 2,768 6.7
January 2012 (Benchmark) 40,238 37,445 2,793 6.9
ELKHART-GOSHEN MSA
January 2013 91,182 81,764 9,418 10.3
December 2012 (Revised) 90,846 82,231 8,615 9.5
January 2012 (Benchmark) 89,309 79,279 10,030 11.2
EVANSVILLE MSA
January 2013 178,181 163,194 14,987 8.4
December 2012 (Revised) 178,983 165,508 13,475 7.5
January 2012 (Benchmark) 181,460 167,404 14,056 7.7
FORT WAYNE MSA
January 2013 204,316 185,748 18,568 9.1
December 2012 (Revised) 204,344 187,655 16,689 8.2
January 2012 (Benchmark) 203,910 185,513 18,397 9.0
GARY MSA
January 2013 323,618 288,797 34,821 10.8
December 2012 (Revised) 323,405 292,484 30,921 9.6
January 2012 (Benchmark) 321,034 290,410 30,624 9.5
INDIANAPOLIS-CARMEL MSA
January 2013 902,833 824,185 78,648 8.7
December 2012 (Revised) 903,453 832,410 71,043 7.9
January 2012 (Benchmark) 892,999 818,465 74,534 8.3
KOKOMO MSA
January 2013 41,556 37,097 4,459 10.7
December 2012 (Revised) 42,586 38,624 3,962 9.3
January 2012 (Benchmark) 41,770 37,585 4,185 10.0
LAFAYETTE MSA
January 2013 99,445 90,297 9,148 9.2
December 2012 (Revised) 98,866 91,318 7,548 7.6
January 2012 (Benchmark) 97,295 90,047 7,248 7.4
MICHIGAN CITY MSA
January 2013 49,384 43,467 5,917 12.0
December 2012 (Revised) 49,491 44,296 5,195 10.5
January 2012 (Benchmark) 49,534 44,159 5,375 10.9
2. AREA LABOR FORCE EMPLOYED UNEMPLOYED RATE
MUNCIE MSA
January 2013 54,839 49,131 5,708 10.4
December 2012 (Revised) 55,118 49,985 5,133 9.3
January 2012 (Benchmark) 53,783 48,492 5,291 9.8
SOUTH BEND MSA
January 2013 147,885 132,323 15,562 10.5
December 2012 (Revised) 150,055 136,033 14,022 9.3
January 2012 (Benchmark) 149,389 134,338 15,051 10.1
TERRE HAUTE MSA
January 2013 78,931 69,581 9,350 11.8
December 2012 (Revised) 78,453 70,129 8,324 10.6
January 2012 (Benchmark) 78,463 70,014 8,449 10.8
COUNTIES
ADAMS
January 2013 14,539 13,258 1,281 8.8
December 2012 (Revised) 14,274 13,151 1,123 7.9
January 2012 (Benchmark) 14,438 13,197 1,241 8.6
ALLEN (FORT WAYNE MSA)
January 2013 173,545 157,771 15,774 9.1
December 2012 (Revised) 173,625 159,391 14,234 8.2
January 2012 (Benchmark) 173,289 157,572 15,717 9.1
BARTHOLOMEW (COLUMBUS MSA)
January 2013 41,447 38,240 3,207 7.7
December 2012 (Revised) 41,406 38,638 2,768 6.7
January 2012 (Benchmark) 40,238 37,445 2,793 6.9
BENTON (LAFAYETTE MSA)
January 2013 4,305 3,861 444 10.3
December 2012 (Revised) 4,241 3,904 337 7.9
January 2012 (Benchmark) 4,241 3,850 391 9.2
BLACKFORD
January 2013 5,931 5,261 670 11.3
December 2012 (Revised) 5,813 5,217 596 10.3
January 2012 (Benchmark) 5,963 5,238 725 12.2
BOONE (INDIANAPOLIS MSA)
January 2013 28,600 26,179 2,421 8.5
December 2012 (Revised) 28,489 26,440 2,049 7.2
January 2012 (Benchmark) 28,142 25,997 2,145 7.6
BROWN (INDIANAPOLIS MSA)
January 2013 7,701 6,845 856 11.1
December 2012 (Revised) 7,538 6,913 625 8.3
January 2012 (Benchmark) 7,558 6,797 761 10.1
CARROLL (LAFAYETTE MSA)
January 2013 9,873 8,844 1,029 10.4
December 2012 (Revised) 9,725 8,944 781 8.0
January 2012 (Benchmark) 9,619 8,819 800 8.3
CASS
January 2013 17,695 15,924 1,771 10.0
December 2012 (Revised) 17,317 15,756 1,561 9.0
January 2012 (Benchmark) 17,500 15,863 1,637 9.4
CLARK (LOUISVILLE MSA)
January 2013 55,541 50,710 4,831 8.7
December 2012 (Revised) 54,839 50,972 3,867 7.1
January 2012 (Benchmark) 55,262 50,000 5,262 9.5
CLAY (TERRE HAUTE MSA)
January 2013 12,542 11,067 1,475 11.8
December 2012 (Revised) 12,399 11,155 1,244 10.0
January 2012 (Benchmark) 12,673 11,136 1,537 12.1
CLINTON
January 2013 16,489 14,860 1,629 9.9
December 2012 (Revised) 16,433 15,086 1,347 8.2
January 2012 (Benchmark) 16,469 14,987 1,482 9.0
Page 2
3. AREA LABOR FORCE EMPLOYED UNEMPLOYED RATE
CRAWFORD
January 2013 5,137 4,482 655 12.8
December 2012 (Revised) 4,989 4,446 543 10.9
January 2012 (Benchmark) 5,060 4,484 576 11.4
DAVIESS
January 2013 14,789 13,741 1,048 7.1
December 2012 (Revised) 14,573 13,617 956 6.6
January 2012 (Benchmark) 14,650 13,777 873 6.0
DEARBORN (CINCINNATI MSA)
January 2013 25,210 22,595 2,615 10.4
December 2012 (Revised) 24,902 22,911 1,991 8.0
January 2012 (Benchmark) 25,488 22,925 2,563 10.1
DECATUR
January 2013 12,776 11,462 1,314 10.3
December 2012 (Revised) 12,296 11,213 1,083 8.8
January 2012 (Benchmark) 12,759 11,460 1,299 10.2
DEKALB
January 2013 19,725 17,816 1,909 9.7
December 2012 (Revised) 19,328 17,577 1,751 9.1
January 2012 (Benchmark) 19,571 17,673 1,898 9.7
DELAWARE (MUNCIE MSA)
January 2013 54,839 49,131 5,708 10.4
December 2012 (Revised) 55,118 49,985 5,133 9.3
January 2012 (Benchmark) 53,783 48,492 5,291 9.8
DUBOIS
January 2013 21,373 19,902 1,471 6.9
December 2012 (Revised) 21,017 19,753 1,264 6.0
January 2012 (Benchmark) 21,247 19,993 1,254 5.9
ELKHART (ELKHART-GOSHEN)
January 2013 91,182 81,764 9,418 10.3
December 2012 (Revised) 90,846 82,231 8,615 9.5
January 2012 (Benchmark) 89,309 79,279 10,030 11.2
FAYETTE
January 2013 9,140 7,977 1,163 12.7
December 2012 (Revised) 9,003 7,959 1,044 11.6
January 2012 (Benchmark) 9,097 7,935 1,162 12.8
FLOYD (LOUISVILLE MSA)
January 2013 37,062 33,789 3,273 8.8
December 2012 (Revised) 36,515 33,963 2,552 7.0
January 2012 (Benchmark) 36,662 33,316 3,346 9.1
FOUNTAIN
January 2013 8,429 7,544 885 10.5
December 2012 (Revised) 8,228 7,481 747 9.1
January 2012 (Benchmark) 8,295 7,532 763 9.2
FRANKLIN (CINCINNATI MSA)
January 2013 11,169 9,998 1,171 10.5
December 2012 (Revised) 10,945 10,138 807 7.4
January 2012 (Benchmark) 11,354 10,144 1,210 10.7
FULTON
January 2013 9,951 8,901 1,050 10.6
December 2012 (Revised) 9,711 8,835 876 9.0
January 2012 (Benchmark) 9,829 8,856 973 9.9
GIBSON (EVANSVILLE MSA)
January 2013 16,319 14,955 1,364 8.4
December 2012 (Revised) 16,410 15,140 1,270 7.7
January 2012 (Benchmark) 16,699 15,395 1,304 7.8
GRANT
January 2013 32,753 29,181 3,572 10.9
December 2012 (Revised) 32,078 28,906 3,172 9.9
January 2012 (Benchmark) 32,287 28,936 3,351 10.4
Page 3
4. AREA LABOR FORCE EMPLOYED UNEMPLOYED RATE
GREENE (BLOOMINGTON MSA)
January 2013 15,243 13,512 1,731 11.4
December 2012 (Revised) 14,929 13,505 1,424 9.5
January 2012 (Benchmark) 15,300 13,789 1,511 9.9
HAMILTON (INDIANAPOLIS MSA)
January 2013 144,589 134,866 9,723 6.7
December 2012 (Revised) 145,252 136,211 9,041 6.2
January 2012 (Benchmark) 142,411 133,930 8,481 6.0
HANCOCK (INDIANAPOLIS MSA)
January 2013 36,592 33,489 3,103 8.5
December 2012 (Revised) 36,472 33,823 2,649 7.3
January 2012 (Benchmark) 36,131 33,256 2,875 8.0
HARRISON (LOUISVILLE MSA)
January 2013 19,804 17,929 1,875 9.5
December 2012 (Revised) 19,377 18,021 1,356 7.0
January 2012 (Benchmark) 19,502 17,678 1,824 9.4
HENDRICKS (INDIANAPOLIS MSA)
January 2013 76,077 70,360 5,717 7.5
December 2012 (Revised) 76,223 71,062 5,161 6.8
January 2012 (Benchmark) 75,129 69,872 5,257 7.0
HENRY
January 2013 21,814 19,341 2,473 11.3
December 2012 (Revised) 21,544 19,367 2,177 10.1
January 2012 (Benchmark) 21,800 19,453 2,347 10.8
HOWARD (KOKOMO MSA)
January 2013 34,407 30,769 3,638 10.6
December 2012 (Revised) 35,370 32,035 3,335 9.4
January 2012 (Benchmark) 34,536 31,174 3,362 9.7
HUNTINGTON
January 2013 18,872 17,094 1,778 9.4
December 2012 (Revised) 19,374 17,757 1,617 8.3
January 2012 (Benchmark) 19,171 17,427 1,744 9.1
JACKSON
January 2013 20,958 19,237 1,721 8.2
December 2012 (Revised) 20,551 19,029 1,522 7.4
January 2012 (Benchmark) 20,933 19,323 1,610 7.7
JASPER (GARY)
January 2013 15,461 13,795 1,666 10.8
December 2012 (Revised) 15,387 13,971 1,416 9.2
January 2012 (Benchmark) 15,307 13,872 1,435 9.4
JAY
January 2013 10,896 9,971 925 8.5
December 2012 (Revised) 10,917 10,095 822 7.5
January 2012 (Benchmark) 10,785 9,896 889 8.2
JEFFERSON
January 2013 15,702 14,228 1,474 9.4
December 2012 (Revised) 15,662 14,327 1,335 8.5
January 2012 (Benchmark) 15,708 14,319 1,389 8.8
JENNINGS
January 2013 13,454 11,842 1,612 12.0
December 2012 (Revised) 13,287 11,921 1,366 10.3
January 2012 (Benchmark) 13,273 11,740 1,533 11.5
JOHNSON (INDIANAPOLIS MSA)
January 2013 72,964 67,235 5,729 7.9
December 2012 (Revised) 72,942 67,906 5,036 6.9
January 2012 (Benchmark) 72,314 66,768 5,546 7.7
KNOX
January 2013 20,555 18,942 1,613 7.8
December 2012 (Revised) 20,000 18,535 1,465 7.3
January 2012 (Benchmark) 20,198 18,856 1,342 6.6
Page 4
5. AREA LABOR FORCE EMPLOYED UNEMPLOYED RATE
KOSCIUSKO
January 2013 39,898 36,546 3,352 8.4
December 2012 (Revised) 39,047 36,101 2,946 7.5
January 2012 (Benchmark) 39,755 36,381 3,374 8.5
LAGRANGE
January 2013 15,253 13,917 1,336 8.8
December 2012 (Revised) 15,037 13,818 1,219 8.1
January 2012 (Benchmark) 15,282 13,854 1,428 9.3
LAKE (GARY )
January 2013 219,446 194,715 24,731 11.3
December 2012 (Revised) 219,279 197,201 22,078 10.1
January 2012 (Benchmark) 217,538 195,802 21,736 10.0
LA PORTE (MICHIGAN CITY MSA)
January 2013 49,384 43,467 5,917 12.0
December 2012 (Revised) 49,491 44,296 5,195 10.5
January 2012 (Benchmark) 49,534 44,159 5,375 10.9
LAWRENCE
January 2013 21,248 18,573 2,675 12.6
December 2012 (Revised) 20,738 18,465 2,273 11.0
January 2012 (Benchmark) 21,066 18,634 2,432 11.5
MADISON (ANDERSON MSA)
January 2013 60,421 53,395 7,026 11.6
December 2012 (Revised) 60,159 54,121 6,038 10.0
January 2012 (Benchmark) 60,144 53,797 6,347 10.6
MARION (INDIANAPOLIS MSA)
January 2013 460,851 416,941 43,910 9.5
December 2012 (Revised) 461,414 421,102 40,312 8.7
January 2012 (Benchmark) 455,976 414,047 41,929 9.2
MARSHALL
January 2013 21,775 19,519 2,256 10.4
December 2012 (Revised) 21,464 19,496 1,968 9.2
January 2012 (Benchmark) 21,584 19,381 2,203 10.2
MARTIN
January 2013 5,270 4,890 380 7.2
December 2012 (Revised) 5,299 4,950 349 6.6
January 2012 (Benchmark) 5,237 4,864 373 7.1
MIAMI
January 2013 15,370 13,569 1,801 11.7
December 2012 (Revised) 15,053 13,432 1,621 10.8
January 2012 (Benchmark) 15,367 13,641 1,726 11.2
MONROE (BLOOMINGTON MSA)
January 2013 69,476 64,322 5,154 7.4
December 2012 (Revised) 69,132 64,288 4,844 7.0
January 2012 (Benchmark) 70,301 65,642 4,659 6.6
MONTGOMERY
January 2013 18,268 16,612 1,656 9.1
December 2012 (Revised) 17,988 16,473 1,515 8.4
January 2012 (Benchmark) 18,081 16,490 1,591 8.8
MORGAN (INDIANAPOLIS MSA)
January 2013 35,415 32,027 3,388 9.6
December 2012 (Revised) 35,223 32,347 2,876 8.2
January 2012 (Benchmark) 35,127 31,805 3,322 9.5
NEWTON (GARY)
January 2013 6,802 6,016 786 11.6
December 2012 (Revised) 6,726 6,093 633 9.4
January 2012 (Benchmark) 6,808 6,050 758 11.1
NOBLE
January 2013 21,594 19,342 2,252 10.4
December 2012 (Revised) 21,153 19,116 2,037 9.6
January 2012 (Benchmark) 21,456 19,233 2,223 10.4
Page 5
6. AREA LABOR FORCE EMPLOYED UNEMPLOYED RATE
OHIO (CINCINNATI MSA)
January 2013 3,065 2,736 329 10.7
December 2012 (Revised) 3,024 2,774 250 8.3
January 2012 (Benchmark) 3,074 2,776 298 9.7
ORANGE
January 2013 10,241 9,147 1,094 10.7
December 2012 (Revised) 9,759 8,808 951 9.7
January 2012 (Benchmark) 10,134 9,105 1,029 10.2
OWEN (BLOOMINGTON MSA)
January 2013 10,289 9,144 1,145 11.1
December 2012 (Revised) 10,125 9,139 986 9.7
January 2012 (Benchmark) 10,476 9,332 1,144 10.9
PARKE
January 2013 7,400 6,544 856 11.6
December 2012 (Revised) 7,400 6,645 755 10.2
January 2012 (Benchmark) 7,388 6,541 847 11.5
PERRY
January 2013 9,415 8,532 883 9.4
December 2012 (Revised) 9,497 8,700 797 8.4
January 2012 (Benchmark) 9,566 8,747 819 8.6
PIKE
January 2013 5,781 5,257 524 9.1
December 2012 (Revised) 5,709 5,218 491 8.6
January 2012 (Benchmark) 5,730 5,281 449 7.8
PORTER (GARY)
January 2013 81,909 74,271 7,638 9.3
December 2012 (Revised) 82,014 75,220 6,794 8.3
January 2012 (Benchmark) 81,379 74,686 6,693 8.2
POSEY (EVANSVILLE MSA)
January 2013 12,493 11,455 1,038 8.3
December 2012 (Revised) 12,454 11,597 857 6.9
January 2012 (Benchmark) 12,718 11,792 926 7.3
PULASKI
January 2013 6,607 6,048 559 8.5
December 2012 (Revised) 6,429 5,933 496 7.7
January 2012 (Benchmark) 6,569 6,067 502 7.6
PUTNAM (INDIANAPOLIS MSA)
January 2013 17,231 15,514 1,717 10.0
December 2012 (Revised) 17,136 15,669 1,467 8.6
January 2012 (Benchmark) 17,490 15,406 2,084 11.9
RANDOLPH
January 2013 12,555 11,108 1,447 11.5
December 2012 (Revised) 12,580 11,327 1,253 10.0
January 2012 (Benchmark) 12,624 11,196 1,428 11.3
RIPLEY
January 2013 14,384 12,825 1,559 10.8
December 2012 (Revised) 14,070 12,804 1,266 9.0
January 2012 (Benchmark) 14,223 12,790 1,433 10.1
RUSH
January 2013 8,811 8,030 781 8.9
December 2012 (Revised) 8,716 7,991 725 8.3
January 2012 (Benchmark) 8,826 8,056 770 8.7
SAINT JOSEPH (SOUTH BEND MSA)
January 2013 123,005 109,678 13,327 10.8
December 2012 (Revised) 124,541 112,619 11,922 9.6
January 2012 (Benchmark) 124,346 111,492 12,854 10.3
SCOTT
January 2013 10,954 9,850 1,104 10.1
December 2012 (Revised) 10,616 9,621 995 9.4
January 2012 (Benchmark) 10,923 9,761 1,162 10.6
Page 6
7. AREA LABOR FORCE EMPLOYED UNEMPLOYED RATE
SHELBY (INDIANAPOLIS MSA)
January 2013 22,815 20,731 2,084 9.1
December 2012 (Revised) 22,767 20,938 1,829 8.0
January 2012 (Benchmark) 22,718 20,587 2,131 9.4
SPENCER
January 2013 9,886 8,965 921 9.3
December 2012 (Revised) 9,868 9,064 804 8.1
January 2012 (Benchmark) 9,858 9,047 811 8.2
STARKE
January 2013 10,186 8,916 1,270 12.5
December 2012 (Revised) 10,023 8,938 1,085 10.8
January 2012 (Benchmark) 10,119 8,912 1,207 11.9
STEUBEN
January 2013 16,002 14,373 1,629 10.2
December 2012 (Revised) 15,600 14,162 1,438 9.2
January 2012 (Benchmark) 15,838 14,249 1,589 10.0
SULLIVAN (TERRE HAUTE MSA)
January 2013 8,784 7,614 1,170 13.3
December 2012 (Revised) 8,733 7,674 1,059 12.1
January 2012 (Benchmark) 8,589 7,661 928 10.8
SWITZERLAND
January 2013 5,396 4,954 442 8.2
December 2012 (Revised) 5,382 4,980 402 7.5
January 2012 (Benchmark) 5,398 5,009 389 7.2
TIPPECANOE (LAFAYETTE MSA)
January 2013 85,269 77,593 7,676 9.0
December 2012 (Revised) 84,900 78,470 6,430 7.6
January 2012 (Benchmark) 83,436 77,378 6,058 7.3
TIPTON (KOKOMO MSA)
January 2013 7,149 6,328 821 11.5
December 2012 (Revised) 7,215 6,589 626 8.7
January 2012 (Benchmark) 7,234 6,411 823 11.4
UNION
January 2013 3,340 3,010 330 9.9
December 2012 (Revised) 3,303 3,009 294 8.9
January 2012 (Benchmark) 3,364 3,031 333 9.9
VANDERBURGH (EVANSVILLE MSA)
January 2013 89,540 81,791 7,749 8.7
December 2012 (Revised) 89,651 82,804 6,847 7.6
January 2012 (Benchmark) 91,458 84,196 7,262 7.9
VERMILLION (TERRE HAUTE MSA)
January 2013 7,693 6,656 1,037 13.5
December 2012 (Revised) 7,652 6,709 943 12.3
January 2012 (Benchmark) 7,669 6,698 971 12.7
VIGO (TERRE HAUTE MSA)
January 2013 49,911 44,244 5,667 11.4
December 2012 (Revised) 49,671 44,592 5,079 10.2
January 2012 (Benchmark) 49,533 44,519 5,014 10.1
WABASH
January 2013 15,744 14,257 1,487 9.4
December 2012 (Revised) 15,401 14,058 1,343 8.7
January 2012 (Benchmark) 15,675 14,203 1,472 9.4
WARREN
January 2013 4,863 4,425 438 9.0
December 2012 (Revised) 4,754 4,415 339 7.1
January 2012 (Benchmark) 4,748 4,431 317 6.7
WARRICK (EVANSVILLE MSA)
January 2013 30,819 28,283 2,536 8.2
December 2012 (Revised) 30,791 28,633 2,158 7.0
January 2012 (Benchmark) 31,505 29,115 2,390 7.6
Page 7
8. AREA LABOR FORCE EMPLOYED UNEMPLOYED RATE
WASHINGTON (LOUISVILLE MSA)
January 2013 13,641 12,114 1,527 11.2
December 2012 (Revised) 13,293 12,177 1,116 8.4
January 2012 (Benchmark) 13,354 11,945 1,409 10.6
WAYNE
January 2013 30,071 26,702 3,369 11.2
December 2012 (Revised) 29,527 26,492 3,035 10.3
January 2012 (Benchmark) 30,078 26,783 3,295 11.0
WELLS (FORT WAYNE MSA)
January 2013 13,666 12,486 1,180 8.6
December 2012 (Revised) 13,623 12,614 1,009 7.4
January 2012 (Benchmark) 13,652 12,470 1,182 8.7
WHITE
January 2013 12,471 11,198 1,273 10.2
December 2012 (Revised) 12,079 11,042 1,037 8.6
January 2012 (Benchmark) 12,577 11,443 1,134 9.0
WHITLEY (FORT WAYNE MSA)
January 2013 17,105 15,491 1,614 9.4
December 2012 (Revised) 17,095 15,650 1,445 8.5
January 2012 (Benchmark) 16,969 15,471 1,498 8.8
CITIES (Population over 25,000)
ANDERSON CITY
January 2013 25,392 22,119 3,273 12.9
December 2012 (Revised) 25,282 22,420 2,862 11.3
January 2012 (Benchmark) 25,158 22,285 2,873 11.4
BLOOMINGTON CITY
January 2013 38,860 36,304 2,556 6.6
December 2012 (Revised) 38,900 36,285 2,615 6.7
January 2012 (Benchmark) 39,293 37,049 2,244 5.7
CARMEL CITY
January 2013 39,374 37,016 2,358 6.0
December 2012 (Revised) 39,720 37,385 2,335 5.9
January 2012 (Benchmark) 38,746 36,759 1,987 5.1
COLUMBUS CITY
January 2013 22,994 21,298 1,696 7.4
December 2012 (Revised) 23,041 21,520 1,521 6.6
January 2012 (Benchmark) 22,386 20,855 1,531 6.8
CROWN POINT
January 2013 13,195 11,867 1,328 10.1
December 2012 (Revised) 13,180 12,018 1,162 8.8
January 2012 (Benchmark) 13,174 11,933 1,241 9.4
EAST CHICAGO CITY
January 2013 9,720 8,333 1,387 14.3
December 2012 (Revised) 9,685 8,439 1,246 12.9
January 2012 (Benchmark) 9,611 8,380 1,231 12.8
ELKHART CITY
January 2013 22,675 19,835 2,840 12.5
December 2012 (Revised) 22,630 19,948 2,682 11.9
January 2012 (Benchmark) 22,167 19,232 2,935 13.2
EVANSVILLE CITY
January 2013 56,746 51,447 5,299 9.3
December 2012 (Revised) 56,755 52,084 4,671 8.2
January 2012 (Benchmark) 58,068 52,960 5,108 8.8
FISHERS TOWN
January 2013 43,955 41,458 2,497 5.7
December 2012 (Revised) 44,273 41,871 2,402 5.4
January 2012 (Benchmark) 43,278 41,170 2,108 4.9
FORT WAYNE CITY
January 2013 121,659 110,185 11,474 9.4
December 2012 (Revised) 121,686 111,316 10,370 8.5
January 2012 (Benchmark) 121,588 110,046 11,542 9.5
GARY CITY
January 2013 28,570 24,488 4,082 14.3
December 2012 (Revised) 28,623 24,801 3,822 13.4
January 2012 (Benchmark) 28,536 24,625 3,911 13.7
Page 8
9. AREA LABOR FORCE EMPLOYED UNEMPLOYED RATE
GOSHEN CITY
January 2013 14,174 12,810 1,364 9.6
December 2012 (Revised) 14,152 12,883 1,269 9.0
January 2012 (Benchmark) 13,928 12,421 1,507 10.8
GREENWOOD CITY
January 2013 27,325 25,191 2,134 7.8
December 2012 (Revised) 27,357 25,442 1,915 7.0
January 2012 (Benchmark) 27,123 25,016 2,107 7.8
HAMMOND CITY
January 2013 33,380 29,391 3,989 12.0
December 2012 (Revised) 33,385 29,766 3,619 10.8
January 2012 (Benchmark) 33,083 29,555 3,528 10.7
HOBART CITY
January 2013 14,142 12,286 1,856 13.1
December 2012 (Revised) 14,030 12,443 1,587 11.3
January 2012 (Benchmark) 13,885 12,355 1,530 11.0
INDIANAPOLIS CITY (CONS)
January 2013 422,264 381,977 40,287 9.5
December 2012 (Revised) 422,887 385,789 37,098 8.8
January 2012 (Benchmark) 417,779 379,326 38,453 9.2
INDIANAPOLIS CITY (CORE)
January 2013 417,811 377,944 39,867 9.5
December 2012 (Revised) 418,397 381,715 36,682 8.8
January 2012 (Benchmark) 413,193 375,320 37,873 9.2
JEFFERSONVILLE CITY
January 2013 22,144 20,510 1,634 7.4
December 2012 (Revised) 21,963 20,616 1,347 6.1
January 2012 (Benchmark) 22,028 20,223 1,805 8.2
KOKOMO CITY
January 2013 18,817 16,647 2,170 11.5
December 2012 (Revised) 19,347 17,332 2,015 10.4
January 2012 (Benchmark) 18,907 16,866 2,041 10.8
LAFAYETTE CITY
January 2013 35,037 31,612 3,425 9.8
December 2012 (Revised) 34,841 31,969 2,872 8.2
January 2012 (Benchmark) 34,422 31,524 2,898 8.4
LAWRENCE TOWN
January 2013 24,451 22,309 2,142 8.8
December 2012 (Revised) 24,467 22,532 1,935 7.9
January 2012 (Benchmark) 24,213 22,154 2,059 8.5
MARION CITY
January 2013 12,993 11,319 1,674 12.9
December 2012 (Revised) 12,715 11,212 1,503 11.8
January 2012 (Benchmark) 12,713 11,224 1,489 11.7
MERRILLVILLE TOWN
January 2013 17,151 15,393 1,758 10.3
December 2012 (Revised) 17,258 15,590 1,668 9.7
January 2012 (Benchmark) 17,127 15,479 1,648 9.6
MICHIGAN CITY CITY
January 2013 13,172 11,442 1,730 13.1
December 2012 (Revised) 13,196 11,661 1,535 11.6
January 2012 (Benchmark) 13,198 11,625 1,573 11.9
MISHAWAKA CITY
January 2013 23,939 21,389 2,550 10.7
December 2012 (Revised) 24,294 21,963 2,331 9.6
January 2012 (Benchmark) 24,302 21,743 2,559 10.5
MUNCIE CITY
January 2013 31,590 28,333 3,257 10.3
December 2012 (Revised) 31,859 28,825 3,034 9.5
January 2012 (Benchmark) 30,929 27,964 2,965 9.6
NEW ALBANY CITY
January 2013 17,334 15,560 1,774 10.2
December 2012 (Revised) 16,987 15,640 1,347 7.9
January 2012 (Benchmark) 17,060 15,342 1,718 10.1
Page 9
10. AREA LABOR FORCE EMPLOYED UNEMPLOYED RATE
NOBLESVILLE CITY
January 2013 27,335 25,152 2,183 8.0
December 2012 (Revised) 27,335 25,402 1,933 7.1
January 2012 (Benchmark) 26,918 24,977 1,941 7.2
PLAINFIELD TOWN
January 2013 13,837 12,690 1,147 8.3
December 2012 (Revised) 13,811 12,817 994 7.2
January 2012 (Benchmark) 13,608 12,602 1,006 7.4
PORTAGE CITY
January 2013 17,773 15,899 1,874 10.5
December 2012 (Revised) 17,812 16,102 1,710 9.6
January 2012 (Benchmark) 17,642 15,988 1,654 9.4
RICHMOND CITY
January 2013 15,227 13,552 1,675 11.0
December 2012 (Revised) 15,010 13,445 1,565 10.4
January 2012 (Benchmark) 15,284 13,593 1,691 11.1
SCHERERVILLE TOWN
January 2013 15,175 13,921 1,254 8.3
December 2012 (Revised) 15,292 14,098 1,194 7.8
January 2012 (Benchmark) 15,021 13,998 1,023 6.8
SOUTH BEND CITY
January 2013 43,008 37,668 5,340 12.4
December 2012 (Revised) 43,473 38,678 4,795 11.0
January 2012 (Benchmark) 43,498 38,291 5,207 12.0
TERRE HAUTE CITY
January 2013 26,671 23,581 3,090 11.6
December 2012 (Revised) 26,549 23,766 2,783 10.5
January 2012 (Benchmark) 26,510 23,727 2,783 10.5
VALPARAISO CITY
January 2013 15,734 14,409 1,325 8.4
December 2012 (Revised) 15,785 14,593 1,192 7.6
January 2012 (Benchmark) 15,703 14,489 1,214 7.7
WEST LAFAYETTE CITY
January 2013 13,417 12,577 840 6.3
December 2012 (Revised) 13,469 12,719 750 5.6
January 2012 (Benchmark) 13,146 12,542 604 4.6
WESTFIELD CITY
January 2013 14,938 14,063 875 5.9
December 2012 (Revised) 14,999 14,204 795 5.3
January 2012 (Benchmark) 14,709 13,966 743 5.1
NOTES: 1) PRELIMINARY DATA WILL BE REVISED THE FOLLWING MONTH
2) CITY DATA IS USING A NEW METHODOLOGY, THEREFORE IT IS NOT COMPARABLE WITH 2004.
3) INDIANAPOLIS CITY DATA IS NOW LISTED FOR THE INCORPORATED CITY (CORE) AND THE CONSOLIDATED CITY (CONS).
*Starting with January 2005 data, new MSA definitions are used. These will be revised back to 2000.
*Also starting with January 2005, new methodology is being used. It will be used back to 2000.
INDIANA DEPARTMENT OF WORKFORCE DEVELOPMENT
RESEARCH & ANALYSIS
LOCAL AREA UNEMPLOYMENT STATISTICS (LAUS)
10 NORTH SENATE AVENUE PH: (317) 232-1748
INDIANAPOLIS, INDIANA 46204
Page 10